By Helgi Library - November 3, 2019
Yes Bank stock traded at INR 273 per share at the end 2018 implying a market capitalization of USD 9,125 mil. Since the end of 2013, th...
By Helgi Library - November 3, 2019
Yes Bank made a net profit of INR 17.1 bil in 2018, down 59.6% compared to the previous year. This implies a return on equity of...
By Helgi Library - November 3, 2019
Yes Bank stock traded at INR 273 per share at the end of 2018 implying a market capitalization of USD 9,125 mil. Since the end of 2013,...
| Profit Statement | 2016 | 2017 | 2018 | |
| Net Interest Income | INR bil | 58.0 | 77.4 | 98.1 |
| Net Fee Income | INR bil | 32.0 | 42.1 | 36.4 |
| Other Income | INR bil | 10.2 | 10.9 | 10.4 |
| Total Revenues | INR bil | 100 | 130 | 145 |
| Operating Profit | INR bil | 58.5 | 77.1 | 78.5 |
| Provisions | INR bil | 8.00 | 15.1 | 55.0 |
| Net Profit | INR bil | 33.4 | 42.3 | 17.1 |
| Balance Sheet | 2016 | 2017 | 2018 | |
| Interbank Loans | INR bil | 126 | 133 | 162 |
| Customer Loans | INR bil | 1,323 | 2,035 | 2,414 |
| Total Assets | INR bil | 2,151 | 3,125 | 3,809 |
| Shareholders' Equity | INR bil | 220 | 258 | 269 |
| Interbank Borrowing | INR bil | 152 | 222 | 322 |
| Customer Deposits | INR bil | 1,429 | 2,007 | 2,276 |
| Issued Debt Securities | INR bil | 240 | 536 | 766 |
| Ratios | 2016 | 2017 | 2018 | |
| ROE | % | 18.7 | 17.7 | 6.49 |
| ROA | % | 1.76 | 1.60 | 0.493 |
| Costs (As % Of Assets) | % | 2.19 | 2.02 | 1.91 |
| Costs (As % Of Income) | % | 41.6 | 40.8 | 45.8 |
| Capital Adequacy Ratio | % | 17.0 | 18.4 | 16.5 |
| Net Interest Margin | % | 3.05 | 2.93 | 2.83 |
| Loans (As % Of Deposits) | % | 92.6 | 101 | 106 |
| NPLs (As % Of Loans) | % | 1.52 | 1.29 | 3.27 |
| Provisions (As % Of NPLs) | % | 46.9 | ... | ... |
| Valuation | 2016 | 2017 | 2018 | |
| Price/Earnings (P/E) | 21.1 | 16.6 | 37.3 | |
| Price/Book Value (P/BV) | 3.20 | 2.73 | 2.37 | |
| Dividend Yield | % | 0.776 | 0.886 | 0.727 |
| Earnings Per Share (EPS) | INR | 15.4 | 18.1 | 7.33 |
| Book Value Per Share | INR | 102 | 110 | 115 |
| Dividend Per Share | INR | 2.53 | 2.66 | 1.99 |
Get all company financials in excel:
| summary | Unit | 2008 | 2009 | 2010 | 2011 | 2012 | 2013 | 2014 | 2015 | 2016 | 2017 | 2018 |
| income statement | ||||||||||||
| Net Interest Income | INR bil | 22.2 | 27.2 | 34.9 | 45.7 | 58.0 | ||||||
| Total Revenues | INR bil | 34.8 | 43.5 | 56.0 | 72.9 | 100 | ||||||
| Operating Profit | INR bil | 21.5 | 25.8 | 32.8 | 42.9 | 58.5 | ||||||
| Net Profit | INR bil | 13.0 | 16.1 | 20.0 | 25.3 | 33.4 | ||||||
| balance sheet | ||||||||||||
| Interbank Loans | INR bil | 7.27 | 13.5 | 23.2 | 24.4 | 126 | ||||||
| Customer Loans | INR bil | 470 | 556 | 755 | 982 | 1,323 | ||||||
| Debt Securities | INR bil | 430 | 409 | 466 | 488 | 500 | ||||||
| Total Assets | INR bil | 991 | 1,090 | 1,361 | 1,652 | 2,151 | ||||||
| Shareholders' Equity | INR bil | 58.1 | 71.2 | 117 | 138 | 220 | ||||||
| Interbank Borrowing | INR bil | 129 | 114 | 99.3 | 105 | 152 | ||||||
| Customer Deposits | INR bil | 670 | 742 | 912 | 1,117 | 1,429 | ||||||
| Issued Debt Securities | INR bil | 81.6 | 101 | 166 | 215 | 240 | ||||||
| ratios | ||||||||||||
| ROE | % | 24.8 | 24.9 | 21.3 | 19.9 | 18.7 | ||||||
| ROA | % | 1.51 | 1.55 | 1.63 | 1.68 | 1.76 | ||||||
| Costs (As % Of Assets) | % | 1.54 | 1.70 | 1.89 | 1.99 | 2.19 | ||||||
| Costs (As % Of Income) | % | 38.3 | 40.6 | 41.4 | 41.2 | 41.6 | ||||||
| Capital Adequacy Ratio | % | ... | 16.2 | 14.4 | 15.6 | 16.5 | 17.0 | |||||
| Net Interest Margin | % | 2.57 | 2.61 | 2.85 | 3.03 | 3.05 | ||||||
| Interest Income (As % Of Revenues) | % | 63.8 | 62.4 | 62.4 | 62.6 | 57.9 | ||||||
| Fee Income (As % Of Revenues) | % | 30.9 | 29.0 | 35.4 | 33.9 | 32.0 | ||||||
| Equity (As % Of Assets) | % | 5.86 | 6.53 | 8.57 | 8.33 | 10.2 | ||||||
| Loans (As % Of Deposits) | % | 70.2 | 75.0 | 82.9 | 87.9 | 92.6 | ||||||
| Loans (As % Assets) | % | 47.4 | 51.0 | 55.5 | 59.4 | 61.5 | ||||||
| NPLs (As % Of Loans) | % | 0.200 | 0.314 | 0.414 | 0.759 | 1.52 | ||||||
| Provisions (As % Of NPLs) | % | 92.6 | 85.1 | 72.0 | 62.0 | 46.9 | ... | ... | ||||
| valuation | ||||||||||||
| Market Capitalisation (End Of Period) | USD mil | 2,807 | 2,416 | 5,405 | 5,485 | 10,390 | ||||||
| Number Of Shares (Average) | mil | 1,829 | 1,824 | 2,089 | 2,141 | 2,169 | ||||||
| Share Price (End Of Period) | INR | 84.1 | 81.9 | 163 | 170 | 326 | ||||||
| Earnings Per Share (EPS) | INR | 7.11 | 8.83 | 9.56 | 11.8 | 15.4 | ||||||
| Book Value Per Share | INR | 31.7 | 39.0 | 55.9 | 64.3 | 102 | ||||||
| Dividend Per Share | INR | 1.18 | 1.58 | 1.80 | 1.96 | 2.53 | ||||||
| Price/Earnings (P/E) | 11.8 | 9.27 | 17.1 | 14.4 | 21.1 | |||||||
| Price/Book Value (P/BV) | 2.65 | 2.10 | 2.92 | 2.64 | 3.20 | |||||||
| Dividend Yield | % | 1.40 | 1.93 | 1.10 | 1.16 | 0.776 | ||||||
| Earnings Per Share Growth | % | ... | 31.0 | 24.2 | 8.26 | 23.6 | 30.3 | |||||
| Book Value Per Share Growth | % | ... | 22.2 | 22.9 | 43.2 | 15.1 | 58.1 |
| income statement | Unit | 2008 | 2009 | 2010 | 2011 | 2012 | 2013 | 2014 | 2015 | 2016 | 2017 | 2018 |
| income statement | ||||||||||||
| Interest Income | INR bil | 82.9 | 99.8 | 116 | 135 | 164 | ||||||
| Interest Cost | INR bil | 60.8 | 72.6 | 80.8 | 89.7 | 106 | ||||||
| Net Interest Income | INR bil | 22.2 | 27.2 | 34.9 | 45.7 | 58.0 | ||||||
| Net Fee Income | INR bil | 10.8 | 12.6 | 19.8 | 24.8 | 32.0 | ||||||
| Other Income | INR bil | 1.85 | 3.75 | 1.29 | 2.50 | 10.2 | ||||||
| Total Revenues | INR bil | 34.8 | 43.5 | 56.0 | 72.9 | 100 | ||||||
| Operating Cost | INR bil | 13.3 | 17.7 | 23.2 | 30.0 | 41.6 | ||||||
| Operating Profit | INR bil | 21.5 | 25.8 | 32.8 | 42.9 | 58.5 | ||||||
| Provisions | INR bil | 2.22 | 2.64 | 3.74 | 5.36 | 8.00 | ||||||
| Extra and Other Cost | INR bil | 0.005 | < 0.001 | 0.002 | < -0.001 | < -0.001 | ||||||
| Pre-Tax Profit | INR bil | 19.3 | 23.2 | 29.0 | 37.6 | 50.5 | ||||||
| Tax | INR bil | 6.25 | 7.09 | 9.05 | 12.3 | 17.1 | ||||||
| Minorities | INR bil | 0 | 0 | 0 | 0 | 0 | ||||||
| Net Profit | INR bil | 13.0 | 16.1 | 20.0 | 25.3 | 33.4 | ||||||
| Dividends | INR bil | 2.15 | 2.89 | 3.76 | 4.21 | 5.48 | ||||||
| growth rates | ||||||||||||
| Net Interest Income Growth | % | ... | 37.3 | 22.4 | 28.4 | 30.9 | 26.9 | |||||
| Net Fee Income Growth | % | ... | 40.2 | 17.2 | 56.9 | 25.2 | 29.3 | |||||
| Total Revenue Growth | % | ... | 41.6 | 25.1 | 28.6 | 30.4 | 37.3 | |||||
| Operating Cost Growth | % | ... | 39.5 | 32.9 | 31.1 | 29.5 | 38.6 | |||||
| Operating Profit Growth | % | ... | 42.9 | 20.3 | 26.8 | 31.0 | 36.4 | |||||
| Pre-Tax Profit Growth | % | ... | 32.8 | 20.5 | 25.1 | 29.4 | 34.5 | |||||
| Net Profit Growth | % | ... | 33.1 | 23.9 | 24.0 | 26.6 | 32.0 | |||||
| market share | ||||||||||||
| Market Share in Revenues | % | ... | ... | ... | 1.47 | 1.61 | 1.84 | 2.17 | 2.49 | ... | ||
| Market Share in Net Profit | % | ... | ... | ... | 2.20 | 2.99 | 3.66 | 6.15 | ... | ... | ... |
| balance sheet | Unit | 2008 | 2009 | 2010 | 2011 | 2012 | 2013 | 2014 | 2015 | 2016 | 2017 | 2018 |
| balance sheet | ||||||||||||
| Cash | INR bil | 33.4 | 45.4 | 52.4 | 57.8 | 69.5 | ||||||
| Interbank Loans | INR bil | 7.27 | 13.5 | 23.2 | 24.4 | 126 | ||||||
| Customer Loans | INR bil | 470 | 556 | 755 | 982 | 1,323 | ||||||
| Debt Securities | INR bil | 430 | 409 | 466 | 488 | 500 | ||||||
| Fixed Assets | INR bil | 2.30 | 2.97 | 3.22 | 4.75 | 6.87 | ||||||
| Total Assets | INR bil | 991 | 1,090 | 1,361 | 1,652 | 2,151 | ||||||
| Shareholders' Equity | INR bil | 58.1 | 71.2 | 117 | 138 | 220 | ||||||
| Of Which Minority Interest | INR bil | 0 | 0 | 0 | 0 | 0 | ||||||
| Liabilities | INR bil | 933 | 1,019 | 1,245 | 1,515 | 1,930 | ||||||
| Interbank Borrowing | INR bil | 129 | 114 | 99.3 | 105 | 152 | ||||||
| Customer Deposits | INR bil | 670 | 742 | 912 | 1,117 | 1,429 | ||||||
| Sight Deposits | INR bil | 66.6 | 70.2 | 85.0 | 109 | 191 | ||||||
| Term Deposits | INR bil | 603 | 672 | 827 | 1,008 | 1,238 | ||||||
| Issued Debt Securities | INR bil | 81.6 | 101 | 166 | 215 | 240 | ||||||
| Other Liabilities | INR bil | 52.9 | 61.8 | 67.6 | 78.0 | 110 | ||||||
| asset quality | ||||||||||||
| Non-Performing Loans | INR bil | 0.943 | 1.75 | 3.13 | 7.49 | 20.2 | ||||||
| Gross Loans | INR bil | 471 | 558 | 758 | 987 | 1,332 | ||||||
| Total Provisions | INR bil | 0.873 | 1.49 | 2.26 | 4.65 | 9.46 | ... | ... | ||||
| growth rates | ||||||||||||
| Customer Loan Growth | % | ... | 23.7 | 18.4 | 35.8 | 30.0 | 34.7 | |||||
| Total Asset Growth | % | ... | 34.5 | 9.99 | 24.9 | 21.4 | 30.1 | |||||
| Shareholders' Equity Growth | % | ... | 24.2 | 22.5 | 64.0 | 18.0 | 60.1 | |||||
| Customer Deposit Growth | % | ... | 36.2 | 10.8 | 22.9 | 22.5 | 27.9 | |||||
| market share | ||||||||||||
| Market Share in Customer Loans | % | 0.851 | 0.866 | 1.06 | 1.23 | 1.60 | ... | |||||
| Market Share in Total Assets | % | 1.14 | 1.08 | 1.22 | 1.31 | 1.51 | ... | |||||
| Market Share in Customer Deposits | % | 1.06 | 1.03 | 1.12 | 1.22 | 1.34 | ... |
| ratios | Unit | 2008 | 2009 | 2010 | 2011 | 2012 | 2013 | 2014 | 2015 | 2016 | 2017 | 2018 |
| ratios | ||||||||||||
| ROE | % | 24.8 | 24.9 | 21.3 | 19.9 | 18.7 | ||||||
| ROA | % | 1.51 | 1.55 | 1.63 | 1.68 | 1.76 | ||||||
| Costs (As % Of Assets) | % | 1.54 | 1.70 | 1.89 | 1.99 | 2.19 | ||||||
| Costs (As % Of Income) | % | 38.3 | 40.6 | 41.4 | 41.2 | 41.6 | ||||||
| Capital Adequacy Ratio | % | ... | 16.2 | 14.4 | 15.6 | 16.5 | 17.0 | |||||
| Tier 1 Ratio | % | ... | 9.85 | 9.80 | 11.5 | 10.7 | 13.3 | |||||
| Net Interest Margin | % | 2.57 | 2.61 | 2.85 | 3.03 | 3.05 | ||||||
| Interest Spread | % | ... | 2.11 | 2.15 | 2.30 | 2.48 | 2.47 | |||||
| Asset Yield | % | 9.60 | 9.59 | 9.44 | 8.98 | 8.64 | ||||||
| Cost Of Liabilities | % | ... | 7.49 | 7.44 | 7.14 | 6.50 | 6.17 | |||||
| Payout Ratio | % | 16.5 | 17.9 | 18.8 | 16.6 | 16.4 | ||||||
| Interest Income (As % Of Revenues) | % | 63.8 | 62.4 | 62.4 | 62.6 | 57.9 | ||||||
| Fee Income (As % Of Revenues) | % | 30.9 | 29.0 | 35.4 | 33.9 | 32.0 | ||||||
| Other Income (As % Of Revenues) | % | 5.31 | 8.61 | 2.30 | 3.43 | 10.2 | ||||||
| Equity (As % Of Assets) | % | 5.86 | 6.53 | 8.57 | 8.33 | 10.2 | ||||||
| Loans (As % Of Deposits) | % | 70.2 | 75.0 | 82.9 | 87.9 | 92.6 | ||||||
| Loans (As % Assets) | % | 47.4 | 51.0 | 55.5 | 59.4 | 61.5 | ||||||
| NPLs (As % Of Loans) | % | 0.200 | 0.314 | 0.414 | 0.759 | 1.52 | ||||||
| Provisions (As % Of NPLs) | % | 92.6 | 85.1 | 72.0 | 62.0 | 46.9 | ... | ... | ||||
| Provisions (As % Of Loans) | % | 0.186 | 0.268 | 0.299 | 0.473 | 0.715 | ... | ... | ||||
| Cost of Provisions (As % Of Loans) | % | 0.523 | 0.514 | 0.570 | 0.617 | 0.694 |
| other data | Unit | 2008 | 2009 | 2010 | 2011 | 2012 | 2013 | 2014 | 2015 | 2016 | 2017 | 2018 |
| other data | ||||||||||||
| Employees | 7,024 | 8,798 | 10,810 | 13,000 | 15,000 | |||||||
| Sight (As % Of Customer Deposits) | % | 9.95 | 9.46 | 9.32 | 9.78 | 13.4 |
Get all company financials in excel:

By Helgi Library - November 3, 2019
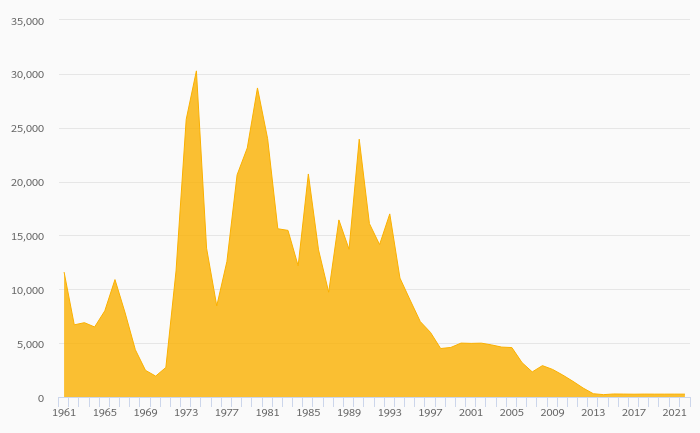
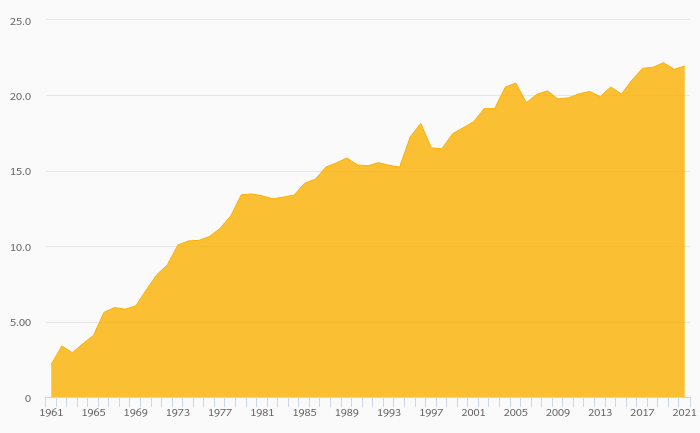
Yes Bank generated total banking revenues of INR 145 bil in 2018, up 11.2% compared to the previous year. Historically, the bank’s revenues containing of interest, fee and other non-interest income reached an all time high of INR 145 bil in 2018 and an all time...
By Helgi Library - November 3, 2019
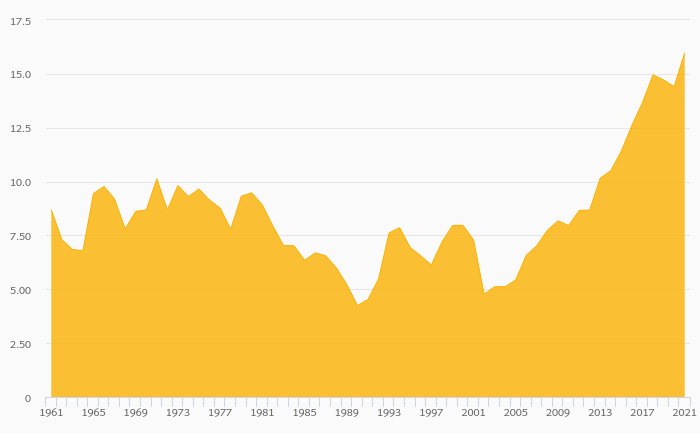
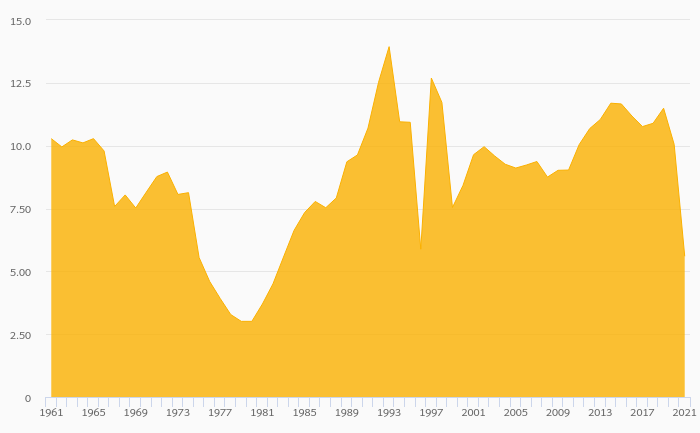
Yes Bank's net interest margin amounted to 2.83% in 2018, down from 2.93% compared to the previous year. Historically, the bank’s net interest margin reached an all time high of 3.05% in 2016 and an all time low of 2.44% in 2011. The average margin in t...
By Helgi Library - November 3, 2019
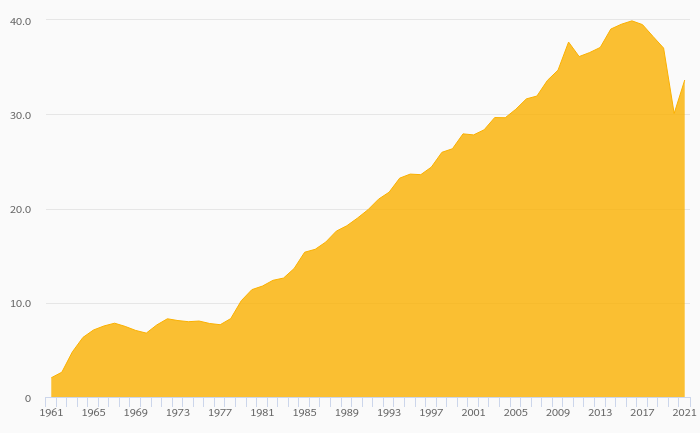
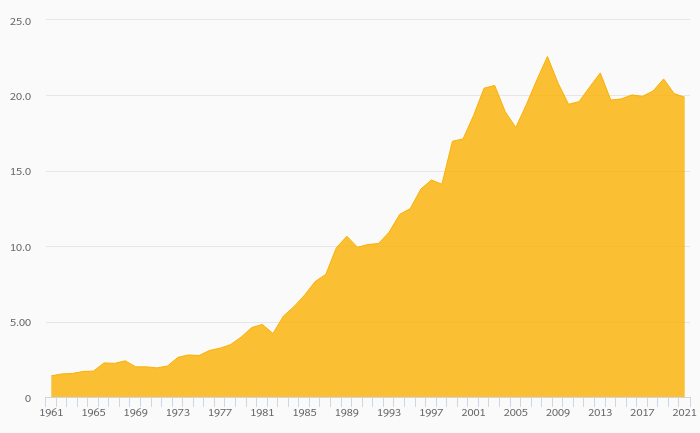
Yes Bank's capital adequacy ratio reached 16.5% at the end of 2018, down from 18.4% compared to the previous year. Historically, the bank’s capital ratio hit an all time high of 20.6% in 2009 and an all time low of 14.4% in 2013. The Tier 1 ratio amounted to ...
By Helgi Library - November 3, 2019
Yes Bank's customer loan growth reached 18.6% in 2018, down from 53.9% compared to the previous year. Historically, the bank’s loans growth reached an all time high of 78.9% in 2009 and an all time low of 10.5% in 2011. In the last decade, the average ann...
By Helgi Library - November 3, 2019
Yes Bank's customer deposits reached INR 2,007 bil in 2017, up 40.5% compared to the previous year. Indian banking sector accepted customer deposits of INR 110,303 bil in 2017, up 3.61% when compared to the last year. Yes Bank accounted for 1.82% of all c...
By Helgi Library - November 3, 2019
Yes Bank generated total banking revenues of INR 130 bil in 2017, up 30.1% compared to the previous year. Indian banking sector banking sector generated total revenues of INR 4,320,359 mil in 2017, up 7.41% when compared to the last year. As a r...
By Helgi Library - November 3, 2019
Yes Bank's customer loans reached INR 2,035 bil in 2017, up 53.9% compared to the previous year. Indian banking sector provided customer loans of INR 88,362 bil in 2017, up 7.04% when compared to the last year. Yes Bank accounted for 2.30% of all customer...
By Helgi Library - November 4, 2019
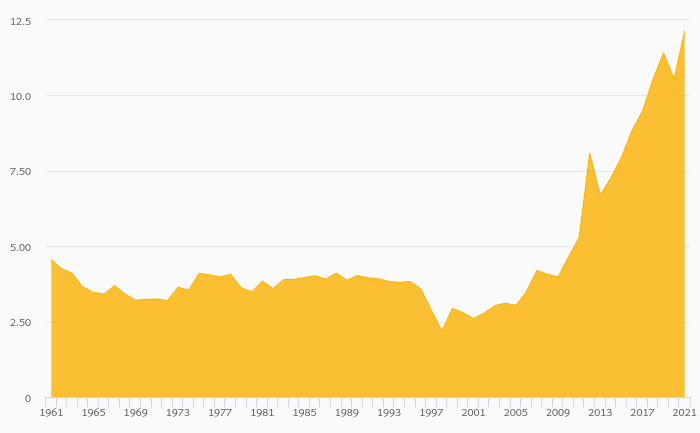
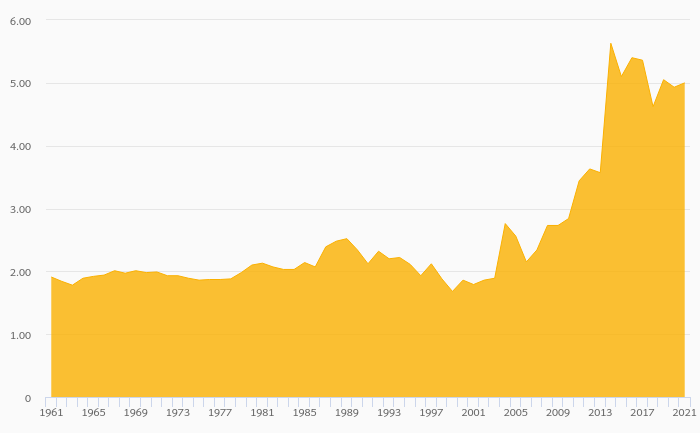
Yes Bank's non-performing loans reached 1.52% of total loans at the end of 2016, up from 0.759% compared to the previous year. Historically, the NPL ratio hit an all time high of 1.52% in 2016 and an all time low of 0.200% in 2012. Provision coverage amount...

Yes Bank has been growing its revenues and asset by 27.2% and 28.4% a year on average in the last 5 years. Its loans and deposits have grown by 34.1% and 25.1% a year during that time and loans to deposits ratio reached 106% at the end of 2018. The company achieved an average return on equity of 16.8% in the last five years with net profit growing 1.19% a year on average. In terms of operating efficiency, its cost to income ratio reached 45.8% in 2018, compared to 42.2% average in the last five years.
Equity represented 7.06% of total assets or 11.1% of loans at the end of 2018. Yes Bank's non-performing loans were 3.27% of total loans while provisions covered some of NPLs at the end of 2018.
Yes Bank stock traded at INR 273 per share at the end of 2018 resulting in a market capitalization of USD 9,125 mil. Over the previous five years, stock price rose by 234% or 27.3% a year on average. That’s compared to an average ROE of 16.8% the bank generated for its shareholders. This closing price put stock at a 12-month trailing price to earnings (PE) of 37.3x and price to book value (PBV) of 2.37x in 2018.
 Helgi Library