Sales of new cars decreased by 48.5 thousand in July compared to last year
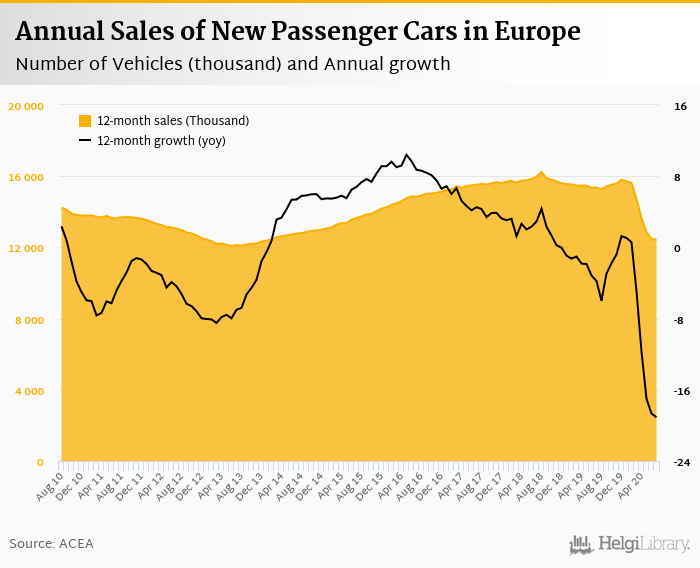
In the first seven months of the year, the decline reached 34.6% yoy
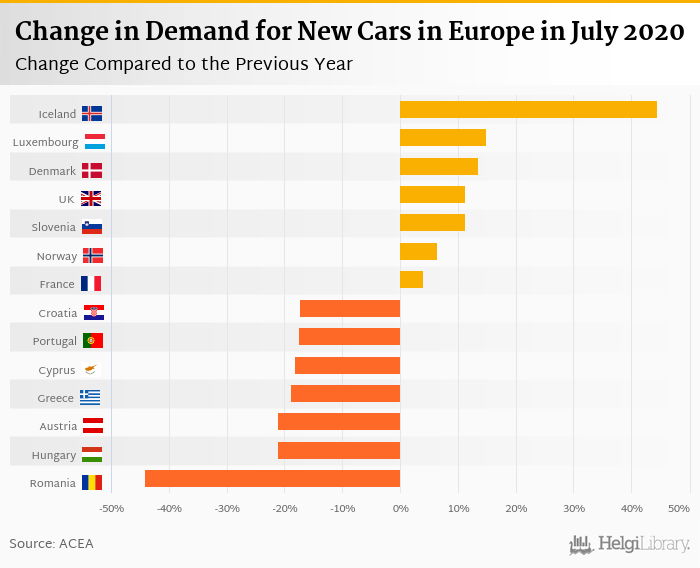
Iceland performed relatively the best (44.5%) while sales in Romania showed the weakest change compared to the last year (-44.2%)
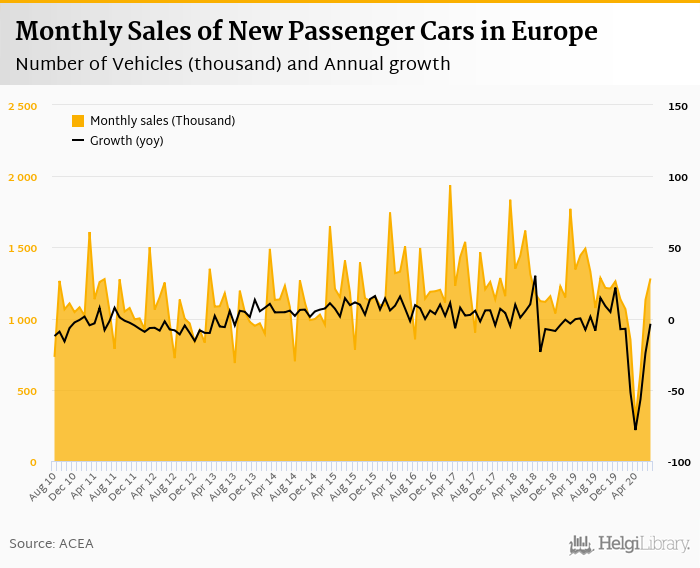
Sales of new passenger cars reached 1,282 thousand in July 2020 in the enlarged Europe (EU plus Iceland, Norway and Switzerland), according to ACEA. This is 3.64%, or 48.5 thousand less than in the previous year. In the first seven months of 2020, some 6,385 thousand cars were sold in Europe, down 34.6% yoy.
Historically, between 1990 and 2020, sales of passenger cars in Europe reached a high of 1,937 thousand in March 2017 and a low of 292 thousand in April 2020.
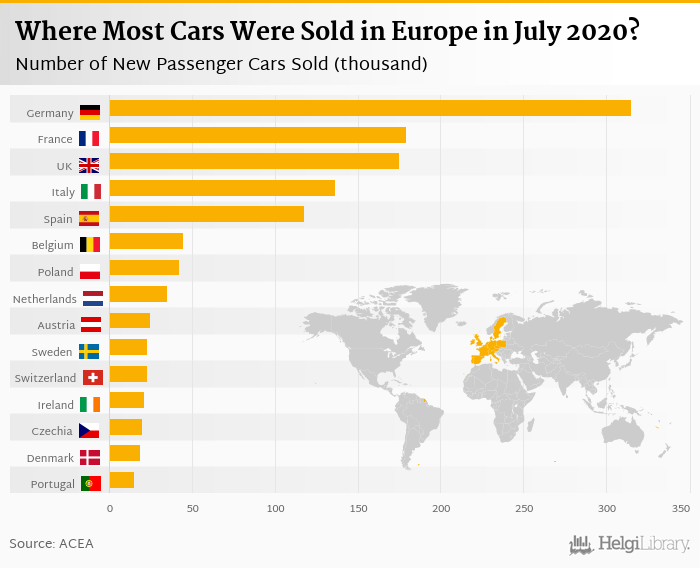
In July, most vehicles (315 thousand) were sold in Germany (down 5.36% yoy), followed by France (179 thousand, up 3.92%), the United Kingdom with 175 thousand cars (up 11.3%), 137 thousand new vehicles were registered in Italy (down 10.8%) and 118 thousand in Spain (up 1.06%). The five largest countries accounted for 62.8% of total new vehicles registered in July 2020.
In absolute terms, the best performance in sales of new cars has been seen in the United Kingdom (up 17.7 thousand cars) and France (up 6.76 thousand cars). At the other end of the scale, Germany and Italy showed the biggest drop in registration of new cars in July when compared to last year (down 17.9 thousand and down 16.5 thousand cars, respectively).
In relative terms, sales in Iceland (+44.5%) and Luxembourg (+14.9%) declined the least compared to a year ago, whereas registration in Romania and Hungary dropped the most (-44.2% and -21.2% yoy), in July 2020, according to ACEA:
In the first seven months of the year, some 6,385 thousand cars were sold in Europe, down 34.6% yoy. The table below shows details of the sales for each of the European country:
| Country | July 2020 | July 2019 | YOY Change % | 1-7/2020 | 1-7/2019 | YOY Change % |
|---|---|---|---|---|---|---|
| Austria | 24.8 | 31.4 | -21.1 | 138 | 207 | -33.6 |
| Belgium | 44.5 | 45.1 | -1.28 | 261 | 356 | -26.6 |
| Bulgaria | 3.13 | 3.12 | 0.224 | 13.3 | 21.4 | -38.0 |
| Croatia | 5.13 | 6.21 | -17.4 | 22.6 | 44.4 | -49.2 |
| Cyprus | 1.06 | 1.29 | -18.2 | 5.97 | 7.87 | -24.1 |
| Czech Republic | 19.8 | 21.8 | -9.38 | 115 | 150 | -23.6 |
| Denmark | 19.0 | 16.7 | 13.4 | 107 | 139 | -22.8 |
| Estonia | 2.01 | 2.43 | -17.2 | 11.1 | 16.4 | -31.9 |
| Finland | 9.10 | 9.22 | -1.25 | 56.5 | 69.5 | -18.7 |
| France | 179 | 172 | 3.92 | 895 | 1,339 | -33.2 |
| Germany | 315 | 333 | -5.36 | 1,526 | 2,182 | -30.1 |
| Greece | 9.52 | 11.7 | -18.8 | 46.1 | 77.3 | -40.4 |
| Hungary | 12.0 | 15.3 | -21.2 | 67.7 | 89.8 | -24.6 |
| Iceland | 1.48 | 1.02 | 44.5 | 5.67 | 8.32 | -31.8 |
| Ireland | 21.2 | 24.7 | -14.2 | 75.5 | 105 | -28.4 |
| Italy | 137 | 153 | -10.8 | 720 | 1,233 | -41.6 |
| Latvia | 1.50 | 1.72 | -12.6 | 8.07 | 11.2 | -28.0 |
| Lithuania | 3.36 | 3.57 | -5.78 | 20.2 | 27.0 | -25.4 |
| Luxembourg | 5.51 | 4.80 | 14.9 | 26.3 | 35.9 | -26.8 |
| Netherlands | 34.9 | 33.8 | 3.18 | 194 | 262 | -26.1 |
| Norway | 9.77 | 9.18 | 6.47 | 69.0 | 87.4 | -21.0 |
| Poland | 42.4 | 49.1 | -13.5 | 222 | 327 | -32.1 |
| Portugal | 15.2 | 18.4 | -17.5 | 80.1 | 147 | -45.5 |
| Romania | 13.0 | 23.2 | -44.2 | 62.6 | 94.8 | -34.0 |
| Slovakia | 8.26 | 9.44 | -12.5 | 42.3 | 54.4 | -22.3 |
| Slovenia | 6.43 | 5.78 | 11.2 | 34.2 | 45.6 | -25.0 |
| Spain | 118 | 117 | 1.06 | 458 | 809 | -43.4 |
| Sweden | 22.7 | 23.7 | -3.97 | 148 | 192 | -22.5 |
| Switzerland | 22.6 | 25.5 | -11.3 | 126 | 183 | -31.1 |
| United Kingdom | 175 | 157 | 11.3 | 828 | 1,426 | -41.9 |
| EU + EFTA | 1,282 | 1,330 | -3.64 | 6,385 | 9,756 | -34.6 |
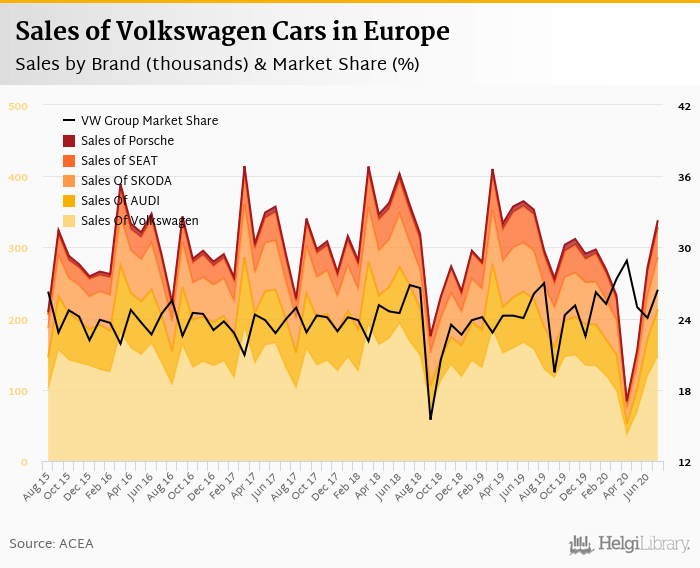
Volkswagen Group sold the most cars in July 2020 in Europe, some 339 thousand vehicles representing 26.4% of the European market. Sales of PSA Group amounted to 178 thousand vehicles (or 13.9% of the market) while Renault Group and Hyundai Group held 10.7% and 7.20% of the European market in July. Overall, the five largest manufacturers sold 65.4% of all new cars in July:
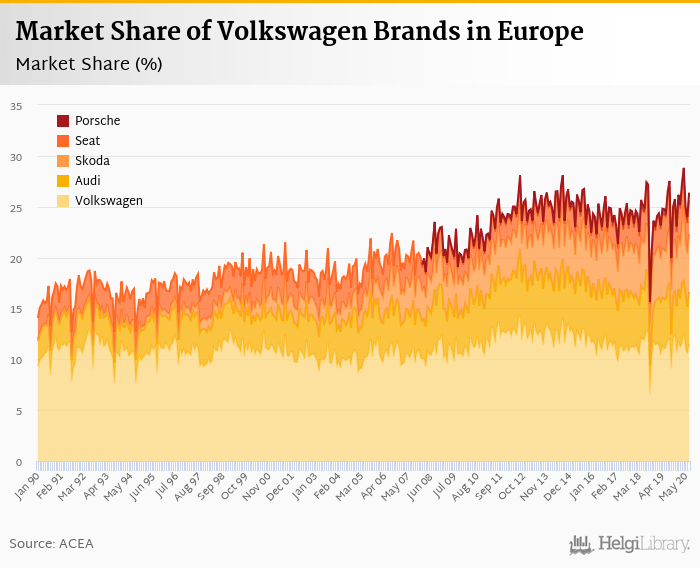
Volkswagen Group sold 339 thousand new passenger cars representing a 26.4% share of all new passenger cars sold in Europe in July 2020. This is 2.37% fewer vehicles and a 0.346 pp increase in market share when compared to last year. Looking back three years, VW's market share was 23.9%.
The Group sold 148 thousand of Volkswagen brand cars in July, followed by 72.9 thousand of Skodas and 65.3 thousand of Audis. Seat sold 42.4 thousand vehicles and Porsche some 9.87 thousand cars in July 2020:
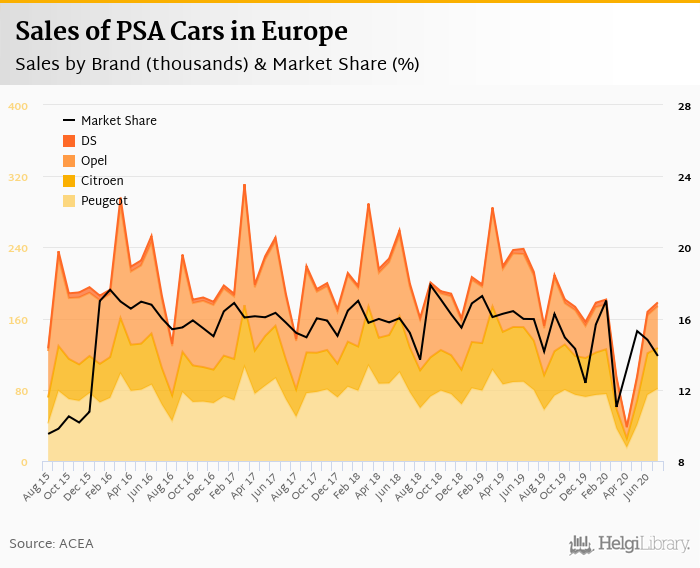
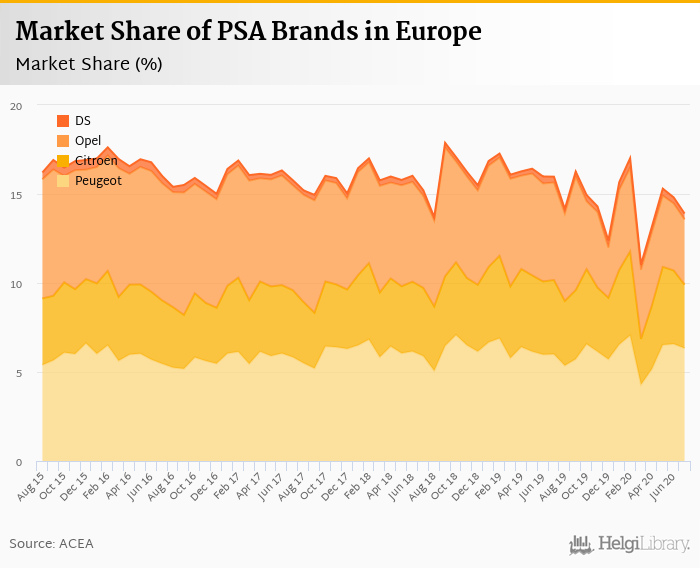
PSA Group sold 178 thousand new passenger cars representing a 13.9% share of all new passenger cars sold in Europe in July 2020. This is 16.1% fewer vehicles and a 2.07 pp decrease in market share when compared to last year. By comparison, the market share three years ago stood at 15.8% and is down by 1.88 pp now.
The Group sold 81.2 thousand of Peugeots cars, followed by 46.9 thousand of Opels and 45.8 thousand of Citroens in July 2020:
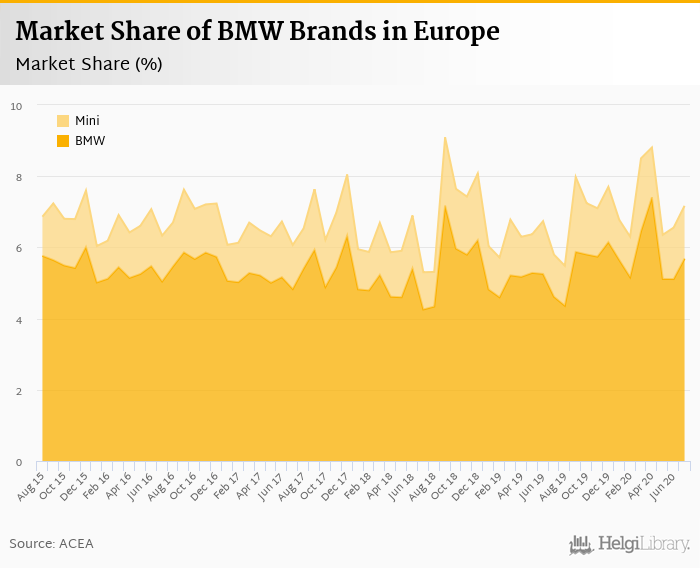
BMW Group sold 91.9 thousand new passenger cars representing a 7.17% share of all new passenger cars sold in Europe in July 2020. This is 19.0% more vehicles but a 1.37 pp increase in market share when compared to last year. Compared to three years ago, BMW Group's market share is now 1.09 pp higher.
The group sold 72.9 thousand of BMW brand cars, followed by 19.0 thousand of Minis in July 2020:

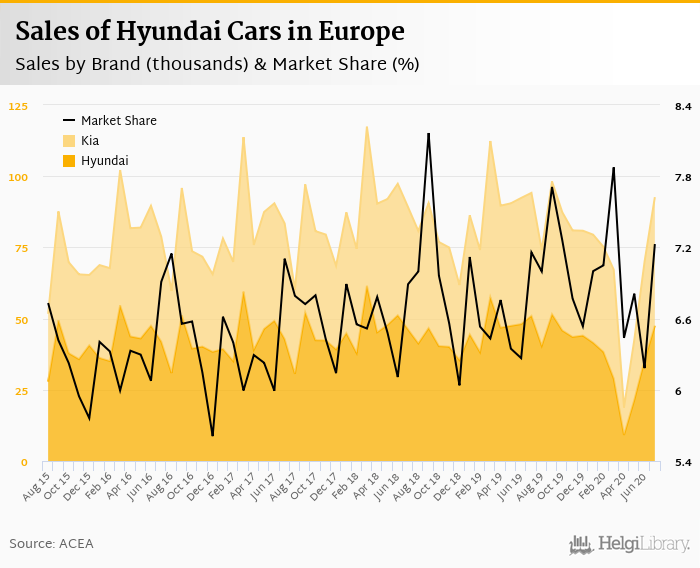
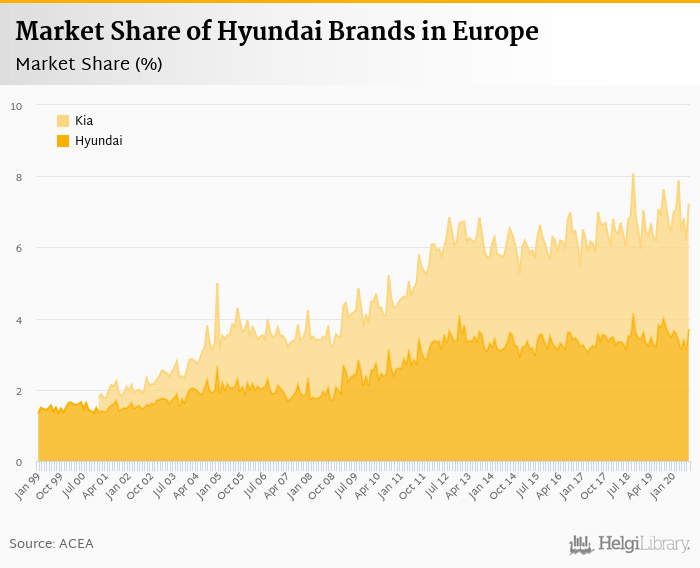
Hyundai Group sold 92.6 thousand new passenger cars representing a 7.23% share of all new passenger cars sold in Europe in July 2020. This is 2.69% fewer vehicles and a 0.071 pp increase in market share when compared to last year. Compared to three years ago, Hyundai Group's market share is now 0.124 pp higher.
The group sold 47.5 thousand of Hyundai brand cars, followed by 45.1 thousand of Kias in July 2020:
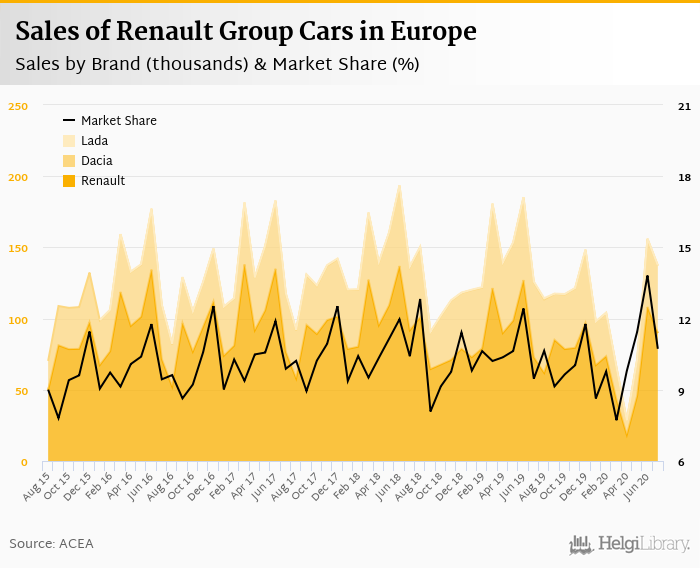
Renault Group sold 137 thousand new passenger cars representing a 10.7% share of all new passenger cars sold in Europe in July 2020. This is 9.15% more vehicles and a 1.26 pp increase in market share when compared to last year. By comparison, three years ago, Renault Group's market share was 9.89%.
The group sold 89.8 thousand of Renault brand cars in July, followed by 47.3 thousand of Dacias and 0.208 of Ladas:

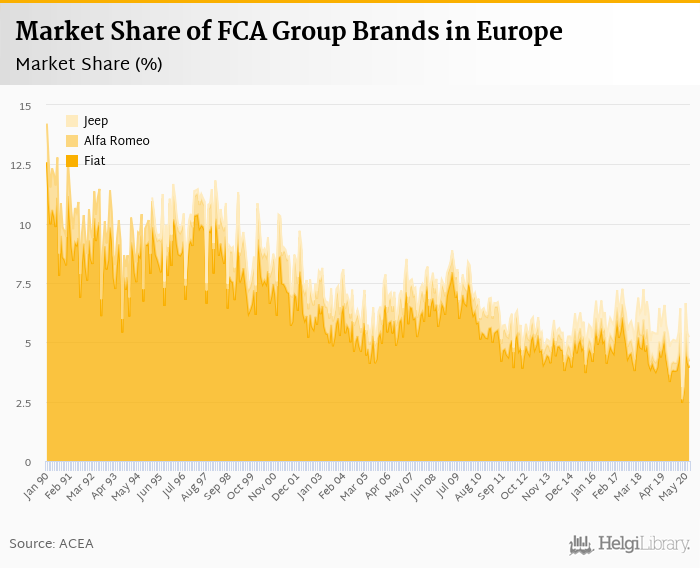
FCA Group sold 70.9 thousand new passenger cars representing a 5.53% share of all new passenger cars sold in Europe in July 2020. This is 7.89% fewer vehicles and a 0.255 pp decrease in market share when compared to last year. By comparison, three years ago FCA Group's market share stood at 6.67%.
The group sold 50.3 thousand of Fiat brand cars in July, followed by 13.2 thousand of Jeeps and 3.42 thousand of Alfa-Romeos:

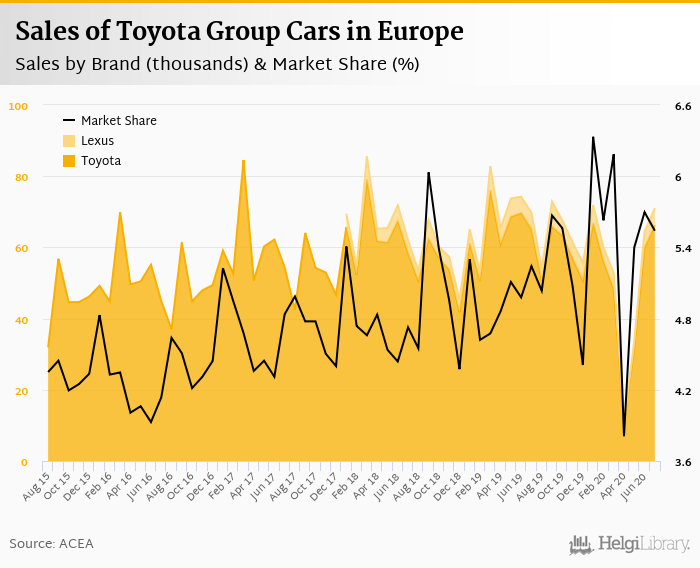
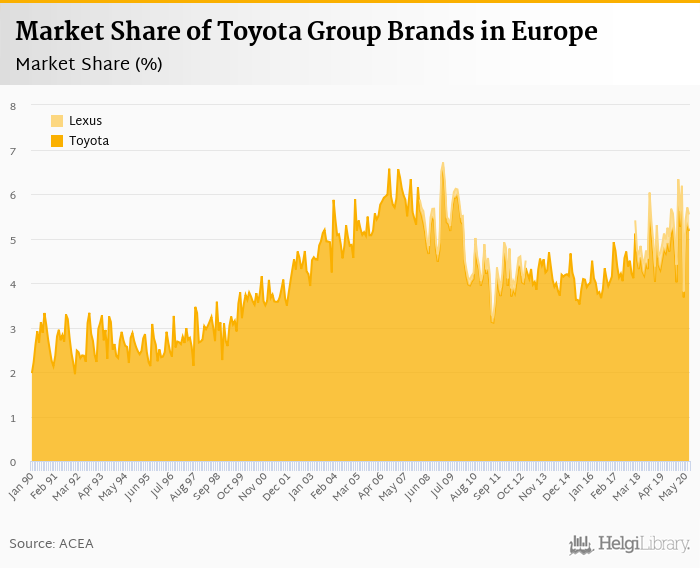
Toyota Group sold 71.0 thousand new passenger cars representing a 5.54% share of all new passenger cars sold in Europe in July 2020. This is 1.85% more vehicles and a 0.299 pp increase in market share when compared to last year. Toyota Group's market share three years ago, by comparison, stood at 4.84%.
The group sold 66.3 thousand of Toyota brand cars in July, with Lexus following at 4.75 thousand cars:
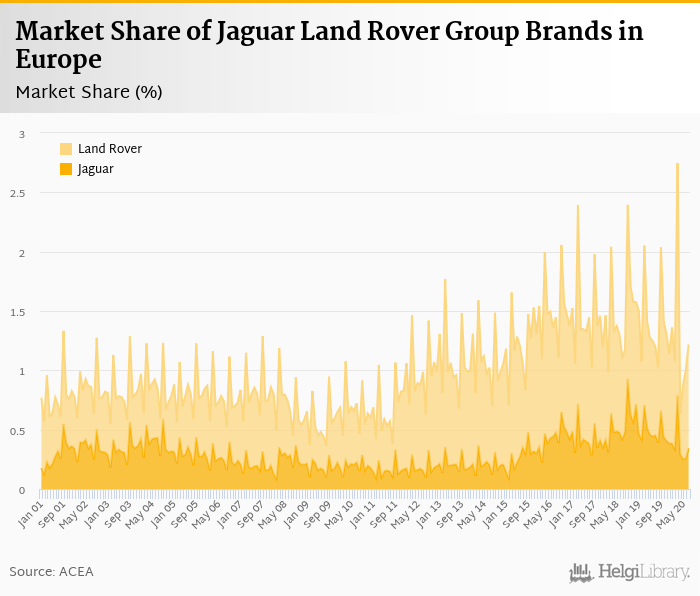
Jaguar Land Rover Group sold 15.6 thousand new passenger cars representing a 1.22% share of all new passenger cars sold in Europe in July 2020. This is 2.21% fewer vehicles and a 0.018 pp increase in market share when compared to last year. Three years ago however, the market share of Jaguar Land Rover Group was 1.45%.
The group sold 11.2 of Land Rovers in July, followed by 4.41 thousand of Jaguars:

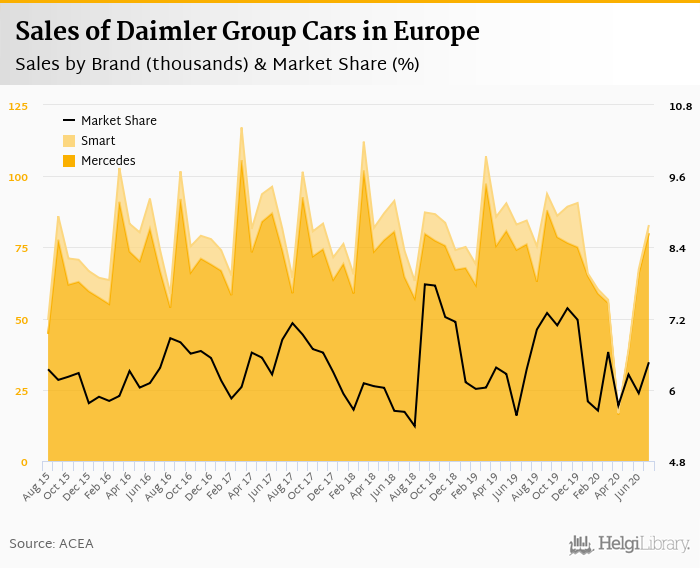
Daimler Group sold 82.9 thousand new passenger cars representing a 6.46% share of all new passenger cars sold in Europe in July 2020. This is 1.86% fewer vehicles and a 0.118 pp increase in market share when compared to last year. By comparison, three years ago, Daimler Group's market share was 6.84%.
The group sold 80.0 thousand of Mercedes in July, followed by 2.87 thousand of Smart cars:

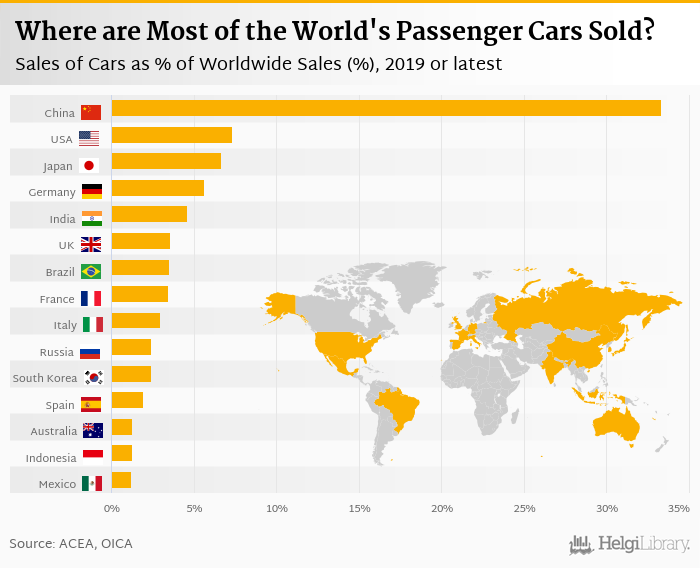
Based on a comparison of 138 countries, China ranked the highest with 21,444 thousand passenger cars sold in 2019 followed by the USA and Japan. Total sales of passenger cars reached 64,342 thousand in 2019 in the world, according to ACEA. This is 6.33% less than in the previous year and 29.6% more than 10 years ago. Historically, total sales of passenger cars reached an all time high of 70,695 thousand in 2017 and an all time low of 11,000 thousand in 1961. The average annual growth stands at 2.75% since 1960.
The top ranked country, China, accounted for 33.3% of all passenger cars sold in the world. The top 3 countries held a 47.3% share while the ten largest countries some 73.5% in 2019.
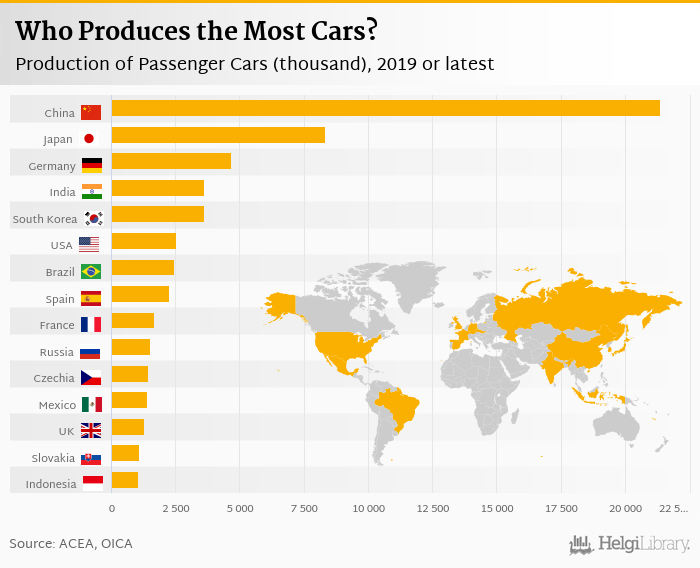
China was the largest car producer in 2019 with 21,360 thousand followed by Japan and Germany. Total production of passenger cars reached 67,149 thousand in 2019 in the world, according to ACEA. China accounted for 31.8% of the world's production, while the top 3 countries held a 51.2% share and the ten largest countries some 77.4% in 2019:
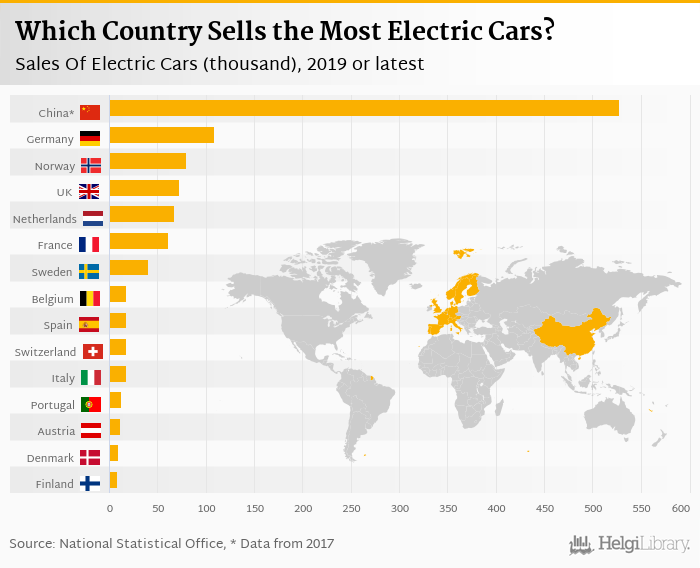
Based on a comparison of 27 countries, China ranked the highest in sales of electric cars with 528 thousand followed by Norway and Germany in 2017. When looking at the ratio of electric to total new cars sold, Norway ranked the highest with 39.3% followed by Switzerland and Netherlands:

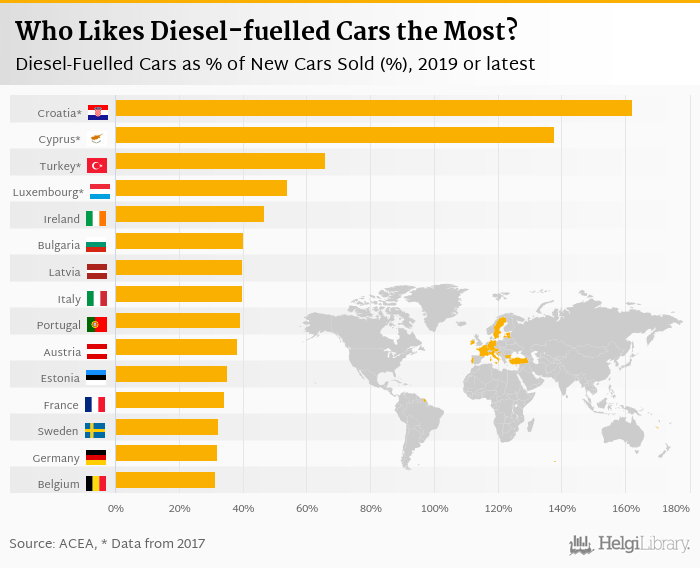
By contrast, Netherlands ranked the highest in the number of petrol-fuelled as a proportion of new cars sold with 79.6%, followed by Estonia and Malta. In terms of diesel-fuelled vehicles, Croatia ranked the highest with 77.2% followed by Lithuania and Ireland:

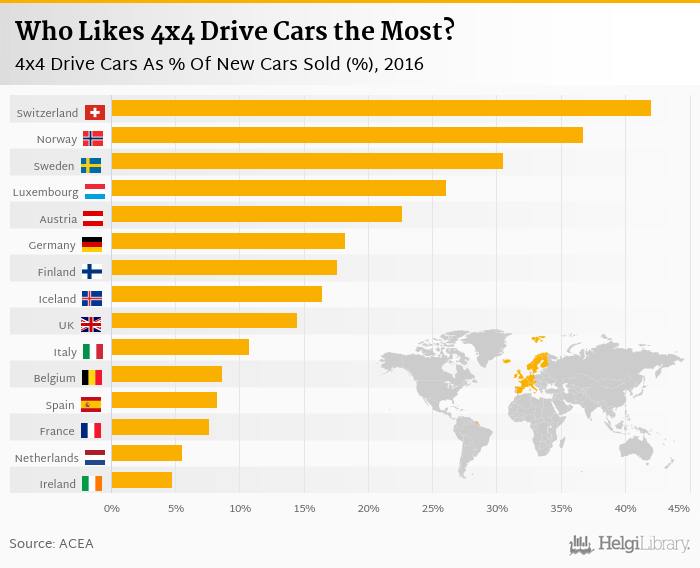
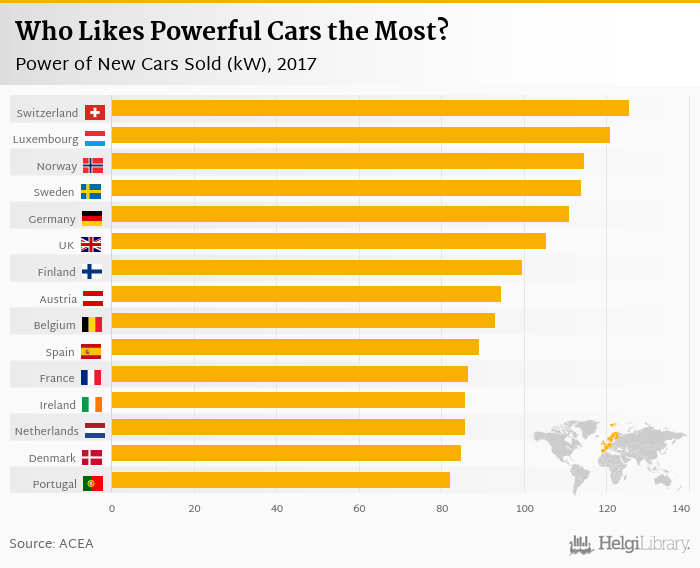
In 2016, Switzerland ranked the highest in 4x4 drive cars as a share of new cars sold with 42.1% followed by Norway and Sweden. Switzerland ranked the highest in the average power of new cars sold with 122 kW followed by Luxembourg and Sweden:
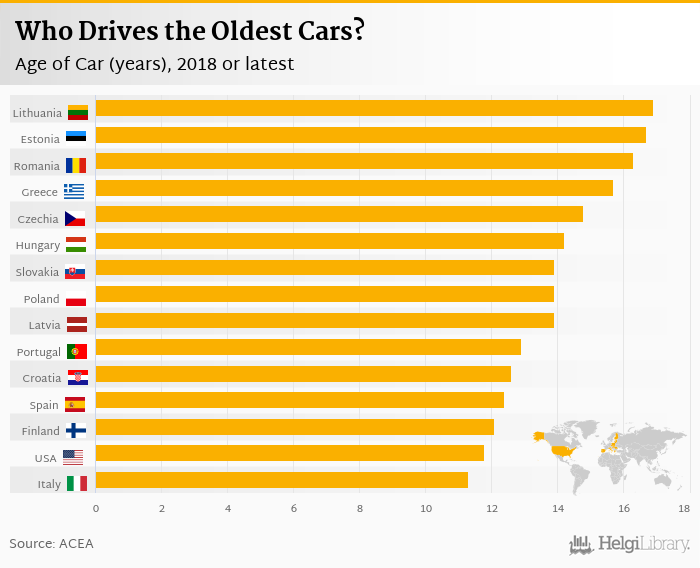
Based on the latest available data, Lithuania, Estonia and Romania were the countries with the oldest average age of passenger cars. The average age was an ancient 16.9 years in Lithuania, 16.7 years years for Estonia and 16.3 years years in Romania. On the other end of the scale was Austria with 8.20 years years, the United Kingdom with 8.20 years years and Luxembourg with 6.40 years years.
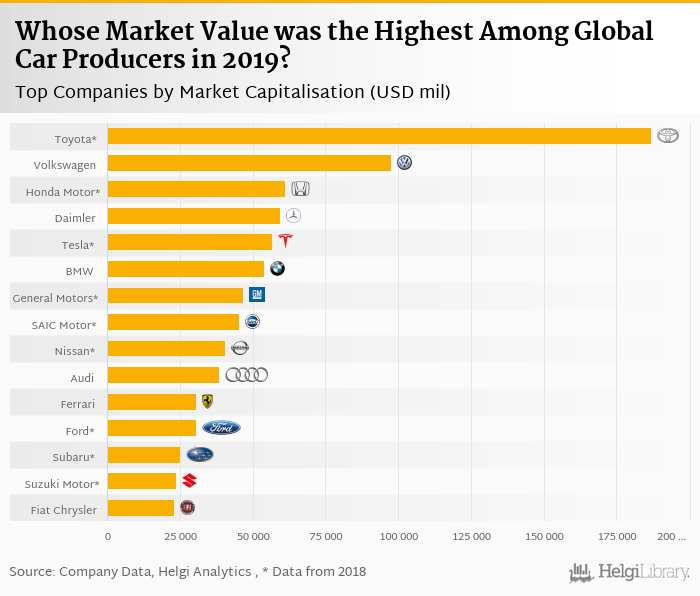
Based on a comparison of 27 firms among Global Car Producers, Toyota Motor Corporation generated the highest sales in 2017 followed by Volkswagen Group and Daimler Group. At the same time, Toyota Motor Corporation had the highest market value followed by Volkswagen Group and Daimler Group:

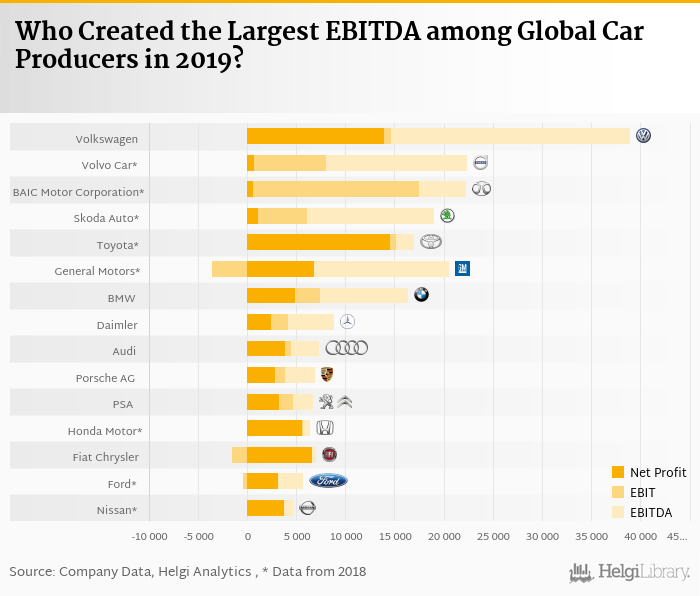
Volkswagen Group generated the highest earnings before interest costs, taxes and depreciation (so called EBITDA) in 2017 followed by Toyota Motor Corporation and General Motors. At the same time, Toyota Motor Corporation generated the highest EBITDA Margin followed by Volkswagen Group and Daimler Group.

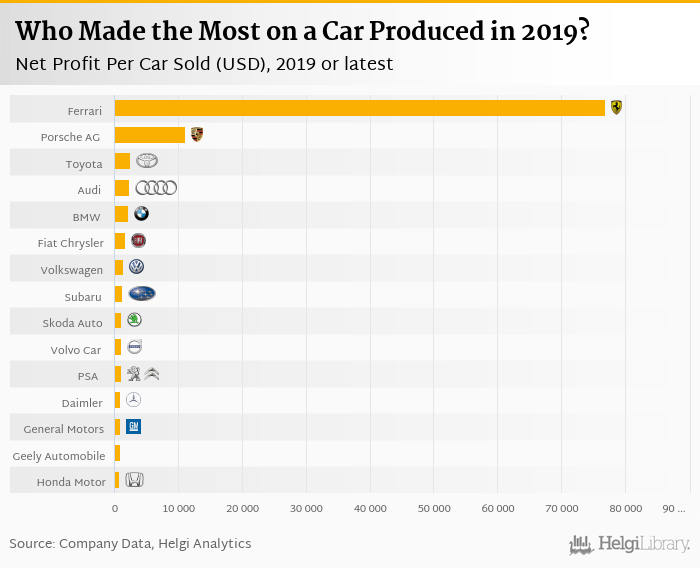
Ferrari produced the highest net profit per car sold in 2017 followed by Porsche AG and Daimler Group. Ferrari made a net profit of EUR 1,683,561 for each car sold, up 25.1% compared to the previous year.

 Helgi Library