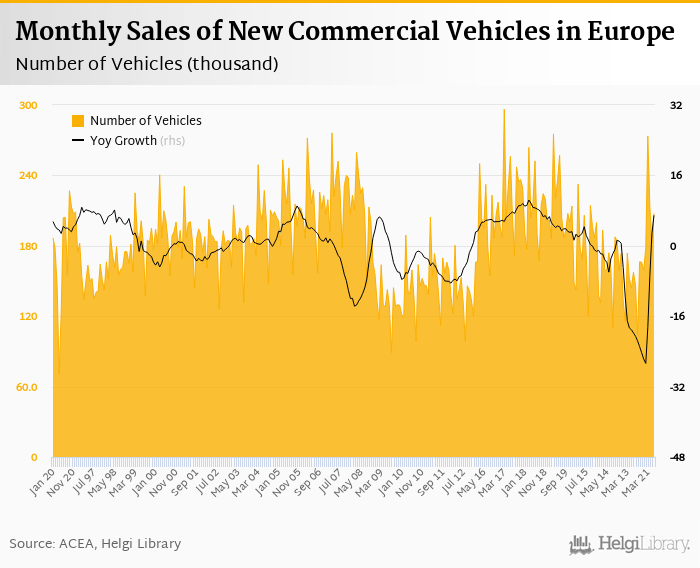
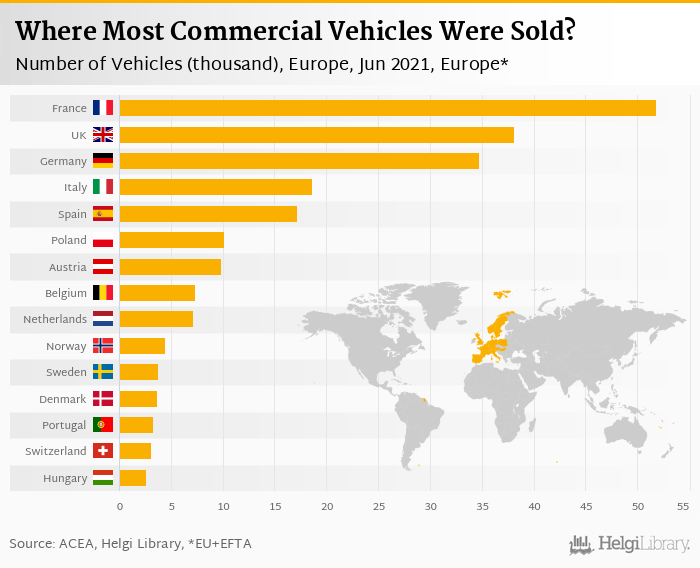
Sales of new commercial vehicles reached 208 thousand in June 2021 in the enlarged Europe (EU plus Iceland, Norway and Switzerland), according to ACEA. This is 1.78%, or 3.62 thousand more than in the previous year.
Historically, between January 1997 and June 2021, sales of commercial vehicles in Europe reached a high of 296 thousand in March 2017 and a low of 71.0 thousand in April 2020.
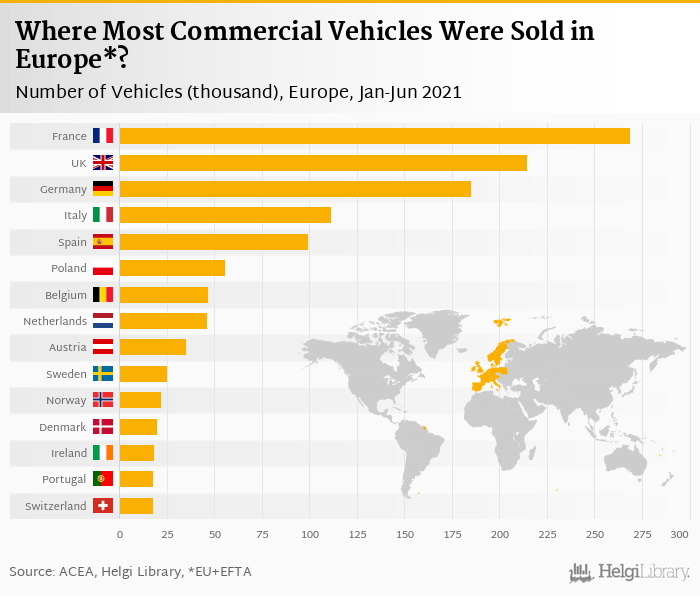
So far this year, some 1,233 thousand vehicles were sold in Europe, up 35.7% yoy.
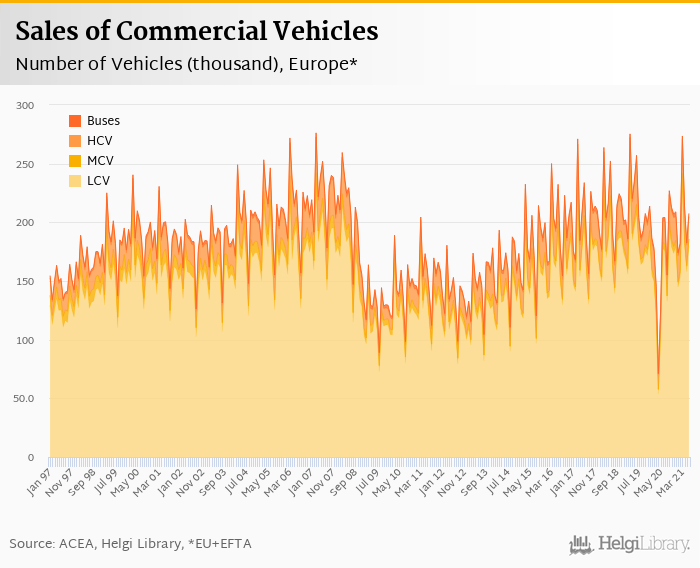
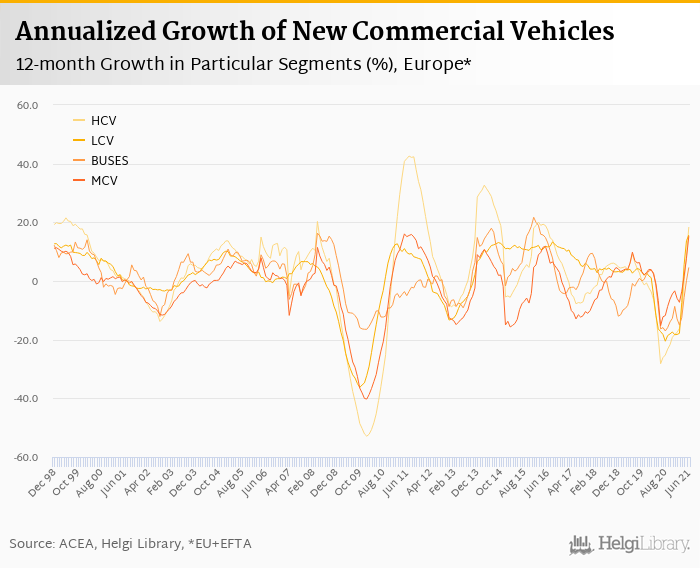
Sales of new light commercial vehicles (up to 3.5 tonnes) reached 180 thousand in June, up 1.35% yoy. Historically, between January 1997 and June 2021, sales reached a high of 240 thousand in March 2019 and a low of 53.6 thousand in April 2020. The average annual growth in that period amounted to 1.53%.
Total of 24.6 thousand new medium commercial vehicles (weighting from 3.5-16 tonnes) were registered in June, up 6.30% yoy. That is compared to average annual growth of 0.530% seen in 2011 - 2021.
Sales of heavy vehicles (exceeding 16 tonnes) amounted to 19.0 thousand, up 4.90% yoy. That's compared to maximum of 47.4 thousand recorded in April 2006 and minimum of 8.12 thousand seen in August 2009. Sales of heavy vehicles have been growing by 1.04% a year on average since 1997.
Some 2.79 thousand new buses have been delivered in June in Europe, down 7.78% when compared to last year. Historically, between 1997 and 2021, sales reached a high of 4.74 thousand in June 2019 and a low of 1.23 thousand in April 2020. The average annual growth in that period amounted to 0.963%.
Most vehicles (51.9 thousand) were sold in France (down 9.43% yoy), followed by the UK (38.2 thousand, up 18.0%), Germany with 34.7 thousand cars (up 28.5%), 18.7 thousand new vehicles were registered in Italy (up 4.92%) and 17.2 thousand thousand in Spain (down 3.09%). The five largest countries accounted for 94.1% of total new vehicles registered in June 2021.
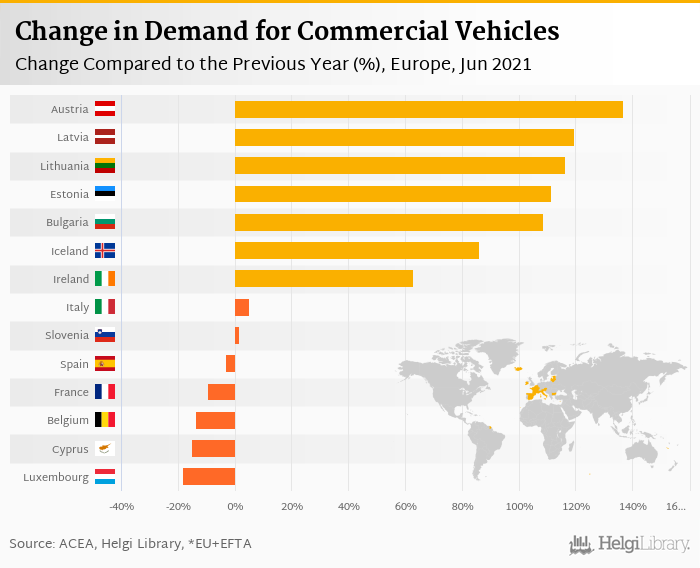
In relative terms, sales in Austria (+137%) and Latvia (+120%) showed the best performance compared to a year ago, whereas registration in Cyprus and Luxembourg performed the worst (-15.0% and -18.3% yoy), in June 2021, according to ACEA.
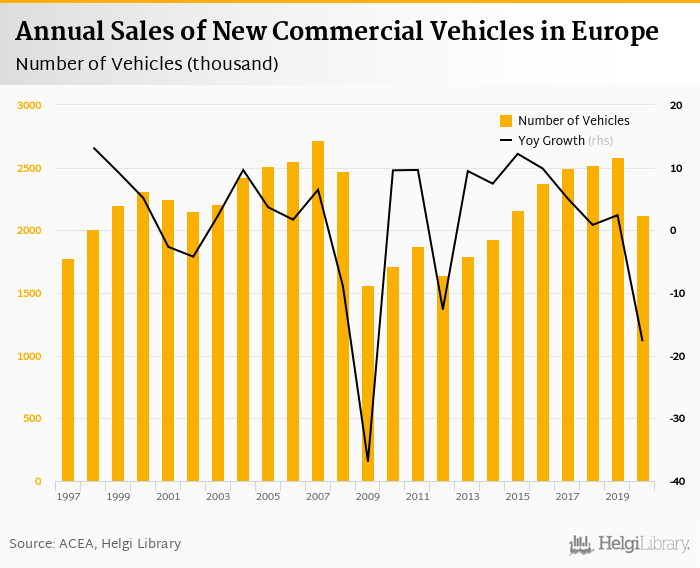
Between 1997 and 2021, sales of commercial vehicles in Europe have increased from 155 thousand to 208 thousand, or 1.30%. a year on average.
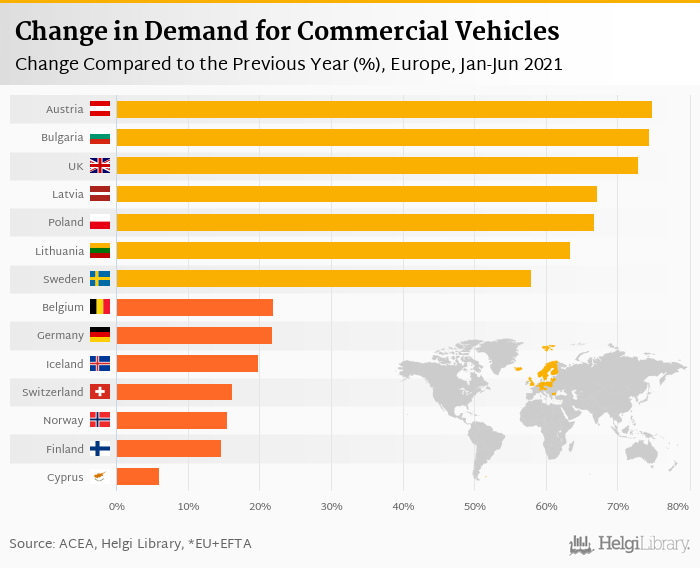
In the first six months of the year, some 1,233 thousand commercial vehicles were sold in Europe, up 35.7% yoy. While most vehicles were sold in France (269 thousand) followed by the UK (215 thousand) and Germany (185 thousand), sales in Austria (up 74.8%) and Bulgaria (up 74.5%) performed the best compared to a year ago, according to ACEA. On the other hand, registrations in Cyprus (up 5.94%), Finland (up 14.7%) and Norway (up 15.4%) were relatively the weakest, since the beginning of the year:
The table below shows details of the sales of new commercial vehicles for each of the European country in the last month and since the beginning of the year.
| Country | June 2021 | June 2020 | YOY Change % | 1-6/2021 | 1-6/2020 | YOY Change % |
|---|---|---|---|---|---|---|
| Austria | 9.87 | 4.17 | 137 | 35.0 | 20.0 | 74.8 |
| Belgium | 7.37 | 8.54 | -13.7 | 46.8 | 38.4 | 22.0 |
| Bulgaria | 1.13 | 0.540 | 109 | 5.11 | 2.93 | 74.5 |
| Croatia | 0.838 | 0.612 | 36.9 | 5.03 | 3.66 | 37.3 |
| Cyprus | 0.210 | 0.247 | -15.0 | 1.02 | 0.960 | 5.94 |
| Czech Republic | 2.63 | 2.13 | 23.0 | 14.4 | 11.3 | 27.5 |
| Denmark | 3.64 | 2.61 | 39.8 | 19.8 | 16.1 | 22.6 |
| Estonia | 0.516 | 0.244 | 111 | 3.02 | 2.02 | 49.6 |
| Finland | 1.72 | 1.12 | 53.2 | 9.35 | 8.15 | 14.7 |
| France | 51.9 | 57.3 | -9.43 | 269 | 197 | 36.4 |
| Germany | 34.7 | 27.0 | 28.5 | 185 | 152 | 21.7 |
| Greece | 0.984 | 0.805 | 22.2 | 5.64 | 3.64 | 54.6 |
| Hungary | 2.64 | 2.05 | 28.8 | 14.8 | 11.8 | 25.0 |
| Iceland | 0.175 | 0.094 | 86.2 | 0.775 | 0.647 | 19.8 |
| Ireland | 1.09 | 0.669 | 62.9 | 18.5 | 12.0 | 54.9 |
| Italy | 18.7 | 17.8 | 4.92 | 112 | 72.4 | 54.1 |
| Latvia | 0.415 | 0.189 | 120 | 2.12 | 1.27 | 67.2 |
| Lithuania | 1.16 | 0.538 | 116 | 6.39 | 3.91 | 63.3 |
| Luxembourg | 0.477 | 0.584 | -18.3 | 3.30 | 2.60 | 26.8 |
| Netherlands | 7.17 | 4.82 | 48.9 | 46.4 | 37.0 | 25.5 |
| Norway | 4.43 | 3.58 | 23.8 | 22.0 | 19.1 | 15.4 |
| Poland | 10.1 | 6.81 | 48.6 | 55.8 | 33.5 | 66.7 |
| Portugal | 3.30 | 2.60 | 26.7 | 17.9 | 13.2 | 35.9 |
| Romania | 2.14 | 1.72 | 24.7 | 11.2 | 8.56 | 31.4 |
| Slovakia | 1.09 | 0.725 | 50.2 | 5.69 | 3.95 | 43.9 |
| Slovenia | 0.913 | 0.898 | 1.67 | 6.33 | 4.77 | 32.8 |
| Spain | 17.2 | 17.7 | -3.09 | 99.7 | 72.0 | 38.4 |
| Sweden | 3.75 | 2.89 | 29.7 | 25.1 | 15.9 | 57.9 |
| Switzerland | 3.05 | 2.67 | 13.9 | 17.9 | 15.4 | 16.3 |
| United Kingdom | 38.2 | 32.3 | 18.0 | 215 | 124 | 72.9 |
| EU + EFTA | 208 | 204 | 1.78 | 1,233 | 909 | 35.7 |
| Country | June 2021 | June 2020 | YOY Change % | 1-6/2021 | 1-6/2020 | YOY Change % |
|---|---|---|---|---|---|---|
| Austria | 9.05 | 3.64 | 149 | 30.8 | 16.8 | 83.0 |
| Belgium | 6.58 | 7.77 | -15.3 | 41.9 | 34.1 | 22.8 |
| Bulgaria | 0.741 | 0.361 | 105 | 3.42 | 2.23 | 53.5 |
| Croatia | 0.683 | 0.548 | 24.6 | 4.27 | 3.20 | 33.3 |
| Cyprus | 0.203 | 0.143 | 42.0 | 0.959 | 0.791 | 21.2 |
| Czech Republic | 1.77 | 1.49 | 19.2 | 9.33 | 7.40 | 26.0 |
| Denmark | 3.12 | 2.33 | 33.6 | 17.2 | 14.0 | 22.6 |
| Estonia | 0.413 | 0.214 | 93.0 | 2.40 | 1.66 | 44.6 |
| Finland | 1.30 | 0.871 | 49.1 | 7.30 | 6.27 | 16.5 |
| France | 46.6 | 51.8 | -10.0 | 242 | 175 | 38.7 |
| Germany | 27.0 | 21.0 | 28.2 | 141 | 114 | 23.0 |
| Greece | 0.865 | 0.740 | 16.9 | 5.16 | 3.16 | 62.9 |
| Hungary | 2.07 | 1.81 | 14.8 | 12.2 | 10.1 | 20.6 |
| Iceland | 0.141 | 0.081 | 74.1 | 0.641 | 0.535 | 19.8 |
| Ireland | 0.988 | 0.568 | 73.9 | 17.0 | 10.7 | 59.1 |
| Italy | 16.2 | 16.0 | 1.25 | 96.1 | 61.5 | 56.3 |
| Latvia | 0.188 | 0.152 | 23.7 | 1.22 | 0.968 | 26.4 |
| Lithuania | 0.310 | 0.281 | 10.3 | 1.97 | 1.56 | 25.8 |
| Luxembourg | 0.396 | 0.459 | -13.7 | 2.65 | 2.01 | 32.0 |
| Netherlands | 6.04 | 4.12 | 46.9 | 39.5 | 30.8 | 28.2 |
| Norway | 3.49 | 2.56 | 36.4 | 18.3 | 15.1 | 21.6 |
| Poland | 7.43 | 5.13 | 44.9 | 39.0 | 24.6 | 58.5 |
| Portugal | 2.80 | 2.35 | 19.1 | 15.3 | 11.6 | 31.7 |
| Romania | 1.55 | 1.27 | 22.0 | 7.80 | 6.38 | 22.2 |
| Slovakia | 0.783 | 0.516 | 51.7 | 3.99 | 2.89 | 37.8 |
| Slovenia | 0.721 | 0.666 | 8.26 | 5.26 | 3.74 | 40.7 |
| Spain | 15.5 | 16.3 | -4.95 | 88.1 | 63.0 | 39.8 |
| Sweden | 3.14 | 2.24 | 40.1 | 21.5 | 12.5 | 72.1 |
| Switzerland | 2.66 | 2.33 | 14.1 | 15.7 | 13.0 | 21.2 |
| United Kingdom | 34.4 | 30.0 | 14.4 | 192 | 109 | 75.9 |
| EU + EFTA | 180 | 178 | 1.35 | 1,051 | 759 | 38.6 |
| Country | June 2021 | June 2020 | YOY Change % | 1-6/2021 | 1-6/2020 | YOY Change % |
|---|---|---|---|---|---|---|
| Austria | 0.738 | 0.443 | 66.6 | 3.70 | 2.78 | 32.9 |
| Belgium | 0.584 | 0.536 | 8.96 | 3.61 | 3.14 | 15.0 |
| Bulgaria | 0.344 | 0.161 | 114 | 1.56 | 0.605 | 158 |
| Croatia | 0.087 | 0.054 | 61.1 | 0.564 | 0.335 | 68.4 |
| Cyprus | 0.001 | 0.004 | -75.0 | 0.026 | 0.026 | < 0.001 |
| Czech Republic | 0.666 | 0.404 | 64.9 | 3.76 | 2.49 | 50.9 |
| Denmark | 0.382 | 0.219 | 74.4 | 2.10 | 1.77 | 18.6 |
| Estonia | 0.062 | 0.028 | 121 | 0.428 | 0.253 | 69.2 |
| Finland | 0.240 | 0.148 | 62.2 | 1.30 | 1.22 | 6.54 |
| France | 4.03 | 4.12 | -2.09 | 20.7 | 17.3 | 19.2 |
| Germany | 4.96 | 3.79 | 30.8 | 29.5 | 23.9 | 23.3 |
| Greece | 0.044 | 0.031 | 41.9 | 0.175 | 0.216 | -19.0 |
| Hungary | 0.406 | 0.202 | 101 | 2.14 | 1.23 | 73.7 |
| Iceland | 0.015 | 0.010 | 50.0 | 0.062 | 0.057 | 8.77 |
| Ireland | 0.057 | 0.052 | 9.62 | 1.10 | 0.927 | 19.1 |
| Italy | 1.80 | 1.23 | 46.6 | 11.4 | 7.53 | 51.8 |
| Latvia | 0.122 | 0.028 | 336 | 0.658 | 0.239 | 175 |
| Lithuania | 0.837 | 0.253 | 231 | 4.25 | 2.15 | 97.8 |
| Luxembourg | 0.048 | 0.092 | -47.8 | 0.503 | 0.349 | 44.1 |
| Netherlands | 0.951 | 0.587 | 62.0 | 6.01 | 5.17 | 16.2 |
| Norway | 0.402 | 0.356 | 12.9 | 2.29 | 2.29 | -0.131 |
| Poland | 2.32 | 1.38 | 67.8 | 14.9 | 7.21 | 106 |
| Portugal | 0.412 | 0.183 | 125 | 1.98 | 1.07 | 85.1 |
| Romania | 0.511 | 0.363 | 40.8 | 2.95 | 1.77 | 66.8 |
| Slovakia | 0.249 | 0.140 | 77.9 | 1.44 | 0.811 | 77.9 |
| Slovenia | 0.177 | 0.207 | -14.5 | 0.948 | 0.925 | 2.49 |
| Spain | 1.29 | 1.01 | 26.8 | 9.32 | 6.52 | 42.9 |
| Sweden | 0.504 | 0.368 | 37.0 | 2.89 | 2.55 | 13.7 |
| Switzerland | 0.289 | 0.242 | 19.4 | 1.61 | 1.56 | 3.34 |
| United Kingdom | 2.28 | 1.49 | 53.1 | 15.6 | 10.1 | 55.0 |
| EU + EFTA | 19.0 | 18.1 | 4.90 | 135 | 107 | 27.2 |
| Country | June 2021 | June 2020 | YOY Change % | 1-6/2021 | 1-6/2020 | YOY Change % |
|---|---|---|---|---|---|---|
| Austria | 0.082 | 0.069 | 18.8 | 0.455 | 0.350 | 30.0 |
| Belgium | 0.078 | 0.107 | -27.1 | 0.531 | 0.414 | 28.3 |
| Bulgaria | 0.031 | 0.011 | 182 | 0.064 | 0.056 | 14.3 |
| Croatia | 0.032 | 0.081 | 0.026 | 212 | ||
| Cyprus | 0.004 | 0.096 | -95.8 | 0.013 | 0.106 | -87.7 |
| Czech Republic | 0.065 | 0.122 | -46.7 | 0.603 | 0.686 | -12.1 |
| Denmark | 0.105 | 0.014 | 650 | 0.287 | 0.144 | 99.3 |
| Estonia | 0.040 | 0.169 | 0.076 | 122 | ||
| Finland | 0.079 | 0.013 | 508 | 0.151 | 0.114 | 32.5 |
| France | 0.517 | 0.602 | -14.1 | 2.43 | 2.32 | 4.69 |
| Germany | 0.564 | 0.455 | 24.0 | 2.63 | 2.63 | -0.038 |
| Greece | 0.061 | 0.019 | 221 | 0.201 | 0.144 | 39.6 |
| Hungary | 0.119 | 0.025 | 376 | 0.251 | 0.307 | -18.2 |
| Iceland | 0.004 | 0.011 | 0.007 | 57.1 | ||
| Ireland | 0.016 | 0.035 | -54.3 | 0.218 | 0.163 | 33.7 |
| Italy | 0.207 | 0.170 | 21.8 | 1.68 | 1.60 | 5.07 |
| Latvia | 0.099 | 0.006 | 1,550 | 0.180 | 0.034 | 429 |
| Lithuania | 0.012 | 0.001 | 1,100 | 0.114 | 0.127 | -10.2 |
| Luxembourg | 0.017 | 0.013 | 30.8 | 0.095 | 0.129 | -26.4 |
| Netherlands | 0.039 | 0.019 | 105 | 0.177 | 0.281 | -37.0 |
| Norway | 0.245 | 0.383 | -36.0 | 0.427 | 0.729 | -41.4 |
| Poland | 0.152 | 0.139 | 9.35 | 0.668 | 0.692 | -3.47 |
| Portugal | 0.032 | 0.028 | 14.3 | 0.295 | 0.252 | 17.1 |
| Romania | 0.045 | 0.062 | -27.4 | 0.376 | 0.294 | 27.9 |
| Slovakia | 0.038 | 0.033 | 15.2 | 0.087 | 0.123 | -29.3 |
| Slovenia | 0.004 | 0.007 | -42.9 | 0.046 | 0.032 | 43.8 |
| Spain | 0.163 | 0.138 | 18.1 | 0.752 | 0.869 | -13.5 |
| Sweden | 0.042 | 0.236 | -82.2 | 0.394 | 0.650 | -39.4 |
| Switzerland | 0.041 | 0.042 | -2.38 | 0.223 | 0.200 | 11.5 |
| United Kingdom | 0.493 | 0.175 | 182 | 1.84 | 1.28 | 43.8 |
| EU + EFTA | 2.79 | 3.02 | -7.78 | 14.4 | 14.8 | -3.00 |
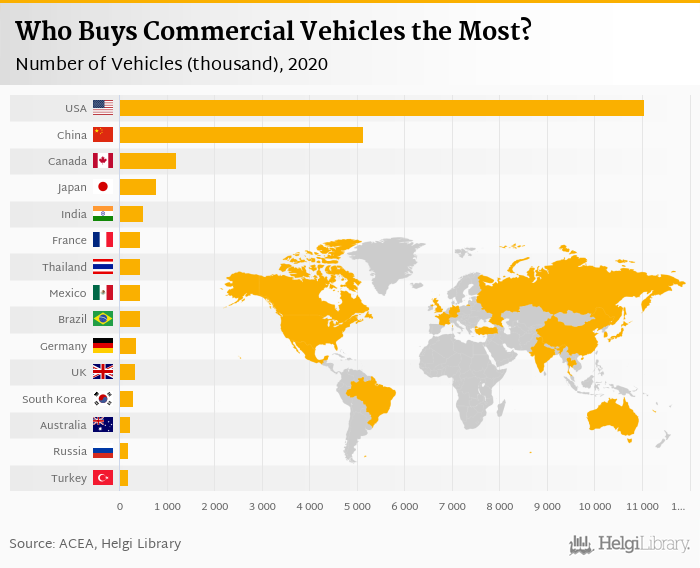
Based on a comparison of 138 countries, USA ranked the highest with 11,051 thousand commercial vehicles sold in 2020 followed by the China and Canada. Total sales of commercial vehicles reached 24,372 thousand in 2020 in the world, according to OICA. This is 8.69% less than in the previous year and 27.3% more than 10 years ago. Historically, total sales of commercial vehicles reached a high of 26,971 thousand in 2018 and a low of 15,912 thousand in 2009, in between 2005-2020. The average annual growth stands at 1.16% since 2005.
The top ranked country, USA, accounted for 45.3% of all commercial vehicles sold in the world. The top 3 countries held a 71.4% share while the ten largest countries some 71.4% in 2020.
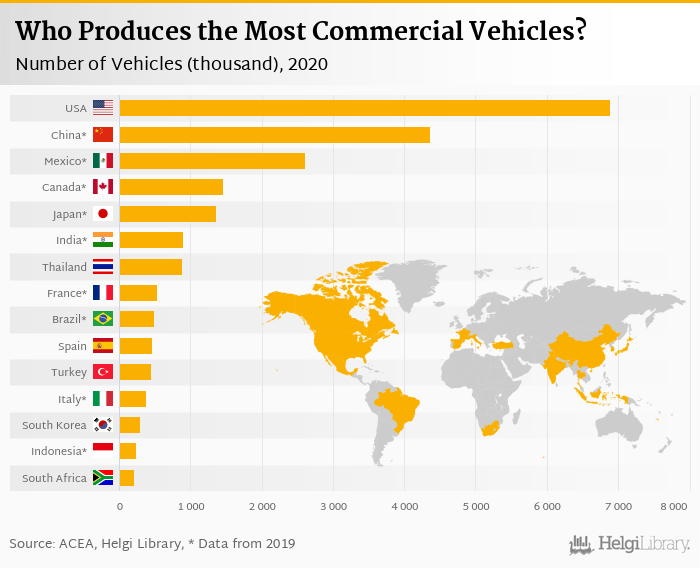
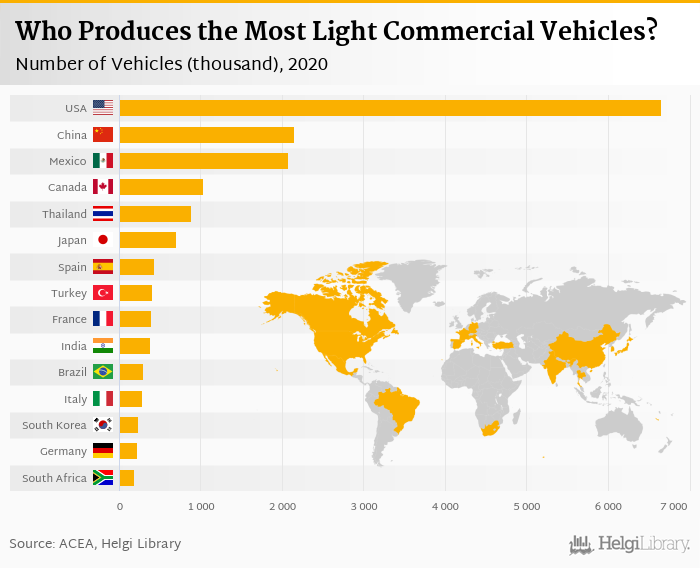
USA was the largest commercial vehicle producer in 2020 with 6,896 thousand followed by Thailand and Spain. Total production of commercial vehicles reached 21,787 thousand in 2020 in the world, according to OICA. USA accounted for 31.6% of the world's production, while the top 3 countries held a 37.9% share and the ten largest countries some some 44.4% in 2020:
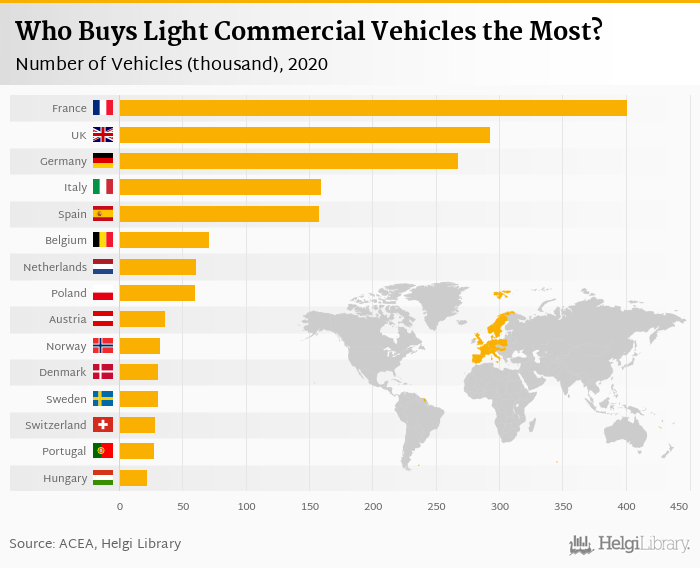
France ranked the highest in sales of light commercial vehicles with 401 thousand followed by UK and Germany in 2020.
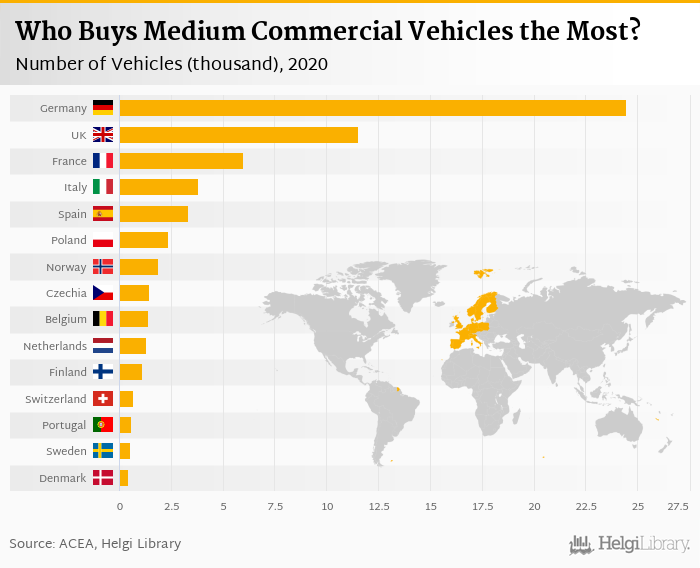
In terms of medium commercial vehicles, Germany ranked the highest with 24.5 thousand vehicles sold followed by the UK and France in 2020.
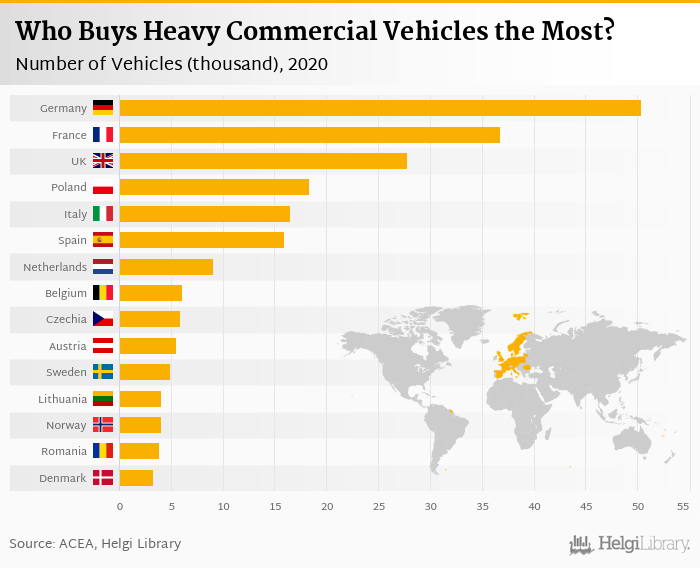
Most heavy commercial vehicles (50.3 thousand) were sold in Germany, followed by France (36.7 thousand) and the Germany (27.8 thousand). On the other hand, China, the Japan and USA produced 82.9% of total heavy commercial vehicles in 2020:
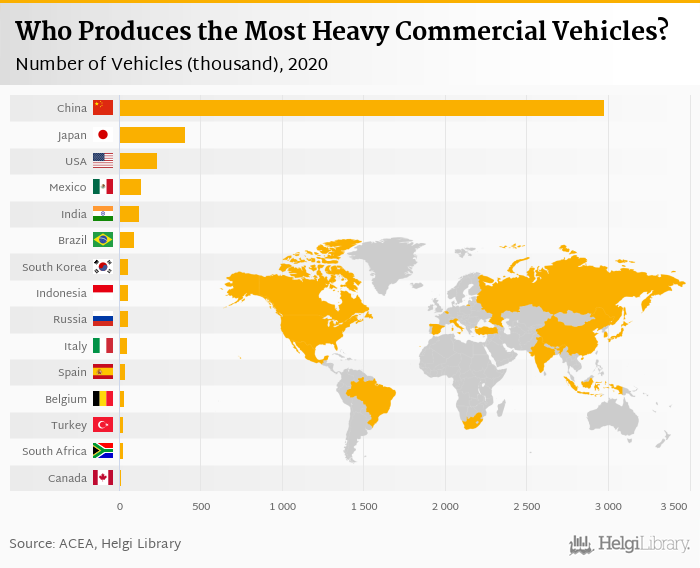
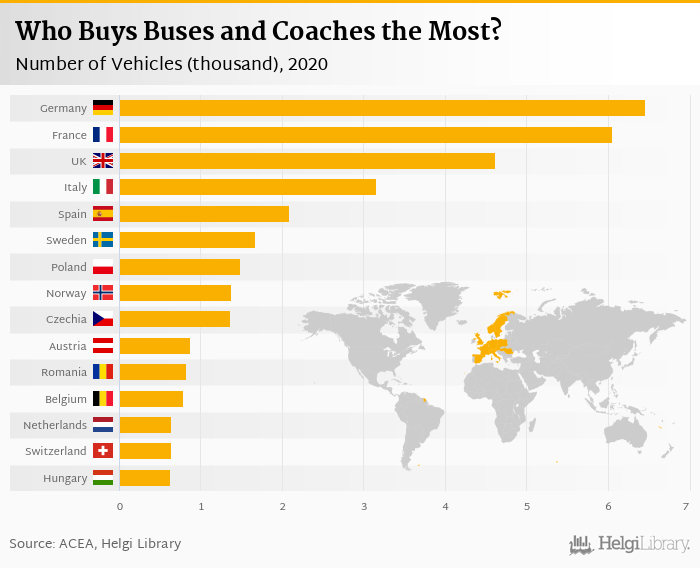
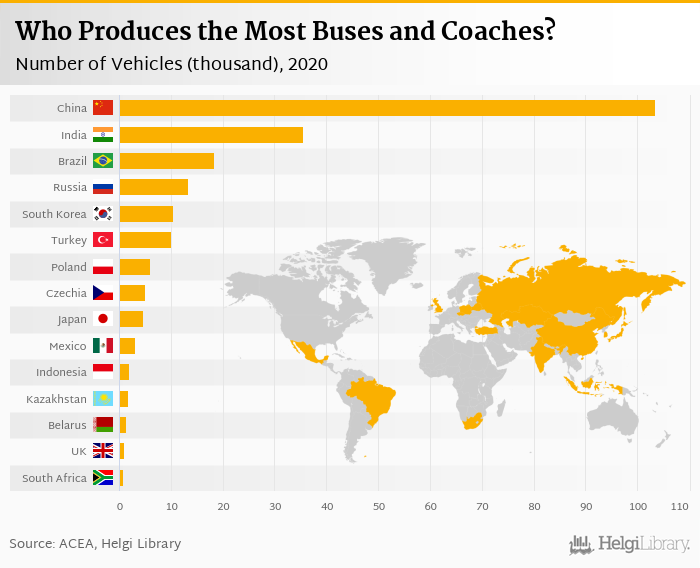
In terms of new buses and coaches, Germany was the largest investor with 6.46 thousand vehicles bought in 2020, followed by France (6.05 thousand) and the UK (4.62 thousand). On the other hand, China was the largest producer with 103 thousand vehicles:
Based on a comparison of 27 firms among Commercial Vehicle Producers, Volvo Group generated the highest sales in 2019 followed by Tata Motors and Paccar. At the same time, Volvo Group had the highest market value followed by Paccar and Isuzu Motors:


Volvo Group generated the highest earnings before interest costs, taxes and depreciation (so called EBITDA) in 2019 followed by Paccar and Scania Group. At the same time, Scania Group generated the highest EBITDA Margin followed by Volvo Group and Ashok Leyland.


 Helgi Library