Sales of electrically-chargeable vehicles amounted to 545 thousand in 2Q2022, -18.8 thousand less than the last year.
Electric cars represented 21.4% of all new cars sold in 2Q2022, up from 18.4% a year ago.
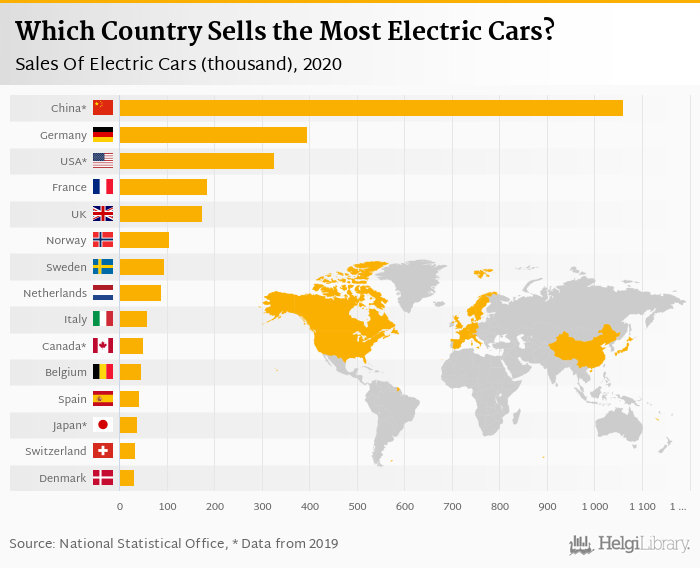
Most electric vehicles have been sold in Germany (155 thousand), while Romania registered the biggest increase in sales when compared to last year.
Sales of new electrically-chargeable passenger cars (battery electric and plug-in hybrid electric vehicles) reached 545 thousand in the second quarter of 2022 in the enlarged Europe (EU plus Iceland, Norway and Switzerland), according to ACEA. This is 3.34 less, or 564 thousand less than in the previous year.
Share of electric chargeable vehicles increased to 21.4% of all new passenger cars sold in 2Q2022, up from 18.4% seen in the second quarter of 2021. Most electric vehicles (155 thousand) were sold in Germany (down 8.73% yoy), followed by France (83.3 thousand, up 0.906%), the United Kingdom with 72.6 thousand thousand cars (down 1.52%), 37.4 thousand new vehicles were registered in Sweden (up 1.82%) and 33.8 thousand in Italy (down 12.5%). The five largest countries accounted for 70.1% of total new vehicles registered in the second quarter of 2022:


As partly seen above, the sale of battery-electric (BEV) increased by 9.92% when compared to last year, while registration of plug-in hybrid vehicles (PHEV) fell by 16.8%.
In relative terms, Norway liked the electric chargeable vehicles the most in the second quarter of 2022 with 86.8% of all new passenger cars sold followed by Sweden (50.3%) and Iceland (45.3%).
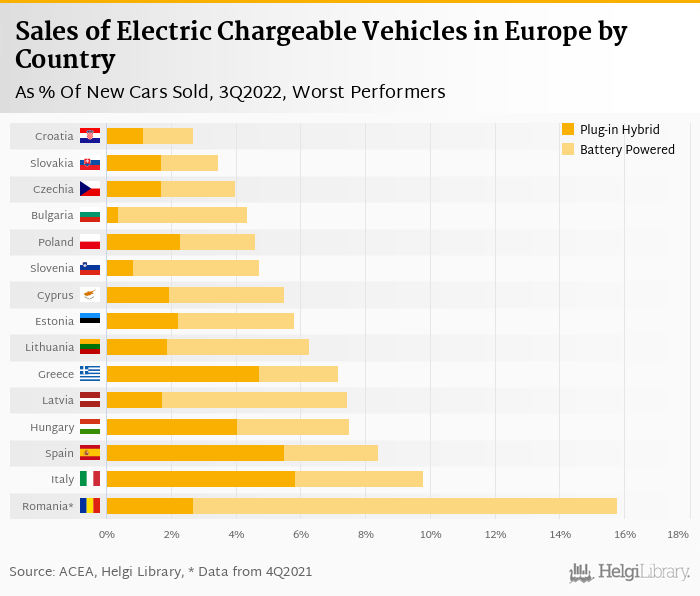
On the other end of the scale was Czechia with only 3.97%, Slovakia with 3.46% and Croatia with just 2.70% of electric cars sold, as % of total:

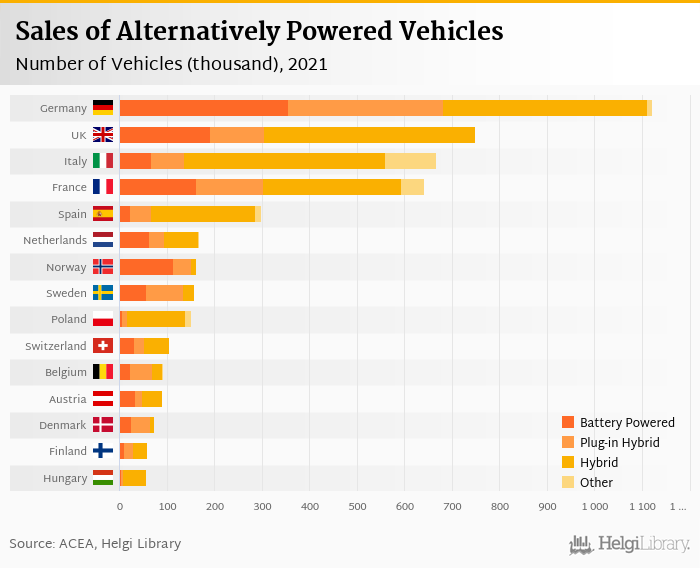
When hybrid electric vehicles (cars that combine a conventional internal combustion engine system with an electric propulsion system) and other alternatively-powered cars (such as natural gas vehicles (NGV), LPG-fueled vehicles and ethanol (E85) vehicles) are included, total sales of alternatively-powered cars (other than using diesel or petrol) amounted to 1,196 thousand vehicles in the second quarter of 2022. This is 4.37% less, or 54.7 thousand less than in the previous year.
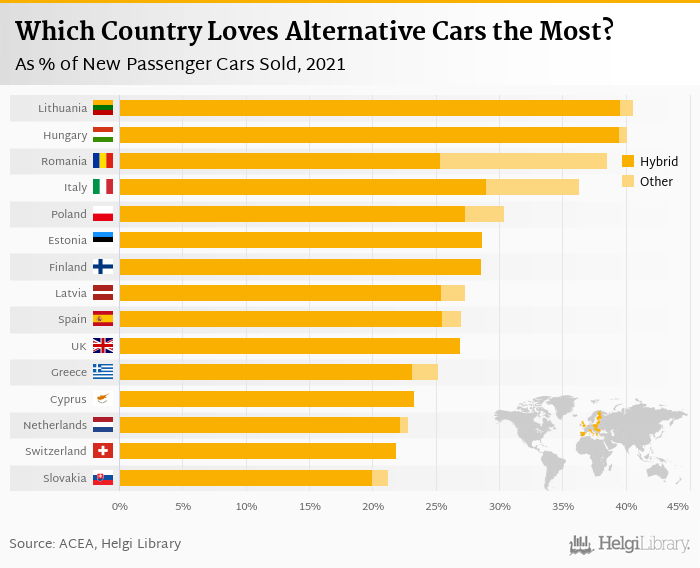
Together with electric chargeable vehicles, the share of total alternatively-powered vehicles increased to 46.9% of all new passenger cars sold in 2Q2022, up from 40.7% seen in the second quarter of 2021:


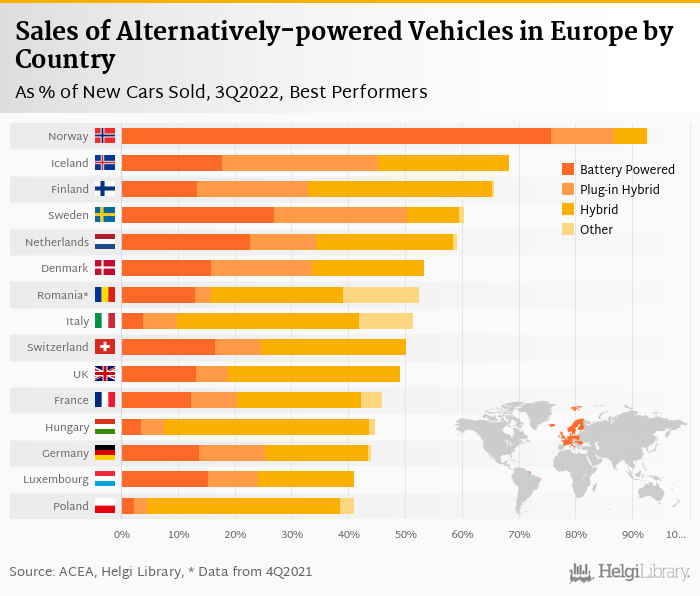
In relative terms, Norway liked the alternatively-powered vehicles the most in the second quarter of 2022 with 92.5% of all new passenger cars sold followed by Iceland (68.2%) and Finland (65.7%). On the other hand, alternatively-fuelled cars represented only 21.6% of all cars sold in Czechia, 19.6% in Slovenia and 6.65% in Bulgaria, according to ACEA.

Sales of traditionally-powered vehicles using petrol and diesel reached 1,352 thousand in the second quarter of 2022 in the enlarged Europe, according to ACEA. This is 25.8%, or 469 thousand fewer than in the previous year.
Some 956 thousand petrol-powered vehicles were sold, down 23.9% when compared to a year ago. The share decreased to 37.5% of all new passenger cars sold in 2Q2022, down from 40.9% seen in the second quarter of 2021. Share of diesel-powered cars fell to 15.5% (from 18.4% in 2Q2021) with 396 thousand cars sold in the second quarter of 2022.
As a result, share of traditionally-powered cars amounted to 53.1% of all new passenger cars sold in 2Q2022, down from 59.3% seen in the second quarter of 2021.


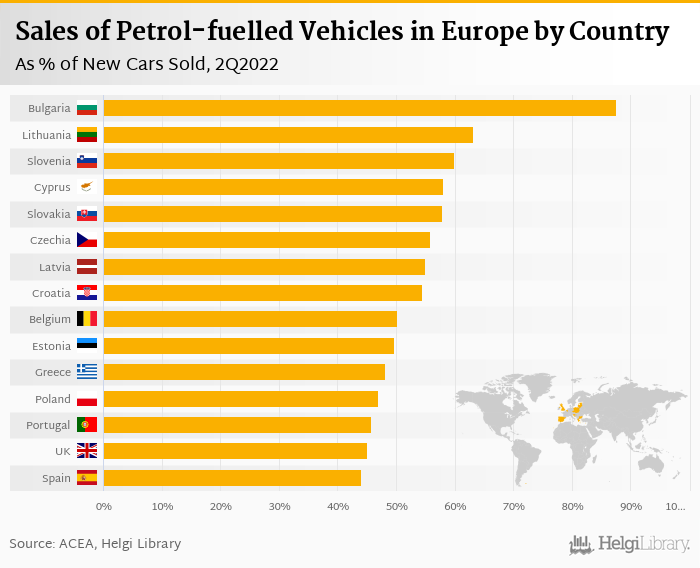
In relative terms, Bulgaria liked the petrol-fuelled vehicles the most in the second quarter of 2022 with 87.5% of all new passenger cars sold followed by Lithuania (63.1%) and Slovenia (59.9%). On the other hand, diesel-powered cars were preferred most in Ireland (30.3% of all cars sold), followed by Luxembourg (with 22.8%) and Czechia (22.6%).

The following charts show where the most cars are sold absolutely and relatively in Europe and elsewhere in the world:


| Country | 3Q2020 | 4Q2020 | 1Q2021 | 2Q2021 | 3Q2021 | 4Q2021 | 1Q2022 | 2Q2022 |
|---|---|---|---|---|---|---|---|---|
| Austria | 5.99 | 10.2 | 10.3 | 12.9 | 12.2 | 12.5 | 10.4 | 10.7 |
| Belgium | 12.4 | 19.9 | 16.8 | 18.4 | 17.4 | 17.9 | 24.9 | 22.4 |
| Bulgaria | ... | ... | 0.086 | 0.142 | 0.151 | 0.150 | 0.184 | 0.342 |
| Croatia | ... | 0.330 | 0.201 | 0.352 | 0.460 | 0.861 | 0.457 | 0.366 |
| Cyprus | 0.011 | 0.020 | 0.055 | 0.049 | 0.048 | 0.028 | 0.101 | 0.169 |
| Czechia | 0.908 | 2.33 | 1.53 | 1.96 | 1.36 | 1.70 | 1.54 | 2.05 |
| Denmark | 10.2 | 14.1 | 10.5 | 15.3 | 17.2 | 22.4 | 11.5 | 13.3 |
| Estonia | 0.118 | 0.172 | 0.139 | 0.238 | 0.167 | 0.148 | 0.254 | 0.344 |
| Finland | 4.93 | 5.20 | 7.24 | 8.87 | 6.29 | 7.89 | 7.47 | 7.18 |
| France | 45.7 | 74.8 | 61.7 | 82.6 | 64.5 | 94.4 | 72.8 | 83.3 |
| Germany | 111 | 190 | 143 | 170 | 166 | 204 | 152 | 155 |
| Greece | 0.515 | 1.25 | 1.30 | 1.91 | 1.60 | 2.16 | 1.78 | 2.31 |
| Hungary | 1.60 | 2.53 | 1.48 | 1.79 | 2.26 | 3.02 | 2.54 | 2.16 |
| Iceland | 1.16 | 1.23 | 1.08 | 1.60 | 2.01 | 2.30 | 2.12 | 2.74 |
| Ireland | 2.90 | 0.553 | 5.55 | 2.95 | 6.78 | 1.27 | 10.2 | 3.20 |
| Italy | 14.2 | 29.9 | 29.8 | 38.6 | 31.9 | 37.2 | 30.9 | 33.8 |
| Latvia | 0.147 | 0.104 | 0.097 | 0.170 | 0.128 | 0.174 | 0.212 | 0.333 |
| Lithuania | 0.167 | 0.125 | 0.122 | 0.343 | 0.386 | 0.572 | 0.490 | 0.471 |
| Luxembourg | 1.49 | 2.17 | 2.27 | 2.21 | 2.10 | 2.52 | 2.68 | 2.53 |
| Netherlands | 19.1 | 49.9 | 12.2 | 19.9 | 21.2 | 41.8 | 22.4 | 25.9 |
| Norway | 27.0 | 38.2 | 29.8 | 39.6 | 39.8 | 42.8 | 29.1 | 31.4 |
| Poland | 2.06 | 3.54 | 2.93 | 4.01 | 3.90 | 5.61 | 4.73 | 5.08 |
| Portugal | 4.73 | 7.55 | 4.98 | 7.57 | 6.86 | 9.51 | 7.62 | 7.60 |
| Romania | 0.807 | 1.44 | 0.415 | 0.459 | 1.04 | 5.34 | 2.11 | 2.35 |
| Slovakia | 0.474 | 0.376 | 0.397 | 0.595 | 0.553 | 0.726 | 0.666 | 0.718 |
| Slovenia | 0.402 | 0.664 | 0.364 | 0.406 | 0.509 | 0.640 | 0.729 | 0.618 |
| Spain | 10.4 | 20.1 | 10.6 | 17.8 | 16.5 | 22.1 | 17.7 | 20.4 |
| Sweden | 24.0 | 37.5 | 32.4 | 36.8 | 27.9 | 38.3 | 37.4 | 37.4 |
| Switzerland | 9.11 | 14.7 | 9.07 | 13.6 | 13.6 | 13.8 | 13.8 | 13.6 |
| UK | 58.4 | 66.2 | 58.4 | 73.7 | 80.1 | 93.1 | 93.9 | 72.6 |
| EU | 363 | 584 | 447 | 564 | 533 | 666 | 548 | 545 |
| Country | 3Q2020 | 4Q2020 | 1Q2021 | 2Q2021 | 3Q2021 | 4Q2021 | 1Q2022 | 2Q2022 |
|---|---|---|---|---|---|---|---|---|
| Austria | 7.21 | 9.29 | 10.2 | 12.4 | 10.3 | 9.14 | 9.74 | 11.0 |
| Belgium | 3.85 | 2.88 | 66.7 | 5.29 | 4.96 | 4.01 | 54.5 | 7.04 |
| Bulgaria | 0.120 | 0.114 | 0.151 | 0.173 | 0.169 | 0.150 | 0.201 | 0.182 |
| Croatia | 0.551 | 0.721 | 1.37 | 2.02 | 1.67 | 1.38 | 2.09 | 2.48 |
| Cyprus | 0.295 | 0.364 | 0.500 | 0.735 | 0.678 | 0.562 | 0.824 | 0.976 |
| Czechia | 3.02 | 4.95 | 5.40 | 7.62 | 6.25 | 6.18 | 6.65 | 7.93 |
| Denmark | 2.60 | 3.05 | 7.45 | 9.53 | 8.03 | 1.88 | 7.74 | 7.70 |
| Estonia | 0.684 | 0.759 | 1.44 | 1.72 | 1.68 | 1.23 | 1.92 | 1.63 |
| Finland | 5.19 | 5.32 | 8.17 | 8.11 | 6.69 | 5.15 | 7.12 | 7.05 |
| France | 49.3 | 59.1 | 70.8 | 82.4 | 63.9 | 72.8 | 75.8 | 88.3 |
| Germany | 96.4 | 121 | 101 | 120 | 113 | 95.1 | 122 | 112 |
| Greece | 3.25 | 3.79 | 5.06 | 7.32 | 5.90 | 5.11 | 6.19 | 9.33 |
| Hungary | 9.14 | 11.8 | 12.9 | 12.6 | 11.6 | 11.0 | 11.6 | 10.4 |
| Iceland | 0.404 | 0.223 | 0.331 | 0.926 | 0.713 | 0.302 | 0.459 | 1.39 |
| Ireland | 4.07 | 0.308 | 9.21 | 2.70 | 6.60 | 0.739 | 12.7 | 2.49 |
| Italy | 62.9 | 96.7 | 120 | 123 | 85.8 | 93.8 | 113 | 111 |
| Latvia | 0.542 | 0.518 | 0.792 | 1.10 | 1.08 | 0.678 | 0.978 | 0.985 |
| Lithuania | 4.20 | 2.18 | 0.775 | 1.52 | 1.24 | 1.59 | 1.38 | 1.26 |
| Luxembourg | 1.10 | 1.15 | 1.77 | 2.16 | 1.84 | 1.46 | 2.01 | 1.76 |
| Netherlands | 13.6 | 15.5 | 19.2 | 18.9 | 19.9 | 16.1 | 21.5 | 18.1 |
| Norway | 2.89 | 3.55 | 2.57 | 3.42 | 2.06 | 1.73 | 1.18 | 2.07 |
| Poland | 17.2 | 25.9 | 30.8 | 34.9 | 33.3 | 28.4 | 33.1 | 37.5 |
| Portugal | 2.94 | 4.64 | 4.13 | 6.39 | 4.15 | 4.42 | 5.90 | 5.93 |
| Romania | 4.08 | 5.67 | 5.52 | 6.96 | 10.4 | 7.88 | 7.90 | 8.54 |
| Slovakia | 2.00 | 2.64 | 2.61 | 4.64 | 4.23 | 3.68 | 4.44 | 4.27 |
| Slovenia | 0.415 | 0.416 | 1.31 | 1.72 | 1.55 | 1.46 | 1.72 | 1.71 |
| Spain | 40.3 | 51.0 | 41.0 | 66.8 | 50.6 | 61.0 | 46.7 | 68.6 |
| Sweden | 7.05 | 7.15 | 6.14 | 7.02 | 4.72 | 4.32 | 6.12 | 6.81 |
| Switzerland | 7.88 | 12.5 | 11.6 | 14.1 | 13.1 | 13.4 | 13.4 | 14.1 |
| UK | 114 | 84.4 | 109 | 133 | 123 | 78.8 | 122 | 116 |
| EU | 425 | 482 | 595 | 622 | 526 | 469 | 627 | 591 |
| Country | 3Q2020 | 4Q2020 | 1Q2021 | 2Q2021 | 3Q2021 | 4Q2021 | 1Q2022 | 2Q2022 |
|---|---|---|---|---|---|---|---|---|
| Austria | 0.001 | 0.012 | 0.025 | 0.036 | 0.018 | 0.007 | 0.034 | 0.010 |
| Belgium | 0.410 | 0.193 | 0.388 | 0.894 | 0.721 | 0.629 | 0.144 | 0.720 |
| Bulgaria | 0 | 0.001 | 0.012 | 0 | 0 | 0.023 | 0.004 | 0 |
| Croatia | 0.225 | 0.324 | 0.327 | 0.581 | 0.579 | 0.510 | 0.378 | 0.764 |
| Cyprus | 0 | 0 | 0 | 0.001 | 0.001 | 0 | 0 | 0 |
| Czechia | 1.53 | 0.592 | 0.497 | 0.913 | 0.847 | 0.856 | 1.28 | 1.18 |
| Denmark | 0 | 0 | 0 | 0 | 0 | 0 | 0 | 0 |
| Estonia | 0 | 0 | 0.188 | 0.095 | 0.121 | 0.062 | 0.102 | 0.061 |
| Finland | 0 | 0 | 0.307 | 0.275 | 0.193 | 0.146 | 0.135 | 0.072 |
| France | 6.71 | 5.89 | 9.42 | 12.8 | 13.6 | 13.2 | 16.5 | 15.6 |
| Germany | 2.38 | 3.27 | 2.52 | 3.72 | 3.27 | 4.56 | 5.72 | 2.92 |
| Greece | 0.132 | 0.295 | 0.533 | 0.884 | 0.986 | 0.991 | 0.869 | 0.846 |
| Hungary | 0.175 | 0.140 | 0.206 | 0.072 | 0.210 | 0.239 | 0.231 | 0.304 |
| Iceland | 0 | 0.001 | 0.001 | 0.001 | 0.001 | 0.004 | 0 | 0 |
| Ireland | 0 | 0 | 0.024 | 0.091 | 0.179 | 0.017 | 0.573 | 0.066 |
| Italy | 26.7 | 29.7 | 36.5 | 40.8 | 31.3 | 29.7 | 34.5 | 32.6 |
| Latvia | 0.024 | 0.058 | 0.043 | 0.075 | 0.086 | 0.077 | 0.092 | 0.068 |
| Lithuania | 0.022 | 0.051 | 0.050 | 0.076 | 0.102 | 0.090 | 0.122 | 0.064 |
| Luxembourg | 0 | 0 | 0 | 0.001 | 0.002 | 0 | 0.002 | 0 |
| Netherlands | 0.758 | 0.732 | 0.399 | 0.584 | 0.566 | 0.718 | 0.568 | 0.595 |
| Norway | 0 | 0 | 0 | 0 | 0 | 0 | 0 | 0 |
| Poland | 2.69 | 4.82 | 3.06 | 3.11 | 3.31 | 4.05 | 3.84 | 2.60 |
| Portugal | 0.466 | 0.907 | 0.435 | 0.734 | 0.965 | 1.42 | 0.914 | 1.43 |
| Romania | 2.87 | 5.25 | 1.67 | 2.91 | 6.85 | 4.52 | 3.32 | 3.12 |
| Slovakia | 0.187 | 0.193 | 0.217 | 0.303 | 0.357 | 0.311 | 0.473 | 0.407 |
| Slovenia | 0.058 | 0.076 | 0.123 | 0.160 | 0.144 | 0.145 | 0.171 | 0.236 |
| Spain | 3.57 | 4.24 | 2.56 | 3.10 | 4.28 | 4.10 | 3.02 | 4.70 |
| Sweden | 0.007 | 0 | 0.404 | 0.679 | 0.840 | 0.725 | 0.933 | 0.746 |
| Switzerland | 0.001 | 0 | 0.066 | 0.085 | 0.041 | 0.097 | 0.032 | 0.026 |
| UK | 0 | 0 | 0 | 0 | 0 | 0 | 0 | 0 |
| EU | 41.1 | 45.2 | 53.5 | 64.7 | 57.0 | 56.3 | 64.0 | 60.4 |
| Country | 3Q2020 | 4Q2020 | 1Q2021 | 2Q2021 | 3Q2021 | 4Q2021 | 1Q2022 | 2Q2022 |
|---|---|---|---|---|---|---|---|---|
| Austria | 18.3 | 22.5 | 16.3 | 17.8 | 12.3 | 11.9 | 11.9 | 12.2 |
| Belgium | 39.4 | 33.2 | 6.12 | 27.4 | 16.9 | 14.5 | 3.55 | 15.8 |
| Bulgaria | 0.910 | 0.677 | 0.573 | 0.550 | 0.447 | 0.774 | 0.507 | 0.464 |
| Croatia | 4.03 | 2.77 | 3.09 | 3.99 | 2.83 | 1.67 | 2.17 | 2.57 |
| Cyprus | 0.807 | 0.624 | 0.511 | 0.386 | 0.354 | 0.279 | 0.198 | 0.145 |
| Czechia | 16.1 | 16.3 | 13.6 | 14.1 | 9.14 | 10.5 | 10.9 | 11.6 |
| Denmark | 10.4 | 12.6 | 5.59 | 5.82 | 3.19 | 4.72 | 2.29 | 2.76 |
| Estonia | 1.32 | 1.23 | 1.42 | 1.50 | 0.737 | 0.580 | 0.825 | 0.948 |
| Finland | 3.21 | 2.68 | 2.61 | 2.62 | 1.88 | 1.28 | 1.44 | 1.61 |
| France | 139 | 142 | 108 | 105 | 64.0 | 73.0 | 60.2 | 69.8 |
| Germany | 227 | 210 | 158 | 156 | 112 | 97.8 | 126 | 120 |
| Greece | 5.78 | 6.37 | 5.05 | 5.85 | 3.69 | 2.97 | 3.44 | 4.28 |
| Hungary | 7.67 | 8.17 | 6.00 | 5.57 | 4.25 | 3.20 | 3.27 | 4.05 |
| Iceland | 0.687 | 0.300 | 0.332 | 0.600 | 0.366 | 0.275 | 0.350 | 0.971 |
| Ireland | 13.0 | 1.86 | 17.6 | 5.43 | 11.0 | 1.08 | 12.9 | 4.63 |
| Italy | 132 | 117 | 112 | 99.1 | 58.4 | 53.5 | 68.1 | 69.6 |
| Latvia | 1.21 | 1.07 | 1.07 | 0.863 | 0.758 | 0.586 | 0.658 | 0.632 |
| Lithuania | 1.77 | 2.75 | 1.16 | 1.65 | 1.14 | 0.724 | 1.07 | 0.975 |
| Luxembourg | 4.80 | 3.89 | 3.77 | 3.26 | 2.09 | 2.08 | 2.67 | 2.38 |
| Netherlands | 3.18 | 1.69 | 2.16 | 2.39 | 1.47 | 0.898 | 1.43 | 1.53 |
| Norway | 3.10 | 2.37 | 2.09 | 2.20 | 1.36 | 1.44 | 1.01 | 1.29 |
| Poland | 21.9 | 24.4 | 17.0 | 16.3 | 10.9 | 11.4 | 9.70 | 13.3 |
| Portugal | 13.6 | 12.2 | 8.16 | 10.9 | 6.05 | 6.91 | 6.75 | 7.13 |
| Romania | 8.39 | 11.0 | 4.93 | 5.35 | 6.19 | 3.93 | 3.99 | 3.98 |
| Slovakia | 5.49 | 5.06 | 4.04 | 4.38 | 3.53 | 2.96 | 3.11 | 3.34 |
| Slovenia | 4.96 | 3.54 | 4.81 | 3.84 | 2.53 | 2.14 | 2.25 | 2.69 |
| Spain | 70.0 | 70.0 | 42.8 | 53.0 | 34.9 | 40.5 | 29.6 | 42.4 |
| Sweden | 15.9 | 16.0 | 19.5 | 12.9 | 7.73 | 8.19 | 8.89 | 10.6 |
| Switzerland | 13.7 | 14.2 | 9.36 | 10.0 | 6.49 | 6.55 | 6.39 | 7.05 |
| UK | 90.1 | 52.7 | 48.6 | 44.5 | 24.5 | 18.2 | 23.7 | 22.3 |
| EU | 803 | 722 | 568 | 565 | 368 | 346 | 371 | 396 |
| Country | 3Q2020 | 4Q2020 | 1Q2021 | 2Q2021 | 3Q2021 | 4Q2021 | 1Q2022 | 2Q2022 |
|---|---|---|---|---|---|---|---|---|
| Austria | 29.0 | 26.0 | 26.6 | 27.7 | 20.8 | 16.4 | 20.4 | 22.4 |
| Belgium | 60.1 | 41.0 | 29.2 | 61.1 | 41.2 | 32.5 | 20.1 | 46.3 |
| Bulgaria | 5.82 | 4.44 | 4.75 | 6.47 | 5.35 | 4.84 | 5.78 | 6.89 |
| Croatia | 5.91 | 3.79 | 5.50 | 8.86 | 5.93 | 3.75 | 4.90 | 7.37 |
| Cyprus | 1.61 | 1.43 | 1.68 | 1.88 | 1.71 | 1.17 | 1.94 | 1.78 |
| Czechia | 31.5 | 30.2 | 28.5 | 38.7 | 31.4 | 25.8 | 27.0 | 28.7 |
| Denmark | 30.6 | 26.3 | 20.3 | 21.9 | 15.0 | 16.4 | 12.7 | 15.6 |
| Estonia | 2.87 | 2.21 | 2.54 | 3.72 | 2.89 | 1.78 | 2.09 | 2.93 |
| Finland | 12.2 | 9.60 | 9.65 | 8.89 | 6.87 | 5.35 | 5.57 | 5.85 |
| France | 210 | 201 | 192 | 198 | 132 | 145 | 140 | 150 |
| Germany | 393 | 350 | 252 | 285 | 232 | 203 | 221 | 223 |
| Greece | 13.4 | 8.93 | 11.5 | 19.0 | 11.2 | 7.93 | 10.2 | 15.6 |
| Hungary | 15.8 | 15.3 | 11.6 | 12.5 | 11.4 | 9.95 | 11.0 | 11.8 |
| Iceland | 0.807 | 0.348 | 0.347 | 0.824 | 0.676 | 0.112 | 0.288 | 0.950 |
| Ireland | 11.7 | 1.09 | 15.6 | 4.66 | 12.4 | 1.09 | 13.5 | 4.90 |
| Italy | 137 | 133 | 149 | 137 | 73.3 | 78.1 | 92.2 | 98.8 |
| Latvia | 1.92 | 1.36 | 1.54 | 2.06 | 1.94 | 1.24 | 1.75 | 2.46 |
| Lithuania | 5.28 | 6.87 | 5.55 | 7.46 | 4.79 | 2.12 | 3.44 | 4.73 |
| Luxembourg | 5.86 | 3.94 | 4.66 | 5.21 | 3.69 | 3.30 | 3.99 | 3.79 |
| Netherlands | 53.9 | 40.3 | 46.6 | 40.4 | 32.4 | 27.5 | 32.6 | 29.2 |
| Norway | 3.17 | 1.96 | 1.85 | 2.41 | 1.75 | 1.47 | 1.01 | 1.41 |
| Poland | 71.4 | 74.5 | 64.1 | 65.9 | 53.8 | 49.9 | 50.6 | 51.8 |
| Portugal | 19.1 | 14.5 | 13.3 | 24.8 | 13.1 | 11.9 | 13.6 | 18.6 |
| Romania | 18.8 | 18.4 | 8.23 | 11.3 | 16.1 | 12.2 | 11.7 | 11.7 |
| Slovakia | 13.4 | 12.0 | 8.14 | 13.1 | 11.6 | 9.31 | 10.5 | 12.0 |
| Slovenia | 9.39 | 5.77 | 9.68 | 8.72 | 7.45 | 6.51 | 7.89 | 7.85 |
| Spain | 130 | 110 | 89.1 | 130 | 84.8 | 83.9 | 67.4 | 107 |
| Sweden | 29.0 | 27.8 | 32.4 | 24.9 | 18.1 | 17.1 | 16.4 | 18.9 |
| Switzerland | 29.6 | 31.8 | 26.4 | 30.2 | 22.3 | 21.0 | 20.6 | 20.5 |
| UK | 327 | 184 | 209 | 233 | 179 | 141 | 178 | 173 |
| EU | 1,496 | 1,212 | 1,130 | 1,256 | 901 | 813 | 869 | 956 |

 Helgi Library