Sales of electrically-chargeable vehicles amounted to 555 thousand in 3Q2022, 21.5 thousand more than the last year.
Electric cars represented 23.2% of all new cars sold in 3Q2022, up from 22.4% a year ago.
Most electric vehicles have been sold in Germany (182 thousand), while Cyprus registered the biggest increase in sales when compared to last year.
Sales of new electrically-chargeable passenger cars (battery electric and plug-in hybrid electric vehicles) reached 555 thousand in the third quarter of 2022 in the enlarged Europe (EU plus Iceland, Norway and Switzerland), according to ACEA. This is 4.02% more, or 533 thousand more than in the previous year.
Share of electric chargeable vehicles increased to 23.2% of all new passenger cars sold in 3Q2022, up from 22.4% seen in the third quarter of 2021. Most electric vehicles (182 thousand) were sold in Germany (up 10.1% yoy), followed by the United Kingdom (83.1 thousand, up 3.72%), France with 73.4 thousand thousand cars (up 13.8%), 30.6 thousand new vehicles were registered in Sweden (up 9.74%) and 29.7 thousand in Norway (down 25.3%). The five largest countries accounted for 71.9% of total new vehicles registered in the third quarter of 2022:
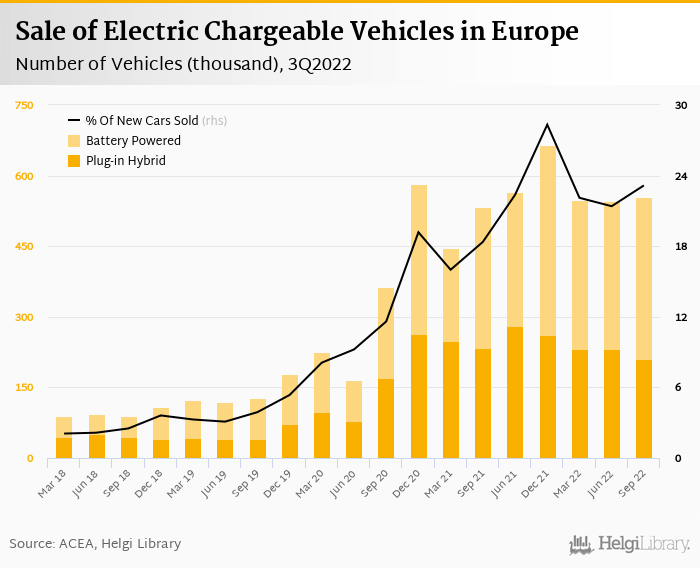

As partly seen above, the sale of battery-electric (BEV) increased by 14.9% when compared to last year, while registration of plug-in hybrid vehicles (PHEV) fell by 9.92%.
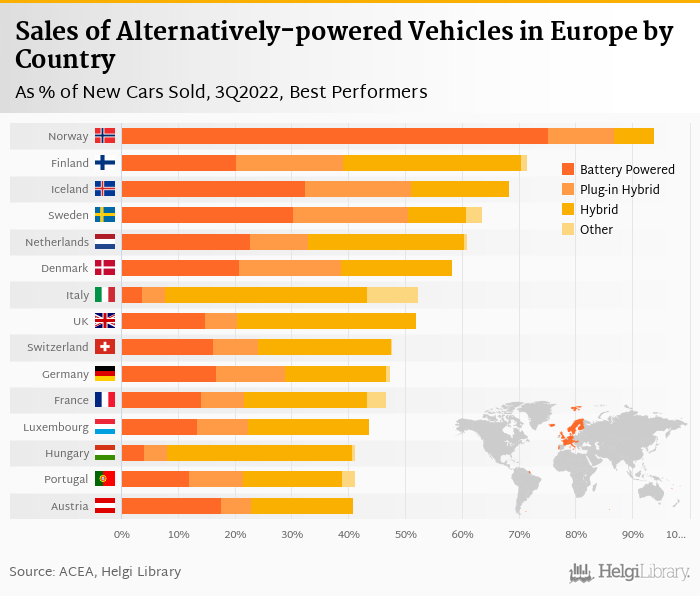
In relative terms, Norway liked the electric chargeable vehicles the most in the third quarter of 2022 with 86.7% of all new passenger cars sold followed by Iceland (51.0%) and Sweden (50.6%).
On the other end of the scale was Czechia with only 3.86%, Bulgaria with 3.81% and Slovakia with just 3.63% of electric cars sold, as % of total:


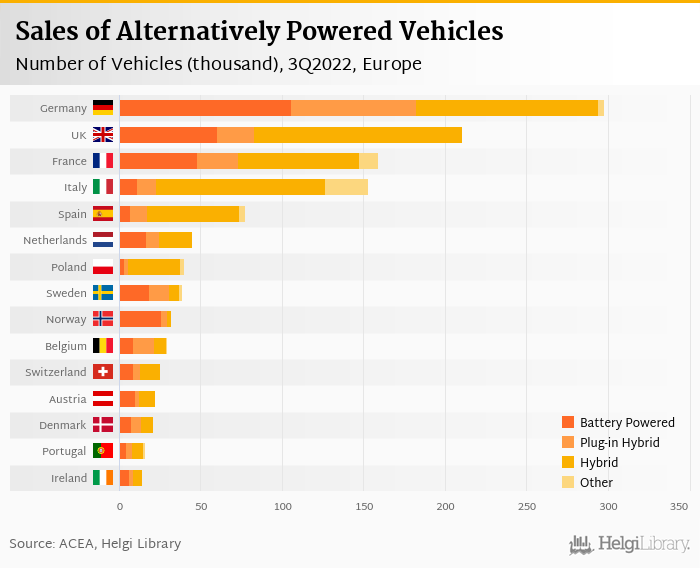
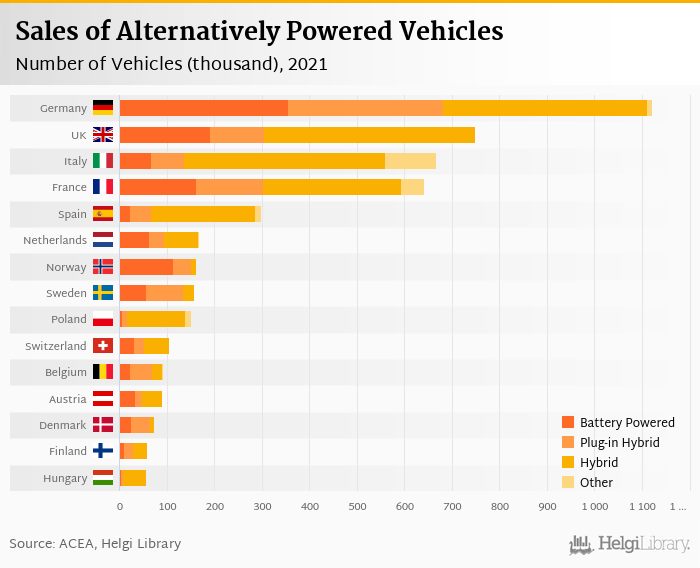
When hybrid electric vehicles (cars that combine a conventional internal combustion engine system with an electric propulsion system) and other alternatively-powered cars (such as natural gas vehicles (NGV), LPG-fueled vehicles and ethanol (E85) vehicles) are included, total sales of alternatively-powered cars (other than using diesel or petrol) amounted to 1,172 thousand vehicles in the third quarter of 2022. This is 5.02% more, or 56 thousand more than in the previous year.
Together with electric chargeable vehicles, the share of total alternatively-powered vehicles increased to 48.9% of all new passenger cars sold in 3Q2022, up from 46.8% seen in the third quarter of 2021:

In relative terms, Norway liked the alternatively-powered vehicles the most in the third quarter of 2022 with 93.8% of all new passenger cars sold followed by Finland (71.4%) and Iceland (68.2%). On the other hand, alternatively-fuelled cars represented only 22.7% of all cars sold in Slovenia, 20.7% in Czechia and 6.28% in Bulgaria, according to ACEA.

Sales of traditionally-powered vehicles using petrol and diesel reached 1,223 thousand in the third quarter of 2022 in the enlarged Europe, according to ACEA. This is 3.63%, or 46.0 thousand fewer than in the previous year.
Some 873 thousand petrol-powered vehicles were sold, down 3.03% when compared to a year ago. The share decreased to 36.5% of all new passenger cars sold in 3Q2022, down from 37.8% seen in the third quarter of 2021. Share of diesel-powered cars fell to 14.6% (from 15.4% in 3Q2021) with 350 thousand cars sold in the third quarter of 2022.
As a result, share of traditionally-powered cars amounted to 51.1% of all new passenger cars sold in 3Q2022, down from 53.2% seen in the third quarter of 2021.


In relative terms, Bulgaria liked the petrol-fuelled vehicles the most in the third quarter of 2022 with 88.1% of all new passenger cars sold followed by Lithuania (60.5%) and Czechia (58.4%). On the other hand, diesel-powered cars were preferred most in Ireland (27.2% of all cars sold), followed by Austria (with 23.7%) and Luxembourg (21.7%).


The following charts show where the most cars are sold absolutely and relatively in Europe and elsewhere in the world:


| Country | 4Q2020 | 1Q2021 | 2Q2021 | 3Q2021 | 4Q2021 | 1Q2022 | 2Q2022 | 3Q2022 |
|---|---|---|---|---|---|---|---|---|
| Austria | 10.2 | 10.3 | 12.9 | 12.2 | 12.5 | 10.4 | 10.7 | 12.5 |
| Belgium | 19.9 | 16.8 | 18.4 | 17.4 | 17.9 | 24.9 | 22.4 | 21.7 |
| Bulgaria | ... | 0.086 | 0.142 | 0.151 | 0.150 | 0.184 | 0.342 | 0.283 |
| Croatia | 0.330 | 0.201 | 0.352 | 0.460 | 0.861 | 0.457 | 0.366 | 0.719 |
| Cyprus | 0.020 | 0.055 | 0.049 | 0.048 | 0.028 | 0.101 | 0.169 | 0.179 |
| Czechia | 2.33 | 1.53 | 1.96 | 1.36 | 1.70 | 1.54 | 2.05 | 1.73 |
| Denmark | 14.1 | 10.5 | 15.3 | 17.2 | 22.4 | 11.5 | 13.3 | 13.8 |
| Estonia | 0.172 | 0.139 | 0.238 | 0.167 | 0.148 | 0.254 | 0.344 | 0.256 |
| Finland | 5.20 | 7.24 | 8.87 | 6.29 | 7.89 | 7.47 | 7.18 | 7.60 |
| France | 74.8 | 61.7 | 82.6 | 64.5 | 94.4 | 72.8 | 83.3 | 73.4 |
| Germany | 190 | 143 | 170 | 166 | 204 | 152 | 155 | 182 |
| Greece | 1.25 | 1.30 | 1.91 | 1.60 | 2.16 | 1.78 | 2.31 | 1.82 |
| Hungary | 2.53 | 1.48 | 1.79 | 2.26 | 3.02 | 2.54 | 2.16 | 2.31 |
| Iceland | 1.23 | 1.08 | 1.60 | 2.01 | 2.30 | 2.12 | 2.74 | 1.94 |
| Ireland | 0.553 | 5.55 | 2.95 | 6.78 | 1.27 | 10.2 | 3.20 | 8.54 |
| Italy | 29.9 | 29.8 | 38.6 | 31.9 | 37.2 | 30.9 | 33.8 | 22.7 |
| Latvia | 0.104 | 0.097 | 0.170 | 0.128 | 0.174 | 0.212 | 0.333 | 0.381 |
| Lithuania | 0.125 | 0.122 | 0.343 | 0.386 | 0.572 | 0.490 | 0.471 | 0.535 |
| Luxembourg | 2.17 | 2.27 | 2.21 | 2.10 | 2.52 | 2.68 | 2.53 | 2.30 |
| Netherlands | 49.9 | 12.2 | 19.9 | 21.2 | 41.8 | 22.4 | 25.9 | 24.4 |
| Norway | 38.2 | 29.8 | 39.6 | 39.8 | 42.8 | 29.1 | 31.4 | 29.7 |
| Poland | 3.54 | 2.93 | 4.01 | 3.90 | 5.61 | 4.73 | 5.08 | 5.57 |
| Portugal | 7.55 | 4.98 | 7.57 | 6.86 | 9.51 | 7.62 | 7.60 | 8.26 |
| Romania | 1.44 | 0.415 | 0.459 | 1.04 | 5.34 | 2.11 | 2.35 | 3.26 |
| Slovakia | 0.376 | 0.397 | 0.595 | 0.553 | 0.726 | 0.666 | 0.718 | 0.659 |
| Slovenia | 0.664 | 0.364 | 0.406 | 0.509 | 0.640 | 0.729 | 0.618 | 0.752 |
| Spain | 20.1 | 10.6 | 17.8 | 16.5 | 22.1 | 17.7 | 20.4 | 17.3 |
| Sweden | 37.5 | 32.4 | 36.8 | 27.9 | 38.3 | 37.4 | 37.4 | 30.6 |
| Switzerland | 14.7 | 9.07 | 13.6 | 13.6 | 13.8 | 13.8 | 13.6 | 12.8 |
| UK | 66.2 | 58.4 | 73.7 | 80.1 | 93.1 | 93.9 | 72.6 | 83.1 |
| EU | 584 | 447 | 564 | 533 | 666 | 548 | 545 | 555 |
| Country | 4Q2020 | 1Q2021 | 2Q2021 | 3Q2021 | 4Q2021 | 1Q2022 | 2Q2022 | 3Q2022 |
|---|---|---|---|---|---|---|---|---|
| Austria | 9.29 | 10.2 | 12.4 | 10.3 | 9.14 | 9.74 | 11.0 | 9.83 |
| Belgium | 2.88 | 66.7 | 5.29 | 4.96 | 4.01 | 54.5 | 7.04 | 6.94 |
| Bulgaria | 0.114 | 0.151 | 0.173 | 0.169 | 0.150 | 0.201 | 0.182 | 0.184 |
| Croatia | 0.721 | 1.37 | 2.02 | 1.67 | 1.38 | 2.09 | 2.48 | 1.91 |
| Cyprus | 0.364 | 0.500 | 0.735 | 0.678 | 0.562 | 0.824 | 0.976 | 0.906 |
| Czechia | 4.95 | 5.40 | 7.62 | 6.25 | 6.18 | 6.65 | 7.93 | 6.35 |
| Denmark | 3.05 | 7.45 | 9.53 | 8.03 | 1.88 | 7.74 | 7.70 | 6.98 |
| Estonia | 0.759 | 1.44 | 1.72 | 1.68 | 1.23 | 1.92 | 1.63 | 1.54 |
| Finland | 5.32 | 8.17 | 8.11 | 6.69 | 5.15 | 7.12 | 7.05 | 6.06 |
| France | 59.1 | 70.8 | 82.4 | 63.9 | 72.8 | 75.8 | 88.3 | 73.9 |
| Germany | 121 | 101 | 120 | 113 | 95.1 | 122 | 112 | 111 |
| Greece | 3.79 | 5.06 | 7.32 | 5.90 | 5.11 | 6.19 | 9.33 | 7.27 |
| Hungary | 11.8 | 12.9 | 12.6 | 11.6 | 11.0 | 11.6 | 10.4 | 9.22 |
| Iceland | 0.223 | 0.331 | 0.926 | 0.713 | 0.302 | 0.459 | 1.39 | 0.654 |
| Ireland | 0.308 | 9.21 | 2.70 | 6.60 | 0.739 | 12.7 | 2.49 | 5.66 |
| Italy | 96.7 | 120 | 123 | 85.8 | 93.8 | 113 | 111 | 104 |
| Latvia | 0.518 | 0.792 | 1.10 | 1.08 | 0.678 | 0.978 | 0.985 | 1.24 |
| Lithuania | 2.18 | 0.775 | 1.52 | 1.24 | 1.59 | 1.38 | 1.26 | 1.06 |
| Luxembourg | 1.15 | 1.77 | 2.16 | 1.84 | 1.46 | 2.01 | 1.76 | 2.18 |
| Netherlands | 15.5 | 19.2 | 18.9 | 19.9 | 16.1 | 21.5 | 18.1 | 20.3 |
| Norway | 3.55 | 2.57 | 3.42 | 2.06 | 1.73 | 1.18 | 2.07 | 2.42 |
| Poland | 25.9 | 30.8 | 34.9 | 33.3 | 28.4 | 33.1 | 37.5 | 31.6 |
| Portugal | 4.64 | 4.13 | 6.39 | 4.15 | 4.42 | 5.90 | 5.93 | 6.64 |
| Romania | 5.67 | 5.52 | 6.96 | 10.4 | 7.88 | 7.90 | 8.54 | 9.24 |
| Slovakia | 2.64 | 2.61 | 4.64 | 4.23 | 3.68 | 4.44 | 4.27 | 3.89 |
| Slovenia | 0.416 | 1.31 | 1.72 | 1.55 | 1.46 | 1.72 | 1.71 | 1.53 |
| Spain | 51.0 | 41.0 | 66.8 | 50.6 | 61.0 | 46.7 | 68.6 | 56.4 |
| Sweden | 7.15 | 6.14 | 7.02 | 4.72 | 4.32 | 6.12 | 6.81 | 6.19 |
| Switzerland | 12.5 | 11.6 | 14.1 | 13.1 | 13.4 | 13.4 | 14.1 | 12.5 |
| UK | 84.4 | 109 | 133 | 123 | 78.8 | 122 | 116 | 128 |
| EU | 482 | 595 | 622 | 526 | 469 | 627 | 591 | 566 |
| Country | 4Q2020 | 1Q2021 | 2Q2021 | 3Q2021 | 4Q2021 | 1Q2022 | 2Q2022 | 3Q2022 |
|---|---|---|---|---|---|---|---|---|
| Austria | 0.012 | 0.025 | 0.036 | 0.018 | 0.007 | 0.034 | 0.010 | 0.008 |
| Belgium | 0.193 | 0.388 | 0.894 | 0.721 | 0.629 | 0.144 | 0.720 | 0.640 |
| Bulgaria | 0.001 | 0.012 | 0 | 0 | 0.023 | 0.004 | 0 | 0 |
| Croatia | 0.324 | 0.327 | 0.581 | 0.579 | 0.510 | 0.378 | 0.764 | 0.412 |
| Cyprus | 0 | 0 | 0.001 | 0.001 | 0 | 0 | 0 | 0.001 |
| Czechia | 0.592 | 0.497 | 0.913 | 0.847 | 0.856 | 1.28 | 1.18 | 1.20 |
| Denmark | 0 | 0 | 0 | 0 | 0 | 0 | 0 | 0 |
| Estonia | 0 | 0.188 | 0.095 | 0.121 | 0.062 | 0.102 | 0.061 | 0.091 |
| Finland | 0 | 0.307 | 0.275 | 0.193 | 0.146 | 0.135 | 0.072 | 0.210 |
| France | 5.89 | 9.42 | 12.8 | 13.6 | 13.2 | 16.5 | 15.6 | 11.6 |
| Germany | 3.27 | 2.52 | 3.72 | 3.27 | 4.56 | 5.72 | 2.92 | 4.28 |
| Greece | 0.295 | 0.533 | 0.884 | 0.986 | 0.991 | 0.869 | 0.846 | 1.05 |
| Hungary | 0.140 | 0.206 | 0.072 | 0.210 | 0.239 | 0.231 | 0.304 | 0.172 |
| Iceland | 0.001 | 0.001 | 0.001 | 0.001 | 0.004 | 0 | 0 | 0 |
| Ireland | 0 | 0.024 | 0.091 | 0.179 | 0.017 | 0.573 | 0.066 | 0.081 |
| Italy | 29.7 | 36.5 | 40.8 | 31.3 | 29.7 | 34.5 | 32.6 | 26.3 |
| Latvia | 0.058 | 0.043 | 0.075 | 0.086 | 0.077 | 0.092 | 0.068 | 0.094 |
| Lithuania | 0.051 | 0.050 | 0.076 | 0.102 | 0.090 | 0.122 | 0.064 | 0.083 |
| Luxembourg | 0 | 0 | 0.001 | 0.002 | 0 | 0.002 | 0 | 0 |
| Netherlands | 0.732 | 0.399 | 0.584 | 0.566 | 0.718 | 0.568 | 0.595 | 0.400 |
| Norway | 0 | 0 | 0 | 0 | 0 | 0 | 0 | 0 |
| Poland | 4.82 | 3.06 | 3.11 | 3.31 | 4.05 | 3.84 | 2.60 | 2.83 |
| Portugal | 0.907 | 0.435 | 0.734 | 0.965 | 1.42 | 0.914 | 1.43 | 0.885 |
| Romania | 5.25 | 1.67 | 2.91 | 6.85 | 4.52 | 3.32 | 3.12 | 3.40 |
| Slovakia | 0.193 | 0.217 | 0.303 | 0.357 | 0.311 | 0.473 | 0.407 | 0.333 |
| Slovenia | 0.076 | 0.123 | 0.160 | 0.144 | 0.145 | 0.171 | 0.236 | 0.191 |
| Spain | 4.24 | 2.56 | 3.10 | 4.28 | 4.10 | 3.02 | 4.70 | 3.39 |
| Sweden | 0 | 0.404 | 0.679 | 0.840 | 0.725 | 0.933 | 0.746 | 1.69 |
| Switzerland | 0 | 0.066 | 0.085 | 0.041 | 0.097 | 0.032 | 0.026 | 0.032 |
| UK | 0 | 0 | 0 | 0 | 0 | 0 | 0 | 0 |
| EU | 45.2 | 53.5 | 64.7 | 57.0 | 56.3 | 64.0 | 60.4 | 50.6 |
| Country | 4Q2020 | 1Q2021 | 2Q2021 | 3Q2021 | 4Q2021 | 1Q2022 | 2Q2022 | 3Q2022 |
|---|---|---|---|---|---|---|---|---|
| Austria | 22.5 | 16.3 | 17.8 | 12.3 | 11.9 | 11.9 | 12.2 | 13.0 |
| Belgium | 33.2 | 6.12 | 27.4 | 16.9 | 14.5 | 3.55 | 15.8 | 13.4 |
| Bulgaria | 0.677 | 0.573 | 0.550 | 0.447 | 0.774 | 0.507 | 0.464 | 0.420 |
| Croatia | 2.77 | 3.09 | 3.99 | 2.83 | 1.67 | 2.17 | 2.57 | 2.52 |
| Cyprus | 0.624 | 0.511 | 0.386 | 0.354 | 0.279 | 0.198 | 0.145 | 0.138 |
| Czechia | 16.3 | 13.6 | 14.1 | 9.14 | 10.5 | 10.9 | 11.6 | 9.42 |
| Denmark | 12.6 | 5.59 | 5.82 | 3.19 | 4.72 | 2.29 | 2.76 | 2.40 |
| Estonia | 1.23 | 1.42 | 1.50 | 0.737 | 0.580 | 0.825 | 0.948 | 0.889 |
| Finland | 2.68 | 2.61 | 2.62 | 1.88 | 1.28 | 1.44 | 1.61 | 1.22 |
| France | 142 | 108 | 105 | 64.0 | 73.0 | 60.2 | 69.8 | 52.3 |
| Germany | 210 | 158 | 156 | 112 | 97.8 | 126 | 120 | 116 |
| Greece | 6.37 | 5.05 | 5.85 | 3.69 | 2.97 | 3.44 | 4.28 | 5.57 |
| Hungary | 8.17 | 6.00 | 5.57 | 4.25 | 3.20 | 3.27 | 4.05 | 3.79 |
| Iceland | 0.300 | 0.332 | 0.600 | 0.366 | 0.275 | 0.350 | 0.971 | 0.704 |
| Ireland | 1.86 | 17.6 | 5.43 | 11.0 | 1.08 | 12.9 | 4.63 | 9.85 |
| Italy | 117 | 112 | 99.1 | 58.4 | 53.5 | 68.1 | 69.6 | 56.4 |
| Latvia | 1.07 | 1.07 | 0.863 | 0.758 | 0.586 | 0.658 | 0.632 | 0.797 |
| Lithuania | 2.75 | 1.16 | 1.65 | 1.14 | 0.724 | 1.07 | 0.975 | 0.934 |
| Luxembourg | 3.89 | 3.77 | 3.26 | 2.09 | 2.08 | 2.67 | 2.38 | 2.22 |
| Netherlands | 1.69 | 2.16 | 2.39 | 1.47 | 0.898 | 1.43 | 1.53 | 0.875 |
| Norway | 2.37 | 2.09 | 2.20 | 1.36 | 1.44 | 1.01 | 1.29 | 1.26 |
| Poland | 24.4 | 17.0 | 16.3 | 10.9 | 11.4 | 9.70 | 13.3 | 11.7 |
| Portugal | 12.2 | 8.16 | 10.9 | 6.05 | 6.91 | 6.75 | 7.13 | 7.04 |
| Romania | 11.0 | 4.93 | 5.35 | 6.19 | 3.93 | 3.99 | 3.98 | 4.38 |
| Slovakia | 5.06 | 4.04 | 4.38 | 3.53 | 2.96 | 3.11 | 3.34 | 3.08 |
| Slovenia | 3.54 | 4.81 | 3.84 | 2.53 | 2.14 | 2.25 | 2.69 | 2.11 |
| Spain | 70.0 | 42.8 | 53.0 | 34.9 | 40.5 | 29.6 | 42.4 | 33.4 |
| Sweden | 16.0 | 19.5 | 12.9 | 7.73 | 8.19 | 8.89 | 10.6 | 6.83 |
| Switzerland | 14.2 | 9.36 | 10.0 | 6.49 | 6.55 | 6.39 | 7.05 | 6.42 |
| UK | 52.7 | 48.6 | 44.5 | 24.5 | 18.2 | 23.7 | 22.3 | 21.0 |
| EU | 722 | 568 | 565 | 368 | 346 | 371 | 396 | 350 |
| Country | 4Q2020 | 1Q2021 | 2Q2021 | 3Q2021 | 4Q2021 | 1Q2022 | 2Q2022 | 3Q2022 |
|---|---|---|---|---|---|---|---|---|
| Austria | 26.0 | 26.6 | 27.7 | 20.8 | 16.4 | 20.4 | 22.4 | 19.3 |
| Belgium | 41.0 | 29.2 | 61.1 | 41.2 | 32.5 | 20.1 | 46.3 | 43.4 |
| Bulgaria | 4.44 | 4.75 | 6.47 | 5.35 | 4.84 | 5.78 | 6.89 | 6.55 |
| Croatia | 3.79 | 5.50 | 8.86 | 5.93 | 3.75 | 4.90 | 7.37 | 6.49 |
| Cyprus | 1.43 | 1.68 | 1.88 | 1.71 | 1.17 | 1.94 | 1.78 | 1.71 |
| Czechia | 30.2 | 28.5 | 38.7 | 31.4 | 25.8 | 27.0 | 28.7 | 26.2 |
| Denmark | 26.3 | 20.3 | 21.9 | 15.0 | 16.4 | 12.7 | 15.6 | 12.4 |
| Estonia | 2.21 | 2.54 | 3.72 | 2.89 | 1.78 | 2.09 | 2.93 | 2.33 |
| Finland | 9.60 | 9.65 | 8.89 | 6.87 | 5.35 | 5.57 | 5.85 | 4.33 |
| France | 201 | 192 | 198 | 132 | 145 | 140 | 150 | 129 |
| Germany | 350 | 252 | 285 | 232 | 203 | 221 | 223 | 216 |
| Greece | 8.93 | 11.5 | 19.0 | 11.2 | 7.93 | 10.2 | 15.6 | 12.4 |
| Hungary | 15.3 | 11.6 | 12.5 | 11.4 | 9.95 | 11.0 | 11.8 | 12.9 |
| Iceland | 0.348 | 0.347 | 0.824 | 0.676 | 0.112 | 0.288 | 0.950 | 0.502 |
| Ireland | 1.09 | 15.6 | 4.66 | 12.4 | 1.09 | 13.5 | 4.90 | 12.1 |
| Italy | 133 | 149 | 137 | 73.3 | 78.1 | 92.2 | 98.8 | 82.8 |
| Latvia | 1.36 | 1.54 | 2.06 | 1.94 | 1.24 | 1.75 | 2.46 | 2.03 |
| Lithuania | 6.87 | 5.55 | 7.46 | 4.79 | 2.12 | 3.44 | 4.73 | 3.99 |
| Luxembourg | 3.94 | 4.66 | 5.21 | 3.69 | 3.30 | 3.99 | 3.79 | 3.56 |
| Netherlands | 40.3 | 46.6 | 40.4 | 32.4 | 27.5 | 32.6 | 29.2 | 28.1 |
| Norway | 1.96 | 1.85 | 2.41 | 1.75 | 1.47 | 1.01 | 1.41 | 0.861 |
| Poland | 74.5 | 64.1 | 65.9 | 53.8 | 49.9 | 50.6 | 51.8 | 52.5 |
| Portugal | 14.5 | 13.3 | 24.8 | 13.1 | 11.9 | 13.6 | 18.6 | 15.5 |
| Romania | 18.4 | 8.23 | 11.3 | 16.1 | 12.2 | 11.7 | 11.7 | 16.1 |
| Slovakia | 12.0 | 8.14 | 13.1 | 11.6 | 9.31 | 10.5 | 12.0 | 10.2 |
| Slovenia | 5.77 | 9.68 | 8.72 | 7.45 | 6.51 | 7.89 | 7.85 | 6.33 |
| Spain | 110 | 89.1 | 130 | 84.8 | 83.9 | 67.4 | 107 | 82.0 |
| Sweden | 27.8 | 32.4 | 24.9 | 18.1 | 17.1 | 16.4 | 18.9 | 15.2 |
| Switzerland | 31.8 | 26.4 | 30.2 | 22.3 | 21.0 | 20.6 | 20.5 | 21.3 |
| UK | 184 | 209 | 233 | 179 | 141 | 178 | 173 | 175 |
| EU | 1,212 | 1,130 | 1,256 | 901 | 813 | 869 | 956 | 873 |

 Helgi Library