By Helgi Library - July 16, 2018
Banca Commerciala Romana's customer deposits reached RON 52,496 mil in 2017, up 8.83% compared to the previous year. Romanian b...
By Helgi Library - May 28, 2018
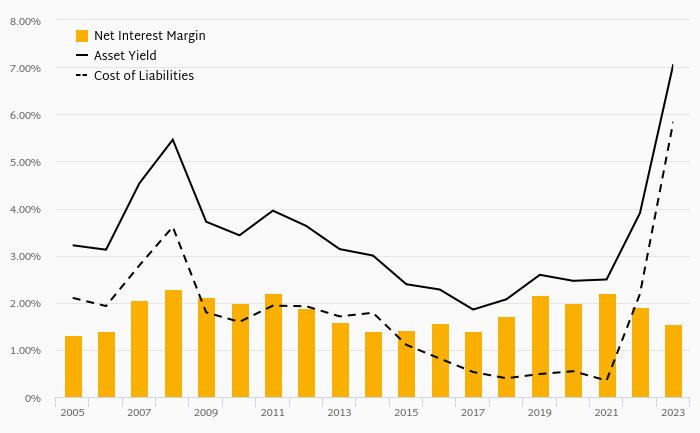
Banca Commerciala Romana's net interest margin amounted to 2.55% in 2017, down from 2.75% compared to the previous year. H...
By Helgi Library - July 16, 2018
Banca Commerciala Romana's corporate deposits reached RON 15,083 mil in 2017, up 14.1% compared to the previous year. Romanian ...
| Profit Statement | 2015 | 2016 | 2017 | |
| Net Interest Income | RON mil | 1,993 | 1,787 | 1,764 |
| Net Fee Income | RON mil | 725 | 709 | 701 |
| Other Income | RON mil | 357 | 373 | 423 |
| Total Revenues | RON mil | 3,075 | 2,868 | 2,888 |
| Staff Cost | RON mil | 717 | 730 | 742 |
| Operating Profit | RON mil | 1,562 | 1,298 | 1,344 |
| Provisions | RON mil | 77.9 | -392 | 32.3 |
| Net Profit | RON mil | 919 | 1,042 | 668 |
| Balance Sheet | 2015 | 2016 | 2017 | |
| Interbank Loans | RON mil | 204 | 553 | 2,215 |
| Customer Loans | RON mil | 32,451 | 32,291 | 33,491 |
| Total Assets | RON mil | 62,360 | 67,515 | 70,931 |
| Shareholders' Equity | RON mil | 5,875 | 6,804 | 7,439 |
| Interbank Borrowing | RON mil | 11,247 | 5,133 | 3,390 |
| Customer Deposits | RON mil | 42,626 | 48,235 | 52,496 |
| Issued Debt Securities | RON mil | 1,438 | 2,982 | 2,911 |
| Ratios | 2015 | 2016 | 2017 | |
| ROE | % | 17.0 | 16.4 | 9.38 |
| ROA | % | 1.48 | 1.60 | 0.965 |
| Costs (As % Of Assets) | % | 2.44 | 2.42 | 2.23 |
| Costs (As % Of Income) | % | 49.2 | 54.8 | 53.5 |
| Capital Adequacy Ratio | % | 19.9 | 20.3 | 21.3 |
| Net Interest Margin | % | 3.21 | 2.75 | 2.55 |
| Loans (As % Of Deposits) | % | 76.1 | 66.9 | 63.8 |
| NPLs (As % Of Loans) | % | 18.9 | 12.8 | 9.38 |
| Provisions (As % Of NPLs) | % | 82.5 | 78.4 | 80.3 |
| Growth Rates | 2015 | 2016 | 2017 | |
| Total Revenue Growth | % | -9.28 | -6.72 | 0.687 |
| Operating Cost Growth | % | -24.2 | 3.77 | -1.67 |
| Operating Profit Growth | % | 12.0 | -16.9 | 3.54 |
| Net Profit Growth | % | -133 | 13.4 | -35.9 |
| Customer Loan Growth | % | -0.354 | -0.492 | 3.72 |
| Total Asset Growth | % | 1.19 | 8.27 | 5.06 |
| Customer Deposit Growth | % | 6.77 | 13.2 | 8.83 |
| Shareholders' Equity Growth | % | 19.7 | 15.8 | 9.33 |
| Employees | 7,065 | 7,078 | 7,265 | |
Get all company financials in excel:
| summary | Unit | 2000 | 2001 | 2002 | 2003 | 2004 | 2005 | 2006 | 2007 | 2008 | 2009 | 2010 | 2011 | 2012 | 2013 | 2014 | 2015 | 2016 | 2017 |
| income statement | |||||||||||||||||||
| Net Interest Income | RON mil | 3,132 | 2,898 | 2,776 | 2,289 | 1,993 | |||||||||||||
| Total Revenues | RON mil | 4,318 | 4,155 | 4,001 | 3,389 | 3,075 | |||||||||||||
| Operating Profit | RON mil | 2,274 | 2,140 | 2,160 | 1,394 | 1,562 | |||||||||||||
| Net Profit | RON mil | 68.4 | -1,235 | 591 | -2,800 | 919 | |||||||||||||
| balance sheet | |||||||||||||||||||
| Interbank Loans | RON mil | 1,100 | 361 | 508 | 525 | 204 | |||||||||||||
| Customer Loans | RON mil | 47,804 | 44,862 | 38,002 | 32,566 | 32,451 | |||||||||||||
| Debt Securities | RON mil | 14,299 | 16,035 | 10,495 | 17,964 | 17,358 | |||||||||||||
| Total Assets | RON mil | 76,746 | 73,288 | 66,729 | 61,625 | 62,360 | |||||||||||||
| Shareholders' Equity | RON mil | 7,546 | 6,803 | 7,423 | 4,910 | 5,875 | |||||||||||||
| Interbank Borrowing | RON mil | 22,906 | 24,046 | 18,152 | 14,191 | 11,247 | |||||||||||||
| Customer Deposits | RON mil | 39,664 | 37,893 | 37,448 | 39,923 | 42,626 | |||||||||||||
| Issued Debt Securities | RON mil | 3,158 | 3,120 | 2,617 | 1,598 | 1,438 | |||||||||||||
| ratios | |||||||||||||||||||
| ROE | % | 0.933 | -17.2 | 8.31 | -45.4 | 17.0 | |||||||||||||
| ROA | % | 0.091 | -1.65 | 0.844 | -4.36 | 1.48 | |||||||||||||
| Costs (As % Of Assets) | % | 2.72 | 2.69 | 2.63 | 3.11 | 2.44 | |||||||||||||
| Costs (As % Of Income) | % | 47.3 | 48.5 | 46.0 | 58.9 | 49.2 | |||||||||||||
| Capital Adequacy Ratio | % | 13.3 | 13.6 | 18.9 | 18.9 | 19.9 | |||||||||||||
| Net Interest Margin | % | 4.17 | 3.86 | 3.96 | 3.57 | 3.21 | |||||||||||||
| Interest Income (As % Of Revenues) | % | 72.5 | 69.7 | 69.4 | 67.5 | 64.8 | |||||||||||||
| Fee Income (As % Of Revenues) | % | 13.4 | 15.3 | 18.7 | 21.0 | 23.6 | |||||||||||||
| Staff Cost (As % Of Total Cost) | % | 43.0 | 43.3 | 41.4 | 33.0 | 47.4 | |||||||||||||
| Equity (As % Of Assets) | % | 9.83 | 9.28 | 11.1 | 7.97 | 9.42 | |||||||||||||
| Loans (As % Of Deposits) | % | 121 | 118 | 101 | 81.6 | 76.1 | |||||||||||||
| Loans (As % Assets) | % | 62.3 | 61.2 | 57.0 | 52.8 | 52.0 | |||||||||||||
| NPLs (As % Of Loans) | % | ... | ... | ... | ... | ... | ... | 21.5 | 27.7 | 30.6 | 24.7 | 18.9 | |||||||
| Provisions (As % Of NPLs) | % | ... | ... | ... | ... | ... | ... | 48.6 | 56.7 | 63.3 | 78.9 | 82.5 | |||||||
| valuation | |||||||||||||||||||
| Book Value Per Share Growth | % | ... | -16.5 | -7.45 | -4.24 | -17.5 | -13.0 |
| income statement | Unit | 2000 | 2001 | 2002 | 2003 | 2004 | 2005 | 2006 | 2007 | 2008 | 2009 | 2010 | 2011 | 2012 | 2013 | 2014 | 2015 | 2016 | 2017 |
| income statement | |||||||||||||||||||
| Interest Income | RON mil | 6,160 | 5,530 | 4,612 | 3,536 | 2,761 | |||||||||||||
| Interest Cost | RON mil | 3,028 | 2,631 | 1,837 | 1,247 | 768 | |||||||||||||
| Net Interest Income | RON mil | 3,132 | 2,898 | 2,776 | 2,289 | 1,993 | |||||||||||||
| Net Fee Income | RON mil | 580 | 635 | 748 | 711 | 725 | |||||||||||||
| Other Income | RON mil | 606 | 622 | 477 | 389 | 357 | |||||||||||||
| Total Revenues | RON mil | 4,318 | 4,155 | 4,001 | 3,389 | 3,075 | |||||||||||||
| Staff Cost | RON mil | 879 | 872 | 761 | 658 | 717 | |||||||||||||
| Depreciation | RON mil | 253 | 212 | 219 | 176 | 172 | |||||||||||||
| Other Cost | RON mil | 911 | 931 | 860 | 1,161 | 625 | |||||||||||||
| Operating Cost | RON mil | 2,043 | 2,015 | 1,840 | 1,995 | 1,513 | |||||||||||||
| Operating Profit | RON mil | 2,274 | 2,140 | 2,160 | 1,394 | 1,562 | |||||||||||||
| Provisions | RON mil | 2,155 | 3,626 | 2,093 | 4,432 | 77.9 | |||||||||||||
| Extra and Other Cost | RON mil | 0 | 0 | < -0.001 | 0 | 472 | |||||||||||||
| Pre-Tax Profit | RON mil | 120 | -1,486 | 66.8 | -3,038 | 1,012 | |||||||||||||
| Tax | RON mil | 48.7 | -256 | -532 | -244 | 90.0 | |||||||||||||
| Minorities | RON mil | 2.57 | 5.07 | 7.52 | 5.85 | 3.10 | |||||||||||||
| Net Profit | RON mil | 68.4 | -1,235 | 591 | -2,800 | 919 | |||||||||||||
| growth rates | |||||||||||||||||||
| Net Interest Income Growth | % | ... | -16.5 | -7.45 | -4.24 | -17.5 | -13.0 | ||||||||||||
| Net Fee Income Growth | % | ... | 24.9 | 9.43 | 17.9 | -4.94 | 1.96 | ||||||||||||
| Total Revenue Growth | % | ... | -6.17 | -3.76 | -3.72 | -15.3 | -9.28 | ||||||||||||
| Operating Cost Growth | % | ... | 4.14 | -1.37 | -8.69 | 8.42 | -24.2 | ||||||||||||
| Operating Profit Growth | % | ... | -13.8 | -5.91 | 0.949 | -35.5 | 12.0 | ||||||||||||
| Pre-Tax Profit Growth | % | ... | -81.4 | -1,342 | -104 | -4,650 | -133 | ||||||||||||
| Net Profit Growth | % | ... | -85.3 | -1,906 | -148 | -574 | -133 | ||||||||||||
| market share | |||||||||||||||||||
| Market Share in Revenues | % | ... | 18.9 | ... | ... | ... | ... | ... | ... | ||||||||||
| Market Share in Net Profit | % | ... | ... | ... | ... | ... | ... | ... | ... | ... | |||||||||
| Market Share in Employees | % | ... | ... | ... | ... | 14.1 | 13.0 | 11.9 | 12.2 | 12.6 |
| balance sheet | Unit | 2000 | 2001 | 2002 | 2003 | 2004 | 2005 | 2006 | 2007 | 2008 | 2009 | 2010 | 2011 | 2012 | 2013 | 2014 | 2015 | 2016 | 2017 |
| balance sheet | |||||||||||||||||||
| Cash | RON mil | 10,325 | 9,187 | 9,586 | 8,235 | 9,442 | |||||||||||||
| Interbank Loans | RON mil | 1,100 | 361 | 508 | 525 | 204 | |||||||||||||
| Customer Loans | RON mil | 47,804 | 44,862 | 38,002 | 32,566 | 32,451 | |||||||||||||
| Retail Loans | RON mil | ... | ... | 23,545 | 20,908 | 20,022 | 19,784 | 19,387 | |||||||||||
| Corporate Loans | RON mil | ... | ... | ... | ... | ... | ... | 24,731 | 26,722 | 21,141 | 15,318 | 14,028 | |||||||
| Debt Securities | RON mil | 14,299 | 16,035 | 10,495 | 17,964 | 17,358 | |||||||||||||
| Fixed Assets | RON mil | 2,025 | 1,918 | 1,889 | 1,275 | 1,333 | |||||||||||||
| Total Assets | RON mil | 76,746 | 73,288 | 66,729 | 61,625 | 62,360 | |||||||||||||
| Shareholders' Equity | RON mil | 7,546 | 6,803 | 7,423 | 4,910 | 5,875 | |||||||||||||
| Of Which Minority Interest | RON mil | 26.5 | 19.3 | 28.0 | 35.1 | 31.3 | |||||||||||||
| Liabilities | RON mil | 69,199 | 66,485 | 59,306 | 56,715 | 56,485 | |||||||||||||
| Interbank Borrowing | RON mil | 22,906 | 24,046 | 18,152 | 14,191 | 11,247 | |||||||||||||
| Customer Deposits | RON mil | 39,664 | 37,893 | 37,448 | 39,923 | 42,626 | |||||||||||||
| Retail Deposits | RON mil | ... | ... | 29,967 | 29,971 | 25,451 | 26,014 | 27,539 | |||||||||||
| Corporate Deposits | RON mil | ... | ... | 9,697 | 7,904 | 9,053 | 11,100 | 12,572 | |||||||||||
| Issued Debt Securities | RON mil | 3,158 | 3,120 | 2,617 | 1,598 | 1,438 | |||||||||||||
| Other Liabilities | RON mil | 3,471 | 1,427 | 1,088 | 1,003 | 1,173 | |||||||||||||
| asset quality | |||||||||||||||||||
| Non-Performing Loans | RON mil | ... | ... | ... | ... | ... | ... | 11,455 | 14,728 | 14,392 | 9,970 | 7,262 | |||||||
| Gross Loans | RON mil | 53,376 | 53,213 | 47,108 | 40,433 | 38,442 | |||||||||||||
| Total Provisions | RON mil | 5,573 | 8,351 | 9,105 | 7,867 | 5,991 | |||||||||||||
| growth rates | |||||||||||||||||||
| Customer Loan Growth | % | ... | 0.865 | -6.15 | -15.3 | -14.3 | -0.354 | ||||||||||||
| Retail Loan Growth | % | ... | ... | ... | 4.12 | -11.2 | -4.24 | -1.19 | -2.01 | ||||||||||
| Corporate Loan Growth | % | ... | ... | ... | ... | ... | ... | ... | 8.14 | 8.05 | -20.9 | -27.5 | -8.42 | ||||||
| Total Asset Growth | % | ... | 4.26 | -4.51 | -8.95 | -7.65 | 1.19 | ||||||||||||
| Shareholders' Equity Growth | % | ... | 6.23 | -9.86 | 9.12 | -33.9 | 19.7 | ||||||||||||
| Customer Deposit Growth | % | ... | 4.86 | -4.47 | -1.17 | 6.61 | 6.77 | ||||||||||||
| Retail Deposit Growth | % | ... | ... | ... | 7.30 | 0.012 | -15.1 | 2.21 | 5.86 | ||||||||||
| Corporate Deposit Growth | % | ... | ... | ... | -2.04 | -18.5 | 14.5 | 22.6 | 13.3 | ||||||||||
| market share | |||||||||||||||||||
| Market Share in Customer Loans | % | 21.4 | 19.9 | 17.4 | 15.4 | 14.9 | |||||||||||||
| Market Share in Corporate Loans | % | ... | ... | ... | ... | ... | ... | 21.4 | 22.5 | 18.8 | 14.5 | 13.4 | |||||||
| Market Share in Consumer Loans | % | ... | ... | 22.6 | 20.0 | 19.4 | 19.4 | 18.0 | |||||||||||
| Market Share in Total Assets | % | 21.7 | 20.0 | 18.4 | 16.9 | 16.5 | |||||||||||||
| Market Share in Customer Deposits | % | 21.2 | 19.2 | 17.4 | 17.1 | 16.8 | |||||||||||||
| Market Share in Retail Deposits | % | ... | ... | 26.6 | 24.5 | 19.6 | 18.8 | 18.8 | |||||||||||
| Market Share in Corporate Deposits | % | ... | ... | 15.5 | 12.9 | 12.8 | 13.8 | 13.8 |
| ratios | Unit | 2000 | 2001 | 2002 | 2003 | 2004 | 2005 | 2006 | 2007 | 2008 | 2009 | 2010 | 2011 | 2012 | 2013 | 2014 | 2015 | 2016 | 2017 |
| ratios | |||||||||||||||||||
| ROE | % | 0.933 | -17.2 | 8.31 | -45.4 | 17.0 | |||||||||||||
| ROA | % | 0.091 | -1.65 | 0.844 | -4.36 | 1.48 | |||||||||||||
| Costs (As % Of Assets) | % | 2.72 | 2.69 | 2.63 | 3.11 | 2.44 | |||||||||||||
| Costs (As % Of Income) | % | 47.3 | 48.5 | 46.0 | 58.9 | 49.2 | |||||||||||||
| Capital Adequacy Ratio | % | 13.3 | 13.6 | 18.9 | 18.9 | 19.9 | |||||||||||||
| Net Interest Margin | % | 4.17 | 3.86 | 3.96 | 3.57 | 3.21 | |||||||||||||
| Interest Spread | % | ... | 3.73 | 3.49 | 3.67 | 3.36 | 3.10 | ||||||||||||
| Asset Yield | % | 8.19 | 7.37 | 6.59 | 5.51 | 4.45 | |||||||||||||
| Cost Of Liabilities | % | ... | 4.46 | 3.88 | 2.92 | 2.15 | 1.36 | ||||||||||||
| Interest Income (As % Of Revenues) | % | 72.5 | 69.7 | 69.4 | 67.5 | 64.8 | |||||||||||||
| Fee Income (As % Of Revenues) | % | 13.4 | 15.3 | 18.7 | 21.0 | 23.6 | |||||||||||||
| Other Income (As % Of Revenues) | % | 14.0 | 15.0 | 11.9 | 11.5 | 11.6 | |||||||||||||
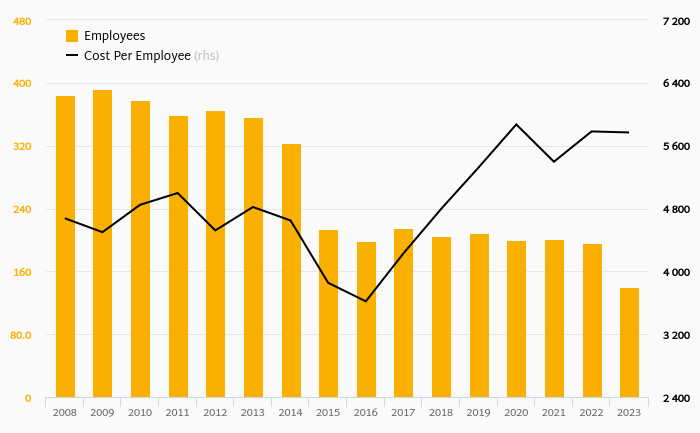
| Cost Per Employee | USD per month | ... | ... | ... | ... | 2,599 | 2,610 | 2,730 | 2,240 | 2,153 | |||||||||
| Cost Per Employee (Local Currency) | RON per month | ... | ... | ... | ... | 7,926 | 9,056 | 9,084 | 7,779 | 8,454 | |||||||||
| Staff Cost (As % Of Total Cost) | % | 43.0 | 43.3 | 41.4 | 33.0 | 47.4 | |||||||||||||
| Equity (As % Of Assets) | % | 9.83 | 9.28 | 11.1 | 7.97 | 9.42 | |||||||||||||
| Loans (As % Of Deposits) | % | 121 | 118 | 101 | 81.6 | 76.1 | |||||||||||||
| Loans (As % Assets) | % | 62.3 | 61.2 | 57.0 | 52.8 | 52.0 | |||||||||||||
| NPLs (As % Of Loans) | % | ... | ... | ... | ... | ... | ... | 21.5 | 27.7 | 30.6 | 24.7 | 18.9 | |||||||
| Provisions (As % Of NPLs) | % | ... | ... | ... | ... | ... | ... | 48.6 | 56.7 | 63.3 | 78.9 | 82.5 | |||||||
| Provisions (As % Of Loans) | % | 11.7 | 18.6 | 24.0 | 24.2 | 18.5 | |||||||||||||
| Cost of Provisions (As % Of Loans) | % | 4.53 | 7.83 | 5.05 | 12.6 | 0.240 |
| other data | Unit | 2000 | 2001 | 2002 | 2003 | 2004 | 2005 | 2006 | 2007 | 2008 | 2009 | 2010 | 2011 | 2012 | 2013 | 2014 | 2015 | 2016 | 2017 |
| other data | |||||||||||||||||||
| Employees | ... | ... | ... | ... | 9,245 | 8,026 | 6,984 | 7,054 | 7,065 |
Get all company financials in excel:


By Helgi Library - July 16, 2018
Banca Commerciala Romana's retail deposits reached RON 31,400 mil in 2017, up 4.95% compared to the previous year. Romanian banking sector accepted retail deposits of RON 178 bil in 2017, up 9.10% when compared to the last year. Banca Commerciala Romana a...
By Helgi Library - December 12, 2019
Banca Commerciala Romana's corporate loans reached RON 12,395 mil in 2017, up 2.42% compared to the previous year. Romanian banking sector provided corporate loans of RON 104 bil in 2017, up 2.46% when compared to the last year. Banca Commerciala Romana a...
By Helgi Library - May 28, 2018
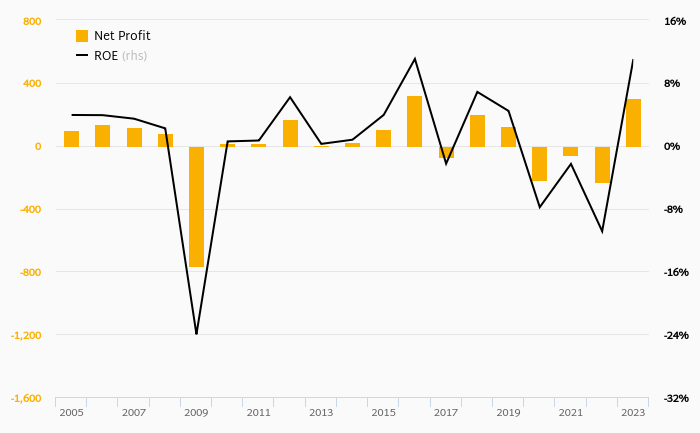
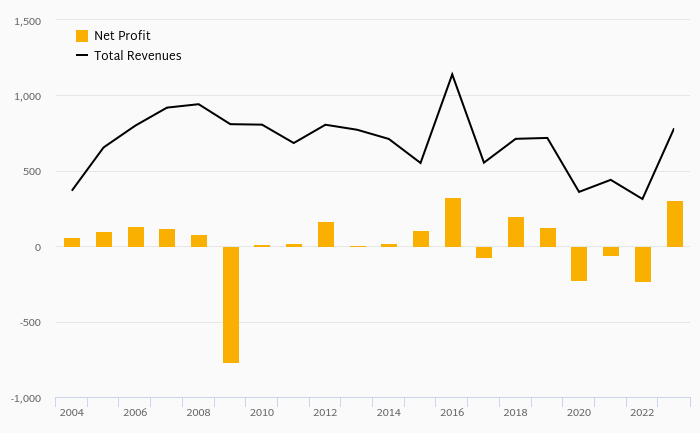
Banca Commerciala Romana made a net profit of RON 668 mil under revenues of RON 2,888 mil in 2017, up -35.9% and 0.687% respectively compared to the previous year. Historically, the bank’s net profit reached an all time high of RON 2,033 mil in 2008 and an all time low o...
By Helgi Library - May 28, 2018
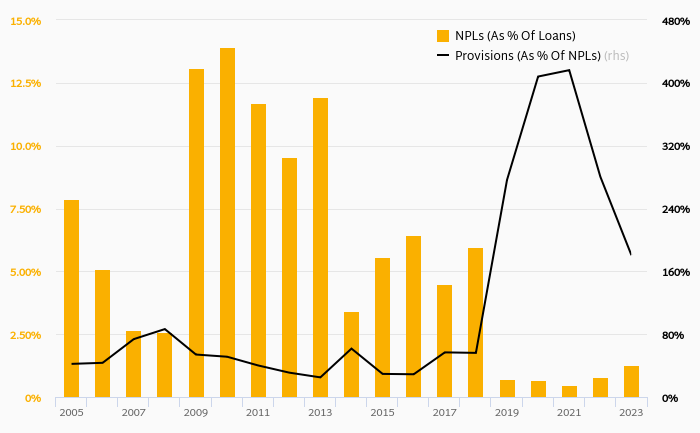
Banca Commerciala Romana's non-performing loans reached 9.38% of total loans at the end of 2017, down from 12.8% compared to the previous year. Historically, the NPL ratio hit an all time high of 30.6% in 2013 and an all time low of 2.88% in 2007. Provision...
By Helgi Library - July 16, 2018
Banca Commerciala Romana's customer loans reached RON 33,491 mil in 2017, up 3.72% compared to the previous year. Romanian banking sector provided customer loans of RON 233 bil in 2017, up 5.70% when compared to the last year. Banca Commerciala Romana acc...
By Helgi Library - May 28, 2018
Banca Commerciala Romana generated total banking revenues of RON 2,888 mil in 2017, up 0.687% compared to the previous year. Historically, the bank’s revenues containing of interest, fee and other non-interest income reached an all time high of RON 5,237 mil in...
By Helgi Library - May 28, 2018
Banca Commerciala Romana's customer loan growth reached 3.72% in 2017, up from -0.492% compared to the previous year. Historically, the bank’s loans growth reached an all time high of 73.5% in 2002 and an all time low of -15.3% in 2013. In the last decade...
By Helgi Library - May 28, 2018
Banca Commerciala Romana generated total banking revenues of RON 4,318 mil in 2011, down 6.17% compared to the previous year. Romanian banking sector banking sector generated total revenues of RON 22,898 mil in 2011, down 4.28% when compared to the la...
Banca Comercială Română (BCR) is a Romania-based universal bank. The Bank offers a wide range of banking and other financial services to commercial and private banking clients. Its products include loans, current and saving accounts, and deposits amongst others. The Bank is the largest bank in Romania with 16% market share in terms of assets. At the end of 2013, the Bank operated a network of 600 branches and 2,100 ATMs and employed over 7,000 persons. Since 2006, BCR is a member of Erste Bank Group. With 16 million clients, 2,900 branches and 46,000 employees, Erste Group is today one of the largest financial services providers in the Eastern part of EU in terms of clients and total assets.

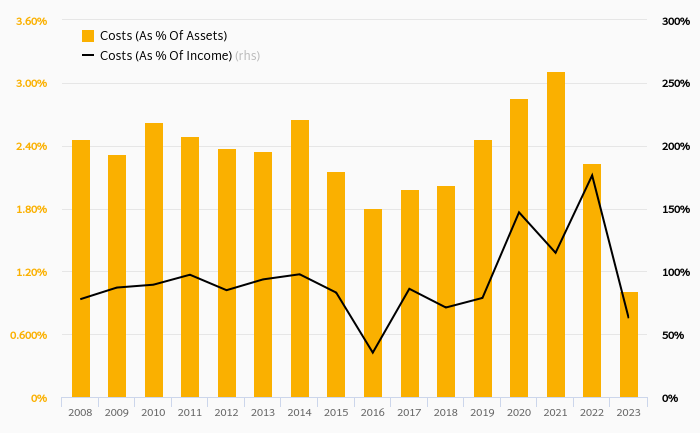
Banca Commerciala Romana has been growing its revenues and asset by -0.790% and 1.14% a year on average in the last 10 years. Its loans and deposits have grown by -1.13% and 5.71% a year during that time and loans to deposits ratio reached 63.8% at the end of 2017. The company achieved an average return on equity of 4.60% in the last decade with net profit growing -3.20% a year on average. In terms of operating efficiency, its cost to income ratio reached 53.5% in 2017, compared to 48.2% average in the last decade.
Equity represented 10.5% of total assets or 22.2% of loans at the end of 2017. Banca Commerciala Romana's non-performing loans were 9.38% of total loans while provisions covered some 80.3% of NPLs at the end of 2017.
 Helgi Library