By Helgi Library - October 11, 2019
Bank of Communications made a net profit of CNY 21,678 mil under revenues of CNY 56,651 mil in the second quarter of 2019, up 4.83% a...
By Helgi Library - October 11, 2019
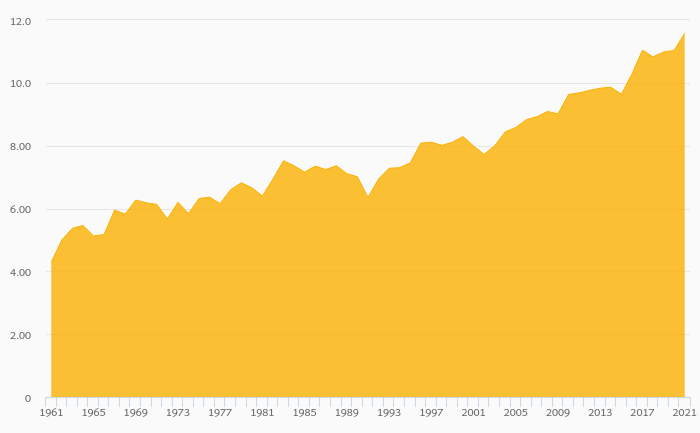
Bank of Communications's customer deposits reached CNY 5,047,500 mil in 2016-12-31, up 1.75% compared to the previous year. Chi...
By Helgi Library - October 11, 2019
Bank of Communications's loans reached CNY 5,130,600 mil in the second quarter of 2019, up from CNY 5,068,200 mil when compa...
| Profit Statement | 2016 | 2017 | 2018 | |
| Net Interest Income | CNY mil | 134,871 | 124,873 | 130,908 |
| Net Fee Income | CNY mil | 36,795 | 40,551 | 41,237 |
| Other Income | CNY mil | 23,766 | 33,417 | 43,987 |
| Total Revenues | CNY mil | 195,432 | 198,841 | 216,132 |
| Operating Profit | CNY mil | 116,807 | 116,381 | 132,718 |
| Provisions | CNY mil | 28,480 | 30,161 | 43,514 |
| Net Profit | CNY mil | 67,210 | 70,223 | 73,630 |
| Balance Sheet | 2016 | 2017 | 2018 | |
| Interbank Loans | CNY mil | 715,787 | 782,468 | 848,067 |
| Customer Loans | CNY mil | 4,009,000 | 4,354,500 | 4,742,400 |
| Total Assets | CNY mil | 8,403,200 | 9,038,300 | 9,531,200 |
| Shareholders' Equity | CNY mil | 632,407 | 676,271 | 705,308 |
| Interbank Borrowing | CNY mil | 2,231,100 | 2,402,800 | 2,173,700 |
| Customer Deposits | CNY mil | 5,047,500 | 5,419,300 | 6,160,100 |
| Issued Debt Securities | CNY mil | 229,515 | 267,585 | 317,688 |
| Ratios | 2016 | 2017 | 2018 | |
| ROE | % | 11.5 | 10.7 | 10.7 |
| ROA | % | 0.864 | 0.805 | 0.793 |
| Costs (As % Of Assets) | % | 1.01 | 0.946 | 0.898 |
| Costs (As % Of Income) | % | 40.2 | 41.5 | 38.6 |
| Capital Adequacy Ratio | % | 14.0 | 14.0 | 14.4 |
| Net Interest Margin | % | 1.73 | 1.43 | 1.41 |
| Loans (As % Of Deposits) | % | 79.4 | 80.4 | 77.0 |
| NPLs (As % Of Loans) | % | 1.54 | 1.52 | 1.51 |
| Provisions (As % Of NPLs) | % | 148 | 151 | 153 |
| Valuation | 2016 | 2017 | 2018 | |
| Price/Earnings (P/E) | 6.68 | 7.06 | 6.16 | |
| Price/Book Value (P/BV) | 0.710 | 0.733 | 0.643 | |
| Earnings Per Share (EPS) | CNY | 0.905 | 0.946 | 0.991 |
| Book Value Per Share | CNY | 8.52 | 9.11 | 9.50 |
Get all company financials in excel:
| summary | Unit | 2002 | 2003 | 2004 | 2005 | 2006 | 2007 | 2008 | 2009 | 2010 | 2011 | 2012 | 2013 | 2014 | 2015 | 2016 | 2017 | 2018 |
| income statement | ||||||||||||||||||
| Net Interest Income | CNY mil | 120,206 | 130,761 | 134,854 | 144,172 | 134,871 | ||||||||||||
| Total Revenues | CNY mil | 150,945 | 168,289 | 179,772 | 196,346 | 195,432 | ||||||||||||
| Operating Profit | CNY mil | 92,880 | 101,655 | 108,504 | 116,070 | 116,807 | ||||||||||||
| Net Profit | CNY mil | 58,369 | 62,295 | 65,850 | 66,528 | 67,210 | ||||||||||||
| balance sheet | ||||||||||||||||||
| Interbank Loans | CNY mil | 520,963 | 566,429 | 525,033 | 611,191 | 715,787 | ||||||||||||
| Customer Loans | CNY mil | 2,879,600 | 3,193,100 | 3,354,800 | 3,634,600 | 4,009,000 | ||||||||||||
| Debt Securities | CNY mil | 879,483 | 1,070,900 | 1,170,200 | 1,666,700 | 2,323,200 | ||||||||||||
| Total Assets | CNY mil | 5,273,400 | 5,960,900 | 6,268,300 | 7,155,400 | 8,403,200 | ||||||||||||
| Shareholders' Equity | CNY mil | 381,447 | 421,484 | 473,605 | 538,092 | 632,407 | ||||||||||||
| Interbank Borrowing | CNY mil | 945,422 | 1,127,700 | 1,413,600 | 1,658,700 | 2,231,100 | ||||||||||||
| Customer Deposits | CNY mil | 3,728,400 | 4,182,500 | 4,068,300 | 4,574,100 | 5,047,500 | ||||||||||||
| Issued Debt Securities | CNY mil | 79,572 | 82,238 | 129,547 | 170,106 | 229,515 | ||||||||||||
| ratios | ||||||||||||||||||
| ROE | % | 17.8 | 15.5 | 14.7 | 13.2 | 11.5 | ||||||||||||
| ROA | % | 1.18 | 1.11 | 1.08 | 0.991 | 0.864 | ||||||||||||
| Costs (As % Of Assets) | % | 1.17 | 1.19 | 1.17 | 1.20 | 1.01 | ||||||||||||
| Costs (As % Of Income) | % | 38.5 | 39.6 | 39.6 | 40.9 | 40.2 | ||||||||||||
| Capital Adequacy Ratio | % | ... | ... | 14.1 | 12.1 | 14.0 | 13.5 | 14.0 | ||||||||||
| Net Interest Margin | % | 2.43 | 2.33 | 2.21 | 2.15 | 1.73 | ||||||||||||
| Interest Income (As % Of Revenues) | % | 79.6 | 77.7 | 75.0 | 73.4 | 69.0 | ||||||||||||
| Fee Income (As % Of Revenues) | % | 13.8 | 15.4 | 16.5 | 17.8 | 18.8 | ||||||||||||
| Equity (As % Of Assets) | % | 7.23 | 7.07 | 7.56 | 7.52 | 7.53 | ||||||||||||
| Loans (As % Of Deposits) | % | 77.2 | 76.3 | 82.5 | 79.5 | 79.4 | ||||||||||||
| Loans (As % Assets) | % | 54.6 | 53.6 | 53.5 | 50.8 | 47.7 | ||||||||||||
| NPLs (As % Of Loans) | % | ... | ... | ... | 1.03 | 1.13 | 1.47 | 2.42 | 1.54 | |||||||||
| Provisions (As % Of NPLs) | % | ... | ... | ... | 224 | 199 | 153 | 97.3 | 148 | |||||||||
| valuation | ||||||||||||||||||
| Market Capitalisation (End Of Period) | USD mil | ... | ... | ... | 46,238 | 38,718 | 60,593 | 53,261 | 51,879 | |||||||||
| Number Of Shares (Average) | mil | 74,263 | 74,263 | 74,263 | 74,263 | 74,263 | ||||||||||||
| Share Price (End Of Period) | HKD | ... | ... | ... | 4.83 | 4.04 | 6.33 | 5.56 | 5.42 | |||||||||
| Earnings Per Share (EPS) | CNY | 0.786 | 0.839 | 0.887 | 0.896 | 0.905 | ||||||||||||
| Book Value Per Share | CNY | 5.14 | 5.68 | 6.38 | 7.25 | 8.52 | ||||||||||||
| Price/Earnings (P/E) | ... | ... | ... | 7.64 | 6.17 | 8.92 | 7.41 | 6.68 | ||||||||||
| Price/Book Value (P/BV) | ... | ... | ... | 1.17 | 0.912 | 1.24 | 0.916 | 0.710 | ||||||||||
| Earnings Per Share Growth | % | ... | -4.13 | 6.73 | 5.71 | 1.03 | 1.03 | |||||||||||
| Book Value Per Share Growth | % | ... | 16.5 | 10.5 | 12.4 | 13.6 | 17.5 |
| income statement | Unit | 2002 | 2003 | 2004 | 2005 | 2006 | 2007 | 2008 | 2009 | 2010 | 2011 | 2012 | 2013 | 2014 | 2015 | 2016 | 2017 | 2018 |
| income statement | ||||||||||||||||||
| Interest Income | CNY mil | 240,676 | 259,395 | 288,587 | 305,126 | 289,844 | ||||||||||||
| Interest Cost | CNY mil | 120,470 | 128,634 | 153,733 | 160,954 | 154,973 | ||||||||||||
| Net Interest Income | CNY mil | 120,206 | 130,761 | 134,854 | 144,172 | 134,871 | ||||||||||||
| Net Fee Income | CNY mil | 20,882 | 25,968 | 29,604 | 35,027 | 36,795 | ||||||||||||
| Other Income | CNY mil | 9,857 | 11,560 | 15,314 | 17,147 | 23,766 | ||||||||||||
| Total Revenues | CNY mil | 150,945 | 168,289 | 179,772 | 196,346 | 195,432 | ||||||||||||
| Operating Cost | CNY mil | 58,065 | 66,634 | 71,268 | 80,276 | 78,625 | ||||||||||||
| Operating Profit | CNY mil | 92,880 | 101,655 | 108,504 | 116,070 | 116,807 | ||||||||||||
| Provisions | CNY mil | 14,537 | 18,410 | 20,439 | 27,160 | 28,480 | ||||||||||||
| Extra and Other Cost | CNY mil | 3,132 | 3,336 | 3,138 | 2,898 | 2,217 | ||||||||||||
| Pre-Tax Profit | CNY mil | 75,211 | 79,909 | 84,927 | 86,012 | 86,110 | ||||||||||||
| Tax | CNY mil | 16,739 | 17,448 | 18,892 | 19,181 | 18,459 | ||||||||||||
| Minorities | CNY mil | ... | 103 | 166 | 185 | 303 | 441 | |||||||||||
| Net Profit | CNY mil | 58,369 | 62,295 | 65,850 | 66,528 | 67,210 | ||||||||||||
| growth rates | ||||||||||||||||||
| Net Interest Income Growth | % | ... | 16.1 | 8.78 | 3.13 | 6.91 | -6.45 | |||||||||||
| Net Fee Income Growth | % | ... | 11.9 | 24.4 | 14.0 | 18.3 | 5.05 | |||||||||||
| Total Revenue Growth | % | ... | 15.7 | 11.5 | 6.82 | 9.22 | -0.466 | |||||||||||
| Operating Cost Growth | % | ... | 16.6 | 14.8 | 6.95 | 12.6 | -2.06 | |||||||||||
| Operating Profit Growth | % | ... | 15.2 | 9.45 | 6.74 | 6.97 | 0.635 | |||||||||||
| Pre-Tax Profit Growth | % | ... | 14.9 | 6.25 | 6.28 | 1.28 | 0.114 | |||||||||||
| Net Profit Growth | % | ... | 15.0 | 6.73 | 5.71 | 1.03 | 1.03 | |||||||||||
| market share | ||||||||||||||||||
| Market Share in Revenues | % | ... | ... | ... | ... | ... | ... | ... | ... | 4.77 | 4.70 | 4.28 | 4.22 | 4.16 | ... | |||
| Market Share in Net Profit | % | ... | ... | ... | ... | ... | 3.86 | ... | ... | ... | ... | ... | ... | |||||
| Market Share in Employees | % | ... | ... | ... | ... | ... | ... | ... | ... | ... | ... | ... | ... | ... | ... | ... | ... |
| balance sheet | Unit | 2002 | 2003 | 2004 | 2005 | 2006 | 2007 | 2008 | 2009 | 2010 | 2011 | 2012 | 2013 | 2014 | 2015 | 2016 | 2017 | 2018 |
| balance sheet | ||||||||||||||||||
| Cash | CNY mil | 816,846 | 896,556 | 938,055 | 920,228 | 991,435 | ||||||||||||
| Interbank Loans | CNY mil | 520,963 | 566,429 | 525,033 | 611,191 | 715,787 | ||||||||||||
| Customer Loans | CNY mil | 2,879,600 | 3,193,100 | 3,354,800 | 3,634,600 | 4,009,000 | ||||||||||||
| Retail Loans | CNY mil | ... | ... | 601,522 | 751,310 | 868,357 | 993,319 | 1,186,200 | ||||||||||
| Mortgage Loans | CNY mil | ... | ... | ... | ... | ... | ... | ... | 358,258 | 458,356 | 529,871 | 604,357 | 770,280 | |||||
| Consumer Loans | CNY mil | ... | ... | ... | ... | ... | ... | ... | 243,264 | 292,954 | 338,486 | 388,962 | 415,920 | |||||
| Corporate Loans | CNY mil | ... | ... | 2,345,800 | 2,515,100 | 2,563,400 | 2,728,700 | 2,916,800 | ||||||||||
| Debt Securities | CNY mil | 879,483 | 1,070,900 | 1,170,200 | 1,666,700 | 2,323,200 | ||||||||||||
| Fixed Assets | CNY mil | 46,125 | 57,870 | 70,685 | 91,293 | 115,441 | ||||||||||||
| Total Assets | CNY mil | 5,273,400 | 5,960,900 | 6,268,300 | 7,155,400 | 8,403,200 | ||||||||||||
| Shareholders' Equity | CNY mil | 381,447 | 421,484 | 473,605 | 538,092 | 632,407 | ||||||||||||
| Of Which Minority Interest | CNY mil | 1,529 | 1,923 | 2,550 | 3,207 | 3,265 | ||||||||||||
| Liabilities | CNY mil | 4,891,950 | 5,539,420 | 5,794,700 | 6,617,310 | 7,770,790 | ||||||||||||
| Interbank Borrowing | CNY mil | 945,422 | 1,127,700 | 1,413,600 | 1,658,700 | 2,231,100 | ||||||||||||
| Customer Deposits | CNY mil | 3,728,400 | 4,182,500 | 4,068,300 | 4,574,100 | 5,047,500 | ||||||||||||
| Sight Deposits | CNY mil | 1,698,600 | 1,874,300 | 1,937,800 | 2,028,500 | 2,448,200 | ||||||||||||
| Term Deposits | CNY mil | 2,029,800 | 2,308,200 | 2,130,500 | 2,545,600 | 2,599,300 | ||||||||||||
| Issued Debt Securities | CNY mil | 79,572 | 82,238 | 129,547 | 170,106 | 229,515 | ||||||||||||
| Other Liabilities | CNY mil | 138,559 | 146,978 | 183,248 | 214,402 | 262,678 | ||||||||||||
| asset quality | ||||||||||||||||||
| Non-Performing Loans | CNY mil | ... | ... | ... | 30,228 | 36,757 | 50,282 | 89,900 | 63,292 | |||||||||
| Gross Loans | CNY mil | 2,947,300 | 3,266,400 | 3,431,700 | 3,722,000 | 4,103,000 | ||||||||||||
| Total Provisions | CNY mil | 67,671 | 73,305 | 76,948 | 87,438 | 93,913 | ||||||||||||
| growth rates | ||||||||||||||||||
| Customer Loan Growth | % | ... | 14.9 | 10.9 | 5.06 | 8.34 | 10.3 | |||||||||||
| Retail Loan Growth | % | ... | ... | ... | 18.1 | 24.9 | 15.6 | 14.4 | 19.4 | |||||||||
| Mortgage Loan Growth | % | ... | ... | ... | ... | ... | ... | ... | ... | 14.5 | 27.9 | 15.6 | 14.1 | 27.5 | ||||
| Consumer Loan Growth | % | ... | ... | ... | ... | ... | ... | ... | ... | 23.9 | 20.4 | 15.5 | 14.9 | 6.93 | ||||
| Corporate Loan Growth | % | ... | ... | ... | 14.3 | 7.22 | 1.92 | 6.45 | 6.89 | |||||||||
| Total Asset Growth | % | ... | 14.4 | 13.0 | 5.16 | 14.2 | 17.4 | |||||||||||
| Shareholders' Equity Growth | % | ... | 39.8 | 10.5 | 12.4 | 13.6 | 17.5 | |||||||||||
| Customer Deposit Growth | % | ... | 13.6 | 12.2 | -2.73 | 12.4 | 10.3 | |||||||||||
| market share | ||||||||||||||||||
| Market Share in Customer Loans | % | ... | 4.28 | 4.01 | 3.72 | 3.46 | 3.44 | |||||||||||
| Market Share in Total Assets | % | ... | 3.95 | 3.91 | 3.64 | 3.59 | 3.65 | |||||||||||
| Market Share in Customer Deposits | % | ... | 3.95 | 10.0 | 8.99 | 8.03 | 7.11 |
| ratios | Unit | 2002 | 2003 | 2004 | 2005 | 2006 | 2007 | 2008 | 2009 | 2010 | 2011 | 2012 | 2013 | 2014 | 2015 | 2016 | 2017 | 2018 |
| ratios | ||||||||||||||||||
| ROE | % | 17.8 | 15.5 | 14.7 | 13.2 | 11.5 | ||||||||||||
| ROA | % | 1.18 | 1.11 | 1.08 | 0.991 | 0.864 | ||||||||||||
| Costs (As % Of Assets) | % | 1.17 | 1.19 | 1.17 | 1.20 | 1.01 | ||||||||||||
| Costs (As % Of Income) | % | 38.5 | 39.6 | 39.6 | 40.9 | 40.2 | ||||||||||||
| Capital Adequacy Ratio | % | ... | ... | 14.1 | 12.1 | 14.0 | 13.5 | 14.0 | ||||||||||
| Tier 1 Ratio | % | ... | ... | ... | ... | ... | 11.2 | 9.76 | 11.3 | 11.5 | 12.2 | |||||||
| Net Interest Margin | % | 2.43 | 2.33 | 2.21 | 2.15 | 1.73 | ||||||||||||
| Interest Spread | % | ... | 2.26 | 2.15 | 2.01 | 1.95 | 1.57 | |||||||||||
| Asset Yield | % | 4.87 | 4.62 | 4.72 | 4.55 | 3.73 | ||||||||||||
| Cost Of Liabilities | % | ... | 2.61 | 2.47 | 2.71 | 2.59 | 2.15 | |||||||||||
| Interest Income (As % Of Revenues) | % | 79.6 | 77.7 | 75.0 | 73.4 | 69.0 | ||||||||||||
| Fee Income (As % Of Revenues) | % | 13.8 | 15.4 | 16.5 | 17.8 | 18.8 | ||||||||||||
| Other Income (As % Of Revenues) | % | 6.53 | 6.87 | 8.52 | 8.73 | 12.2 | ||||||||||||
| Equity (As % Of Assets) | % | 7.23 | 7.07 | 7.56 | 7.52 | 7.53 | ||||||||||||
| Loans (As % Of Deposits) | % | 77.2 | 76.3 | 82.5 | 79.5 | 79.4 | ||||||||||||
| Loans (As % Assets) | % | 54.6 | 53.6 | 53.5 | 50.8 | 47.7 | ||||||||||||
| NPLs (As % Of Loans) | % | ... | ... | ... | 1.03 | 1.13 | 1.47 | 2.42 | 1.54 | |||||||||
| Provisions (As % Of NPLs) | % | ... | ... | ... | 224 | 199 | 153 | 97.3 | 148 | |||||||||
| Provisions (As % Of Loans) | % | 2.35 | 2.30 | 2.29 | 2.41 | 2.34 | ||||||||||||
| Cost of Provisions (As % Of Loans) | % | 0.540 | 0.606 | 0.624 | 0.777 | 0.745 |
| other data | Unit | 2002 | 2003 | 2004 | 2005 | 2006 | 2007 | 2008 | 2009 | 2010 | 2011 | 2012 | 2013 | 2014 | 2015 | 2016 | 2017 | 2018 |
| other data | ||||||||||||||||||
| Employees | 96,259 | 99,919 | 93,658 | 91,468 | 92,556 | |||||||||||||
| Sight (As % Of Customer Deposits) | % | 45.6 | 44.8 | 47.6 | 44.3 | 48.5 | ||||||||||||
| On-balance Sheet Loans | RMB mil | ... | ... | ... | ... | ... | ... | ... | ... | ... | ... | ... | 3,193,100 | 3,354,800 | 3,634,600 | 4,009,000 |
Get all company financials in excel:


By Helgi Library - October 11, 2019
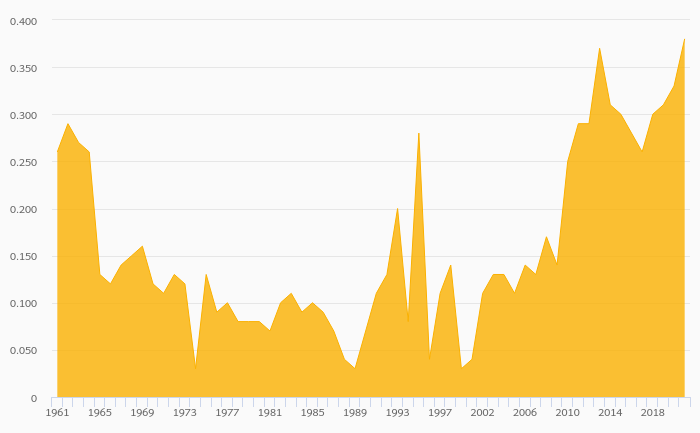
Bank of Communications's non-performing loans reached 1.49% of total loans at the end of 2019-06-30, down from 1.51% compared to the previous year. Historically, the NPL ratio hit an all time high of 2.42% in 2015-12-31 and an all time low of 0.941% in 2011-09-30...
By Helgi Library - October 11, 2019
Bank of Communications's net interest margin amounted to 1.43% in the second quarter of 2019, down from 1.44% when compared to the previous quarter. Historically, the bank’s net interest margin reached an all time high of 5.09% in 4Q2015 and an all time low ...
By Helgi Library - October 11, 2019
Bank of Communications stock traded at HKD 5.28 per share at the end second quarter of 2019 implying a market capitalization of USD 49,570 mil. Since the end of 2Q2014, the stock has appreciated by 23.4 % implying an annual average growth of 4.29 %. In absolute terms,...
By Helgi Library - October 23, 2019
Bank of Communications stock traded at HKD 5.28 per share at the end of second quarter of 2019 implying a market capitalization of USD 49,570 mil. Over the last five years, the stock has appreciated by 23.4 implying an annual average growth of 4.29% In ab...
By Helgi Library - October 11, 2019
Bank of Communications's capital adequacy ratio reached 13.8% at the end of second quarter of 2019, down from 14.2% when compared to the previous quarter. Historically, the bank’s capital ratio hit an all time high of 14.5% in 3Q2012 and an all time low of 12.1% in...
By Helgi Library - October 11, 2019
Bank of Communications's retail loans reached CNY 1,654,200 mil at the end of 2019-06-30, up 1.24% compared to the previous year. In the last decade, the average annual loan growth amounted to 0%. Overall, retail loans accounted for 33.0% of the bank's loan...
By Helgi Library - October 11, 2019
Bank of Communications stock traded at HKD 5.28 per share at the end of second quarter of 2019 implying a market capitalization of USD 49,570 mil. Over the last five years, the stock has appreciated by 23.4 % implying an annual average growth of 4.29 %. In absolute te...
By Helgi Library - October 11, 2019
Bank of Communications generated total banking revenues of CNY 56,651 mil in the second quarter of 2019, up 9.07% when compared to the same period of last year and down 10% when compared to the previous quarter. Historically, the bank’s revenues c...
By Helgi Library - October 11, 2019
Bank of Communications's Equity reached 4.91% of total assets in the 2Q2019, up from 4.86% for the previous year. As a share of net customer loans, the ratio amounted to 10.9% at the end of the second quarter of 2019. ...
By Helgi Library - October 11, 2019
Bank of Communications's customer loan growth reached 7.38% in 2019-06-30, down from 9.34% compared to the previous year. Historically, the bank’s loans growth reached an all time high of 21.6% in 2010-12-31 and an all time low of 4.68% in 2014-03-31. In ...

Bank of Communications has been growing its revenues and asset by 10.7% and 14.1% a year on average in the last 10 years. Its loans and deposits have grown by 13.8% and 12.7% a year during that time and loans to deposits ratio reached 77.0% at the end of 2018. The company achieved an average return on equity of 15.4% in the last decade with net profit growing 9.95% a year on average. In terms of operating efficiency, its cost to income ratio reached 38.6% in 2018, compared to 39.5% average in the last decade.
Equity represented 7.40% of total assets or 14.9% of loans at the end of 2018. Bank of Communications's non-performing loans were 1.51% of total loans while provisions covered some 153% of NPLs at the end of 2018.
Bank of Communications stock traded at HKD 5.37 per share at the end of 2018 resulting in a market capitalization of USD 50,893 mil. Over the previous five years, stock price rose by 32.7% or 5.83% a year on average. That’s compared to an average ROE of 12.1% the bank generated for its shareholders. This closing price put stock at a 12-month trailing price to earnings (PE) of 6.16x and price to book value (PBV) of 0.643x in 2018.
 Helgi Library