By Helgi Library - October 11, 2019
China Minsheng Banking's capital adequacy ratio reached 12.8% at the end of second quarter of 2019, up from 12.3% when compared t...
By Helgi Library - October 11, 2019
China Minsheng Banking's non-performing loans reached 2.08% of total loans at the end of 2019-06-30, down from 2.66% compared to ...
By Helgi Library - October 11, 2019
China Minsheng Banking made a net profit of CNY 15,831 mil under revenues of CNY 44,846 mil in the second quarter of 2019, up 7.87% a...
| Profit Statement | 2016 | 2017 | 2018 | |
| Net Interest Income | CNY mil | 94,684 | 86,552 | 76,680 |
| Net Fee Income | CNY mil | 52,261 | 47,742 | 48,131 |
| Other Income | CNY mil | 11,174 | 12,877 | 31,050 |
| Total Revenues | CNY mil | 158,119 | 147,171 | 155,861 |
| Operating Profit | CNY mil | 105,658 | 99,164 | 106,742 |
| Provisions | CNY mil | 41,214 | 32,180 | 43,611 |
| Net Profit | CNY mil | 47,843 | 49,813 | 50,327 |
| Balance Sheet | 2016 | 2017 | 2018 | |
| Interbank Loans | CNY mil | 461,837 | 271,274 | 337,869 |
| Customer Loans | CNY mil | 2,397,200 | 2,729,800 | 3,008,300 |
| Total Assets | CNY mil | 5,895,900 | 5,902,100 | 5,994,800 |
| Shareholders' Equity | CNY mil | 352,027 | 389,812 | 431,001 |
| Interbank Borrowing | CNY mil | 1,959,200 | 1,905,700 | 1,610,900 |
| Customer Deposits | CNY mil | 3,082,200 | 2,966,300 | 3,194,400 |
| Issued Debt Securities | CNY mil | 398,376 | 501,927 | 674,523 |
| Ratios | 2016 | 2017 | 2018 | |
| ROE | % | 14.5 | 13.4 | 12.3 |
| ROA | % | 0.919 | 0.844 | 0.846 |
| Costs (As % Of Assets) | % | 1.01 | 0.814 | 0.826 |
| Costs (As % Of Income) | % | 33.2 | 32.6 | 31.5 |
| Capital Adequacy Ratio | % | 11.7 | 11.9 | 11.8 |
| Net Interest Margin | % | 1.82 | 1.47 | 1.29 |
| Loans (As % Of Deposits) | % | 77.8 | 92.0 | 94.2 |
| NPLs (As % Of Loans) | % | 2.52 | 2.63 | 2.71 |
| Provisions (As % Of NPLs) | % | 104 | 101 | 85.4 |
| Valuation | 2016 | 2017 | 2018 | |
| Price/Earnings (P/E) | 7.46 | 7.38 | 5.67 | |
| Price/Book Value (P/BV) | 1.01 | 0.942 | 0.662 | |
| Earnings Per Share (EPS) | CNY | 1.09 | 1.14 | 1.15 |
| Book Value Per Share | CNY | 8.04 | 8.90 | 9.84 |
Get all company financials in excel:
| summary | Unit | 2005 | 2006 | 2007 | 2008 | 2009 | 2010 | 2011 | 2012 | 2013 | 2014 | 2015 | 2016 | 2017 | 2018 |
| income statement | |||||||||||||||
| Net Interest Income | CNY mil | 77,153 | 83,033 | 92,136 | 94,268 | 94,684 | |||||||||
| Total Revenues | CNY mil | 103,532 | 118,515 | 137,830 | 156,148 | 158,119 | |||||||||
| Operating Profit | CNY mil | 60,659 | 72,564 | 83,732 | 97,999 | 105,658 | |||||||||
| Net Profit | CNY mil | 37,563 | 42,278 | 44,546 | 46,111 | 47,843 | |||||||||
| balance sheet | |||||||||||||||
| Interbank Loans | CNY mil | 812,744 | 678,450 | 852,294 | 799,874 | 461,837 | |||||||||
| Customer Loans | CNY mil | 1,351,500 | 1,539,400 | 1,774,200 | 1,997,600 | 2,397,200 | |||||||||
| Debt Securities | CNY mil | 248,990 | 311,212 | 628,680 | 938,160 | 2,236,300 | |||||||||
| Total Assets | CNY mil | 3,212,000 | 3,226,200 | 4,015,100 | 4,520,700 | 5,895,900 | |||||||||
| Shareholders' Equity | CNY mil | 168,544 | 204,287 | 247,756 | 309,783 | 352,027 | |||||||||
| Interbank Borrowing | CNY mil | 910,597 | 638,244 | 975,010 | 1,039,900 | 1,959,200 | |||||||||
| Customer Deposits | CNY mil | 1,926,200 | 2,146,700 | 2,433,800 | 2,732,300 | 3,082,200 | |||||||||
| Issued Debt Securities | CNY mil | 147,104 | 173,803 | 278,871 | 352,248 | 398,376 | |||||||||
| ratios | |||||||||||||||
| ROE | % | 24.8 | 22.7 | 19.7 | 16.5 | 14.5 | |||||||||
| ROA | % | 1.38 | 1.31 | 1.23 | 1.08 | 0.919 | |||||||||
| Costs (As % Of Assets) | % | 1.58 | 1.43 | 1.49 | 1.36 | 1.01 | |||||||||
| Costs (As % Of Income) | % | 41.4 | 38.8 | 39.2 | 37.2 | 33.2 | |||||||||
| Capital Adequacy Ratio | % | 10.8 | 10.7 | 10.7 | 11.5 | 11.7 | |||||||||
| Net Interest Margin | % | 2.84 | 2.58 | 2.54 | 2.21 | 1.82 | |||||||||
| Interest Income (As % Of Revenues) | % | 74.5 | 70.1 | 66.8 | 60.4 | 59.9 | |||||||||
| Fee Income (As % Of Revenues) | % | 19.8 | 25.3 | 27.7 | 32.8 | 33.1 | |||||||||
| Equity (As % Of Assets) | % | 5.25 | 6.33 | 6.17 | 6.85 | 5.97 | |||||||||
| Loans (As % Of Deposits) | % | 70.2 | 71.7 | 72.9 | 73.1 | 77.8 | |||||||||
| Loans (As % Assets) | % | 42.1 | 47.7 | 44.2 | 44.2 | 40.7 | |||||||||
| NPLs (As % Of Loans) | % | 1.03 | 1.03 | 1.85 | 2.52 | 2.52 | |||||||||
| Provisions (As % Of NPLs) | % | 233 | 216 | 115 | 97.9 | 104 | |||||||||
| valuation | |||||||||||||||
| Market Capitalisation (End Of Period) | USD mil | 28,279 | 28,243 | 45,495 | 42,507 | 41,240 | |||||||||
| Number Of Shares (Average) | mil | 40,846 | 40,847 | 40,984 | 43,782 | 43,782 | |||||||||
| Share Price (End Of Period) | HKD | 5.37 | 5.36 | 8.61 | 7.52 | 7.30 | |||||||||
| Earnings Per Share (EPS) | CNY | 0.920 | 1.04 | 1.09 | 1.05 | 1.09 | |||||||||
| Book Value Per Share | CNY | 4.13 | 5.00 | 6.05 | 7.08 | 8.04 | |||||||||
| Price/Earnings (P/E) | 7.26 | 6.63 | 9.90 | 8.53 | 7.46 | ||||||||||
| Price/Book Value (P/BV) | 1.62 | 1.37 | 1.78 | 1.27 | 1.01 | ||||||||||
| Earnings Per Share Growth | % | ... | 26.7 | 12.5 | 5.01 | -3.10 | 3.76 | ||||||||
| Book Value Per Share Growth | % | ... | 18.4 | 21.2 | 20.9 | 17.0 | 13.6 |
| income statement | Unit | 2005 | 2006 | 2007 | 2008 | 2009 | 2010 | 2011 | 2012 | 2013 | 2014 | 2015 | 2016 | 2017 | 2018 |
| income statement | |||||||||||||||
| Interest Income | CNY mil | 151,887 | 182,154 | 199,052 | 203,382 | 203,918 | |||||||||
| Interest Cost | CNY mil | 74,734 | 99,121 | 106,916 | 109,114 | 109,234 | |||||||||
| Net Interest Income | CNY mil | 77,153 | 83,033 | 92,136 | 94,268 | 94,684 | |||||||||
| Net Fee Income | CNY mil | 20,523 | 29,956 | 38,239 | 51,205 | 52,261 | |||||||||
| Other Income | CNY mil | 5,856 | 5,526 | 7,455 | 10,675 | 11,174 | |||||||||
| Total Revenues | CNY mil | 103,532 | 118,515 | 137,830 | 156,148 | 158,119 | |||||||||
| Operating Cost | CNY mil | 42,873 | 45,951 | 54,098 | 58,149 | 52,461 | |||||||||
| Operating Profit | CNY mil | 60,659 | 72,564 | 83,732 | 97,999 | 105,658 | |||||||||
| Provisions | CNY mil | 8,331 | 12,947 | 19,928 | 33,029 | 41,214 | |||||||||
| Extra and Other Cost | CNY mil | 1,676 | 2,466 | 4,011 | 4,196 | 4,195 | |||||||||
| Pre-Tax Profit | CNY mil | 50,652 | 57,151 | 59,793 | 60,774 | 60,249 | |||||||||
| Tax | CNY mil | 12,344 | 13,869 | 14,226 | 13,752 | 11,471 | |||||||||
| Minorities | CNY mil | 745 | 1,004 | 1,021 | 911 | 935 | |||||||||
| Net Profit | CNY mil | 37,563 | 42,278 | 44,546 | 46,111 | 47,843 | |||||||||
| growth rates | |||||||||||||||
| Net Interest Income Growth | % | ... | 19.0 | 7.62 | 11.0 | 2.31 | 0.441 | ||||||||
| Net Fee Income Growth | % | ... | 35.9 | 46.0 | 27.7 | 33.9 | 2.06 | ||||||||
| Total Revenue Growth | % | ... | 25.2 | 14.5 | 16.3 | 13.3 | 1.26 | ||||||||
| Operating Cost Growth | % | ... | 17.0 | 7.18 | 17.7 | 7.49 | -9.78 | ||||||||
| Operating Profit Growth | % | ... | 31.8 | 19.6 | 15.4 | 17.0 | 7.82 | ||||||||
| Pre-Tax Profit Growth | % | ... | 36.3 | 12.8 | 4.62 | 1.64 | -0.864 | ||||||||
| Net Profit Growth | % | ... | 34.5 | 12.6 | 5.36 | 3.51 | 3.76 | ||||||||
| market share | |||||||||||||||
| Market Share in Revenues | % | ... | ... | ... | ... | ... | 3.27 | 3.31 | 3.28 | 3.36 | 3.37 | ... | |||
| Market Share in Net Profit | % | ... | ... | 2.49 | ... | ... | ... | ... | ... | ... | |||||
| Market Share in Employees | % | ... | ... | ... | ... | ... | ... | ... | ... | ... | ... | ... | ... | ... |
| balance sheet | Unit | 2005 | 2006 | 2007 | 2008 | 2009 | 2010 | 2011 | 2012 | 2013 | 2014 | 2015 | 2016 | 2017 | 2018 |
| balance sheet | |||||||||||||||
| Cash | CNY mil | 656,579 | 522,687 | 547,094 | 534,259 | 524,239 | |||||||||
| Interbank Loans | CNY mil | 812,744 | 678,450 | 852,294 | 799,874 | 461,837 | |||||||||
| Customer Loans | CNY mil | 1,351,500 | 1,539,400 | 1,774,200 | 1,997,600 | 2,397,200 | |||||||||
| Retail Loans | CNY mil | 465,576 | 605,529 | 654,681 | 728,028 | 900,922 | |||||||||
| Mortgage Loans | CNY mil | ... | ... | ... | ... | ... | ... | ... | ... | ... | ... | ... | 295,875 | ||
| Consumer Loans | CNY mil | ... | ... | ... | ... | ... | ... | ... | ... | ... | ... | ... | 605,047 | ||
| Corporate Loans | CNY mil | 919,034 | 968,734 | 1,158,000 | 1,320,000 | 1,560,700 | |||||||||
| Debt Securities | CNY mil | 248,990 | 311,212 | 628,680 | 938,160 | 2,236,300 | |||||||||
| Fixed Assets | CNY mil | 13,631 | 24,102 | 36,936 | 41,151 | 50,354 | |||||||||
| Total Assets | CNY mil | 3,212,000 | 3,226,200 | 4,015,100 | 4,520,700 | 5,895,900 | |||||||||
| Shareholders' Equity | CNY mil | 168,544 | 204,287 | 247,756 | 309,783 | 352,027 | |||||||||
| Of Which Minority Interest | CNY mil | ... | 5,467 | 6,575 | 7,614 | 8,565 | 9,437 | ||||||||
| Liabilities | CNY mil | 3,043,460 | 3,021,910 | 3,767,340 | 4,210,920 | 5,543,870 | |||||||||
| Interbank Borrowing | CNY mil | 910,597 | 638,244 | 975,010 | 1,039,900 | 1,959,200 | |||||||||
| Customer Deposits | CNY mil | 1,926,200 | 2,146,700 | 2,433,800 | 2,732,300 | 3,082,200 | |||||||||
| Sight Deposits | CNY mil | 729,453 | 810,428 | 844,716 | 963,034 | 1,308,800 | |||||||||
| Term Deposits | CNY mil | 1,196,750 | 1,336,270 | 1,589,080 | 1,769,270 | 1,773,400 | |||||||||
| Issued Debt Securities | CNY mil | 147,104 | 173,803 | 278,871 | 352,248 | 398,376 | |||||||||
| Other Liabilities | CNY mil | 59,555 | 63,166 | 79,663 | 86,469 | 104,097 | |||||||||
| asset quality | |||||||||||||||
| Non-Performing Loans | CNY mil | 14,206 | 16,142 | 33,595 | 51,529 | 61,929 | |||||||||
| Gross Loans | CNY mil | 1,384,600 | 1,574,300 | 1,812,700 | 2,048,000 | 2,461,600 | |||||||||
| Total Provisions | CNY mil | 33,098 | 34,816 | 38,507 | 50,423 | 64,394 | |||||||||
| growth rates | |||||||||||||||
| Customer Loan Growth | % | ... | 14.7 | 13.9 | 15.3 | 12.6 | 20.0 | ||||||||
| Retail Loan Growth | % | ... | 27.9 | 30.1 | 8.12 | 11.2 | 23.7 | ||||||||
| Mortgage Loan Growth | % | ... | ... | ... | ... | ... | ... | ... | ... | ... | ... | ... | ... | ||
| Consumer Loan Growth | % | ... | ... | ... | ... | ... | ... | ... | ... | ... | ... | ... | ... | ||
| Corporate Loan Growth | % | ... | 9.26 | 5.41 | 19.5 | 14.0 | 18.2 | ||||||||
| Total Asset Growth | % | ... | 44.1 | 0.442 | 24.5 | 12.6 | 30.4 | ||||||||
| Shareholders' Equity Growth | % | ... | 25.7 | 21.2 | 21.3 | 25.0 | 13.6 | ||||||||
| Customer Deposit Growth | % | ... | 17.1 | 11.4 | 13.4 | 12.3 | 12.8 | ||||||||
| market share | |||||||||||||||
| Market Share in Customer Loans | % | 2.01 | 1.93 | 1.97 | 1.90 | 2.06 | |||||||||
| Market Share in Total Assets | % | 2.40 | 2.12 | 2.33 | 2.27 | 2.56 | |||||||||
| Market Share in Customer Deposits | % | 2.04 | 5.15 | 5.38 | 4.80 | 4.34 |
| ratios | Unit | 2005 | 2006 | 2007 | 2008 | 2009 | 2010 | 2011 | 2012 | 2013 | 2014 | 2015 | 2016 | 2017 | 2018 |
| ratios | |||||||||||||||
| ROE | % | 24.8 | 22.7 | 19.7 | 16.5 | 14.5 | |||||||||
| ROA | % | 1.38 | 1.31 | 1.23 | 1.08 | 0.919 | |||||||||
| Costs (As % Of Assets) | % | 1.58 | 1.43 | 1.49 | 1.36 | 1.01 | |||||||||
| Costs (As % Of Income) | % | 41.4 | 38.8 | 39.2 | 37.2 | 33.2 | |||||||||
| Capital Adequacy Ratio | % | 10.8 | 10.7 | 10.7 | 11.5 | 11.7 | |||||||||
| Tier 1 Ratio | % | 8.13 | 8.72 | 8.59 | 9.19 | 9.22 | |||||||||
| Net Interest Margin | % | 2.84 | 2.58 | 2.54 | 2.21 | 1.82 | |||||||||
| Interest Spread | % | ... | 2.67 | 2.39 | 2.35 | 2.03 | 1.68 | ||||||||
| Asset Yield | % | 5.58 | 5.66 | 5.50 | 4.77 | 3.92 | |||||||||
| Cost Of Liabilities | % | ... | 2.91 | 3.27 | 3.15 | 2.74 | 2.24 | ||||||||
| Interest Income (As % Of Revenues) | % | 74.5 | 70.1 | 66.8 | 60.4 | 59.9 | |||||||||
| Fee Income (As % Of Revenues) | % | 19.8 | 25.3 | 27.7 | 32.8 | 33.1 | |||||||||
| Other Income (As % Of Revenues) | % | 5.66 | 4.66 | 5.41 | 6.84 | 7.07 | |||||||||
| Equity (As % Of Assets) | % | 5.25 | 6.33 | 6.17 | 6.85 | 5.97 | |||||||||
| Loans (As % Of Deposits) | % | 70.2 | 71.7 | 72.9 | 73.1 | 77.8 | |||||||||
| Loans (As % Assets) | % | 42.1 | 47.7 | 44.2 | 44.2 | 40.7 | |||||||||
| NPLs (As % Of Loans) | % | 1.03 | 1.03 | 1.85 | 2.52 | 2.52 | |||||||||
| Provisions (As % Of NPLs) | % | 233 | 216 | 115 | 97.9 | 104 | |||||||||
| Provisions (As % Of Loans) | % | 2.45 | 2.26 | 2.17 | 2.52 | 2.69 | |||||||||
| Cost of Provisions (As % Of Loans) | % | 0.659 | 0.896 | 1.20 | 1.75 | 1.88 |
| other data | Unit | 2005 | 2006 | 2007 | 2008 | 2009 | 2010 | 2011 | 2012 | 2013 | 2014 | 2015 | 2016 | 2017 | 2018 |
| other data | |||||||||||||||
| Employees | ... | 49,227 | 54,927 | 57,406 | 59,510 | 58,720 | |||||||||
| Sight (As % Of Customer Deposits) | % | 37.9 | 37.8 | 34.7 | 35.2 | 42.5 | |||||||||
| On-balance Sheet Loans | RMB mil | ... | ... | ... | ... | ... | ... | ... | ... | 1,539,400 | 1,774,200 | 1,997,600 | 2,397,200 |
Get all company financials in excel:

By Helgi Library - October 11, 2019
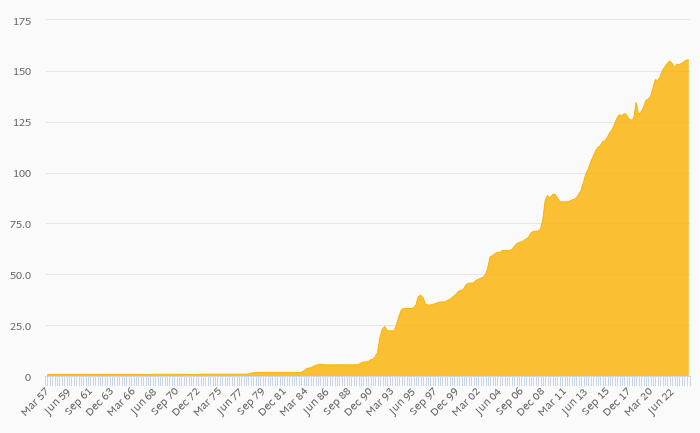
China Minsheng Banking's customer deposits reached CNY 3,075,600 mil in 2016-12-31, up 2.56% compared to the previous year. Chinese banking sector accepted customer deposits of CNY 71,030 bil in 2016-12-31, up 6.68% when compared to the last year. China M...
By Helgi Library - October 11, 2019
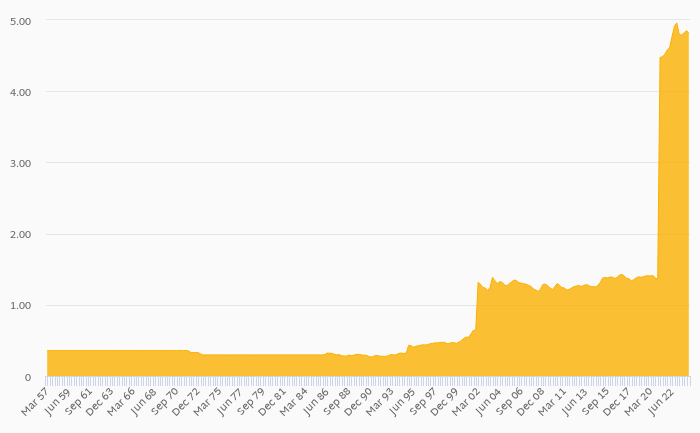
China Minsheng Banking's net interest margin amounted to 1.50% in the second quarter of 2019, up from 1.45% when compared to the previous quarter. Historically, the bank’s net interest margin reached an all time high of 3.33% in 4Q2011 and an all time low of...
By Helgi Library - October 11, 2019
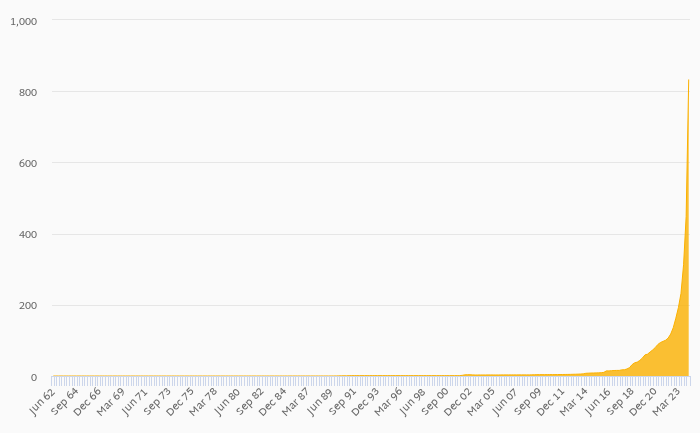
China Minsheng Banking's loans reached CNY 3,184,000 mil in the second quarter of 2019, up from CNY 3,120,350 mil when compared to the previous quarter and up from CNY 3,052,700 mil when compared to the same period of last year. Historically, the bank...
By Helgi Library - October 11, 2019
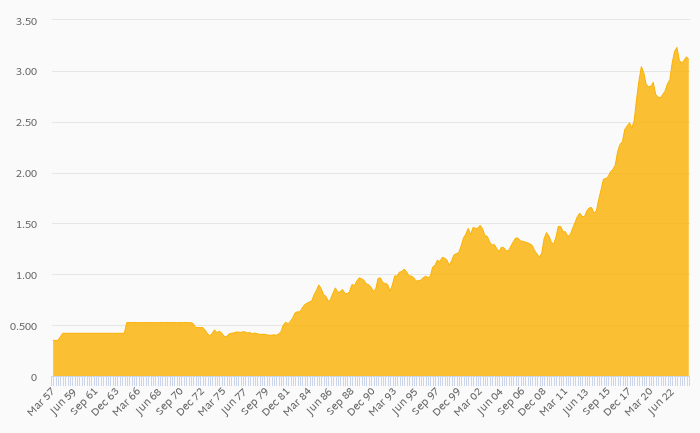
China Minsheng Banking stock traded at HKD 6.35 per share at the end second quarter of 2019 implying a market capitalization of USD 35,599 mil. Since the end of 2Q2014, the stock has appreciated by 50.8 % implying an annual average growth of 8.57 %. In absolute terms,...
By Helgi Library - October 23, 2019
China Minsheng Banking stock traded at JPY 1,645 per share at the end of second quarter of 2019 implying a market capitalization of USD 3,477 mil. Over the last five years, the stock has depreciated by 36.4 implying an annual average growth of -8.65% In a...
By Helgi Library - October 11, 2019
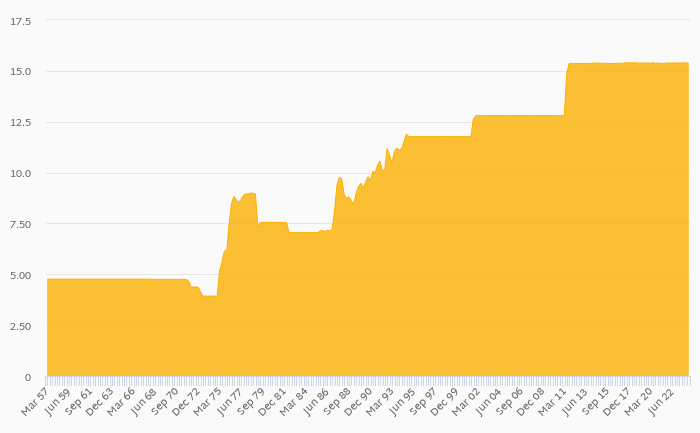
China Minsheng Banking's Equity reached 8.57% of total assets in the 2Q2019, up from 7.94% for the previous year. As a share of net customer loans, the ratio amounted to 15.6% at the end of the second quarter of 2019. ...
By Helgi Library - October 11, 2019
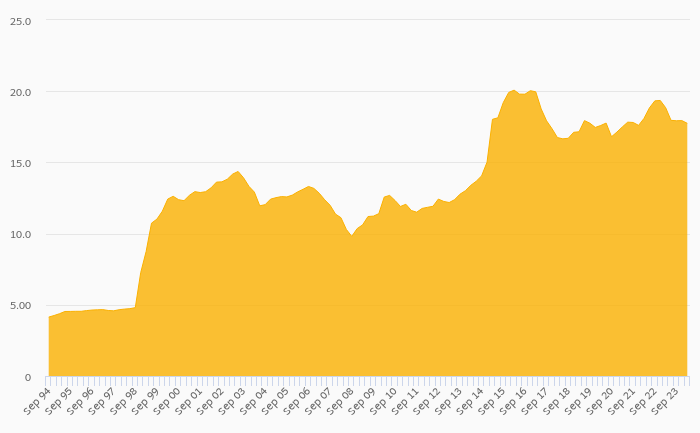
China Minsheng Banking's customer loan growth reached 5.47% in 2019-06-30, down from 12.6% compared to the previous year. Historically, the bank’s loans growth reached an all time high of 23.7% in 2016-09-30 and an all time low of 5.47% in 2019-06-30. In ...
By Helgi Library - October 11, 2019
China Minsheng Banking stock traded at HKD 6.35 per share at the end of second quarter of 2019 implying a market capitalization of USD 35,599 mil. Over the last five years, the stock has appreciated by 50.8 % implying an annual average growth of 8.57 %. In absolute te...
By Helgi Library - October 11, 2019
China Minsheng Banking generated total banking revenues of CNY 44,846 mil in the second quarter of 2019, up 20.5% when compared to the same period of last year and 17.2% when compared to the previous quarter. Historically, the bank’s revenues containing of in...
By Helgi Library - October 11, 2019
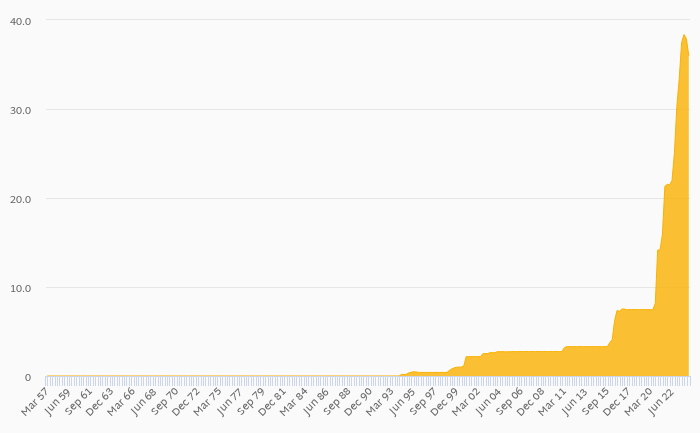
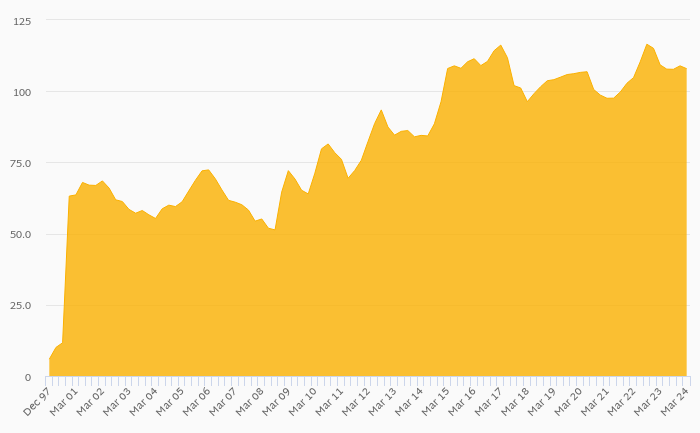
China Minsheng Banking's retail loans reached CNY 1,291,600 mil at the end of 2019-06-30, up 2.42% compared to the previous year. In the last decade, the average annual loan growth amounted to 0%. Overall, retail loans accounted for 41.3% of the bank's loan...

China Minsheng Banking has been growing its revenues and asset by 16.2% and 19.0% a year on average in the last 10 years. Its loans and deposits have grown by 16.6% and 15.1% a year during that time and loans to deposits ratio reached 94.2% at the end of 2018. The company achieved an average return on equity of 18.2% in the last decade with net profit growing 20.4% a year on average. In terms of operating efficiency, its cost to income ratio reached 31.5% in 2018, compared to 39.6% average in the last decade.
Equity represented 7.19% of total assets or 14.3% of loans at the end of 2018. China Minsheng Banking's non-performing loans were 2.71% of total loans while provisions covered some 85.4% of NPLs at the end of 2018.
China Minsheng Banking stock traded at HKD 5.73 per share at the end of 2018 resulting in a market capitalization of USD 32,040 mil. Over the previous five years, stock price rose by 6.88% or 1.34% a year on average. That’s compared to an average ROE of 15.3% the bank generated for its shareholders. This closing price put stock at a 12-month trailing price to earnings (PE) of 5.67x and price to book value (PBV) of 0.662x in 2018.
 Helgi Library