By Helgi Library - October 11, 2019
Bank of Communications made a net profit of CNY 21,678 mil under revenues of CNY 56,651 mil in the second quarter of 2019, up 4.83% a...
By Helgi Library - October 11, 2019
Bank of Communications's customer deposits reached CNY 5,047,500 mil in 2016-12-31, up 1.75% compared to the previous year. Chi...
By Helgi Library - October 11, 2019
Bank of Communications's loans reached CNY 5,130,600 mil in the second quarter of 2019, up from CNY 5,068,200 mil when compa...
| Profit Statement | Dec 2018 | Mar 2019 | Jun 2019 | |
| Net Interest Income | CNY mil | -8,509 | 34,857 | 35,205 |
| Net Fee Income | CNY mil | 9,844 | 12,056 | 11,066 |
| Other Income | CNY mil | 54,389 | 16,060 | 10,380 |
| Total Revenues | CNY mil | 55,724 | 62,973 | 56,651 |
| Operating Profit | CNY mil | 35,117 | 36,094 | 35,746 |
| Provisions | CNY mil | 14,733 | 10,705 | 10,844 |
| Net Profit | CNY mil | 16,326 | 21,071 | 21,678 |
| Balance Sheet | Dec 2018 | Mar 2019 | Jun 2019 | |
| Interbank Loans | CNY mil | 848,067 | 779,169 | 786,782 |
| Customer Loans | CNY mil | 4,742,400 | 4,952,500 | 5,013,600 |
| Total Assets | CNY mil | 9,531,200 | 9,785,700 | 9,886,600 |
| Shareholders' Equity | CNY mil | 705,308 | 725,882 | 723,748 |
| Interbank Borrowing | CNY mil | 2,173,700 | 1,974,300 | 1,971,800 |
| Customer Deposits | CNY mil | 6,160,100 | 6,576,300 | 6,624,600 |
| Issued Debt Securities | CNY mil | 317,688 | 332,909 | 337,972 |
| Ratios | Dec 2018 | Mar 2019 | Jun 2019 | |
| ROE | % | 9.37 | 11.8 | 12.0 |
| ROA | % | 0.690 | 0.873 | 0.882 |
| Costs (As % Of Assets) | % | 0.871 | 1.11 | 0.850 |
| Costs (As % Of Income) | % | 37.0 | 42.7 | 36.9 |
| Capital Adequacy Ratio | % | 14.4 | 14.2 | 13.8 |
| Net Interest Margin | % | -0.360 | 1.44 | 1.43 |
| Loans (As % Of Deposits) | % | 77.0 | 75.3 | 75.7 |
| NPLs (As % Of Loans) | % | 1.51 | 1.47 | 1.49 |
| Provisions (As % Of NPLs) | % | 153 | 155 | 153 |
| Valuation | Dec 2018 | Mar 2019 | Jun 2019 | |
| Price/Earnings (P/E) | 6.16 | 6.86 | 5.82 | |
| Price/Book Value (P/BV) | 0.643 | 0.705 | 0.608 | |
| Dividend Yield | % | 0 | 0 | 0 |
| Earnings Per Share (EPS) | CNY | 0.991 | 1.00 | 1.03 |
| Book Value Per Share | CNY | 9.50 | 9.77 | 9.88 |
| Dividend Per Share | CNY | 0 | 0 | 0 |
Get all company financials in excel:
| summary | Unit | Sep 2009 | Dec 2009 | Mar 2010 | Jun 2010 | Sep 2010 | Dec 2010 | Mar 2011 | Jun 2011 | Sep 2011 | Dec 2011 | Mar 2012 | Jun 2012 | Sep 2012 | Dec 2012 | Mar 2013 | Jun 2013 | Sep 2013 | Dec 2013 | Mar 2014 | Jun 2014 | Sep 2014 | Dec 2014 | Mar 2015 | Jun 2015 | Sep 2015 | Dec 2015 | Mar 2016 | Jun 2016 | Sep 2016 | Dec 2016 | Mar 2017 | Jun 2017 | Sep 2017 | Dec 2017 | Mar 2018 | Jun 2018 | Sep 2018 | Dec 2018 | Mar 2019 | Jun 2019 |
| income statement | |||||||||||||||||||||||||||||||||||||||||
| Net Interest Income | CNY mil | ... | ... | 31,411 | 29,212 | 31,446 | 34,517 | -8,509 | |||||||||||||||||||||||||||||||||
| Total Revenues | CNY mil | ... | ... | 46,696 | 49,854 | 51,940 | 56,985 | 55,724 | |||||||||||||||||||||||||||||||||
| Operating Profit | CNY mil | ... | ... | 27,733 | 31,125 | 32,920 | 33,547 | 35,117 | |||||||||||||||||||||||||||||||||
| Net Profit | CNY mil | ... | ... | 15,804 | 20,091 | 20,680 | 16,533 | 16,326 | |||||||||||||||||||||||||||||||||
| balance sheet | |||||||||||||||||||||||||||||||||||||||||
| Interbank Loans | CNY mil | 782,468 | 807,894 | 733,308 | 708,349 | 848,067 | |||||||||||||||||||||||||||||||||||
| Customer Loans | CNY mil | 4,354,500 | 4,583,400 | 4,669,200 | 4,725,200 | 4,742,400 | |||||||||||||||||||||||||||||||||||
| Debt Securities | CNY mil | 2,536,500 | 703,738 | 2,684,200 | 2,807,400 | 2,829,800 | |||||||||||||||||||||||||||||||||||
| Total Assets | CNY mil | 9,038,300 | 9,266,800 | 9,322,700 | 9,391,500 | 9,531,200 | |||||||||||||||||||||||||||||||||||
| Shareholders' Equity | CNY mil | 676,271 | 668,501 | 670,061 | 689,085 | 705,308 | |||||||||||||||||||||||||||||||||||
| Interbank Borrowing | CNY mil | 2,397,100 | 1,978,300 | 2,003,600 | 2,093,800 | 2,173,700 | |||||||||||||||||||||||||||||||||||
| Customer Deposits | CNY mil | 5,419,300 | 6,046,800 | 6,051,700 | 6,003,200 | 6,160,100 | |||||||||||||||||||||||||||||||||||
| Issued Debt Securities | CNY mil | 287,662 | 289,574 | 293,818 | 303,834 | 317,688 | |||||||||||||||||||||||||||||||||||
| ratios | |||||||||||||||||||||||||||||||||||||||||
| ROE | % | ... | ... | 9.44 | 12.0 | 12.4 | 9.73 | 9.37 | |||||||||||||||||||||||||||||||||
| ROA | % | ... | ... | 0.703 | 0.878 | 0.890 | 0.707 | 0.690 | |||||||||||||||||||||||||||||||||
| Costs (As % Of Assets) | % | ... | ... | 0.844 | 0.819 | 0.819 | 1.00 | 0.871 | |||||||||||||||||||||||||||||||||
| Costs (As % Of Income) | % | ... | ... | 40.6 | 37.6 | 36.6 | 41.1 | 37.0 | |||||||||||||||||||||||||||||||||
| Capital Adequacy Ratio | % | ... | ... | 14.0 | 14.0 | 13.9 | 14.1 | 14.4 | |||||||||||||||||||||||||||||||||
| Net Interest Margin | % | ... | ... | 1.40 | 1.28 | 1.35 | 1.48 | -0.360 | |||||||||||||||||||||||||||||||||
| Interest Income (As % Of Revenues) | % | ... | ... | 67.3 | 58.6 | 60.5 | 60.6 | -15.3 | |||||||||||||||||||||||||||||||||
| Fee Income (As % Of Revenues) | % | ... | ... | 21.3 | 21.8 | 19.9 | 17.9 | 17.7 | |||||||||||||||||||||||||||||||||
| Equity (As % Of Assets) | % | 7.48 | 7.21 | 7.19 | 7.34 | 7.40 | |||||||||||||||||||||||||||||||||||
| Loans (As % Of Deposits) | % | 80.4 | 75.8 | 77.2 | 78.7 | 77.0 | |||||||||||||||||||||||||||||||||||
| Loans (As % Assets) | % | 48.2 | 49.5 | 50.1 | 50.3 | 49.8 | |||||||||||||||||||||||||||||||||||
| NPLs (As % Of Loans) | % | ... | ... | 1.52 | 1.50 | 1.51 | 1.49 | 1.51 | |||||||||||||||||||||||||||||||||
| Provisions (As % Of NPLs) | % | ... | ... | 151 | 171 | 172 | 176 | 153 | |||||||||||||||||||||||||||||||||
| valuation | |||||||||||||||||||||||||||||||||||||||||
| Market Capitalisation (End Of Period) | USD mil | ... | ... | 52,866 | 52,931 | 47,999 | 48,869 | 50,893 | |||||||||||||||||||||||||||||||||
| Number Of Shares (Average) | mil | ... | ... | 74,263 | 74,263 | 74,263 | 74,263 | 74,263 | |||||||||||||||||||||||||||||||||
| Share Price (End Of Period) | HKD | ... | ... | 5.56 | 5.60 | 5.07 | 5.15 | 5.37 | |||||||||||||||||||||||||||||||||
| Earnings Per Share (EPS) | CNY | ... | ... | 0.946 | 0.956 | 0.970 | 0.984 | 0.991 | |||||||||||||||||||||||||||||||||
| Book Value Per Share | CNY | ... | ... | 9.11 | 9.00 | 9.02 | 9.28 | 9.50 | |||||||||||||||||||||||||||||||||
| Dividend Per Share | CNY | ... | ... | 0 | 0 | 0 | 0 | 0 | |||||||||||||||||||||||||||||||||
| Price/Earnings (P/E) | ... | ... | 7.05 | 7.30 | 6.20 | 5.97 | 6.16 | ||||||||||||||||||||||||||||||||||
| Price/Book Value (P/BV) | ... | ... | 0.732 | 0.776 | 0.667 | 0.633 | 0.643 | ||||||||||||||||||||||||||||||||||
| Dividend Yield | % | ... | ... | 0 | 0 | 0 | 0 | 0 | |||||||||||||||||||||||||||||||||
| Earnings Per Share Growth | % | ... | ... | ... | ... | ... | ... | 4.48 | 5.22 | 5.10 | 5.88 | 4.85 | |||||||||||||||||||||||||||||
| Book Value Per Share Growth | % | ... | ... | ... | ... | ... | ... | 6.94 | 2.51 | 3.34 | 3.86 | 4.29 |
| income statement | Unit | Sep 2009 | Dec 2009 | Mar 2010 | Jun 2010 | Sep 2010 | Dec 2010 | Mar 2011 | Jun 2011 | Sep 2011 | Dec 2011 | Mar 2012 | Jun 2012 | Sep 2012 | Dec 2012 | Mar 2013 | Jun 2013 | Sep 2013 | Dec 2013 | Mar 2014 | Jun 2014 | Sep 2014 | Dec 2014 | Mar 2015 | Jun 2015 | Sep 2015 | Dec 2015 | Mar 2016 | Jun 2016 | Sep 2016 | Dec 2016 | Mar 2017 | Jun 2017 | Sep 2017 | Dec 2017 | Mar 2018 | Jun 2018 | Sep 2018 | Dec 2018 | Mar 2019 | Jun 2019 |
| income statement | |||||||||||||||||||||||||||||||||||||||||
| Interest Income | CNY mil | ... | ... | 81,015 | 83,992 | 86,554 | 89,392 | 44,684 | |||||||||||||||||||||||||||||||||
| Interest Cost | CNY mil | ... | ... | 49,604 | 54,780 | 55,108 | 54,875 | 53,193 | |||||||||||||||||||||||||||||||||
| Net Interest Income | CNY mil | ... | ... | 31,411 | 29,212 | 31,446 | 34,517 | -8,509 | |||||||||||||||||||||||||||||||||
| Net Fee Income | CNY mil | ... | ... | 9,943 | 10,844 | 10,338 | 10,211 | 9,844 | |||||||||||||||||||||||||||||||||
| Other Income | CNY mil | ... | ... | 5,342 | 9,798 | 10,156 | 12,257 | 54,389 | |||||||||||||||||||||||||||||||||
| Total Revenues | CNY mil | ... | ... | 46,696 | 49,854 | 51,940 | 56,985 | 55,724 | |||||||||||||||||||||||||||||||||
| Operating Cost | CNY mil | ... | ... | 18,963 | 18,729 | 19,020 | 23,438 | 20,607 | |||||||||||||||||||||||||||||||||
| Operating Profit | CNY mil | ... | ... | 27,733 | 31,125 | 32,920 | 33,547 | 35,117 | |||||||||||||||||||||||||||||||||
| Provisions | CNY mil | ... | ... | 9,820 | 7,073 | 8,129 | 13,579 | 14,733 | |||||||||||||||||||||||||||||||||
| Extra and Other Cost | CNY mil | ... | ... | 584 | 667 | 706 | 911 | 844 | |||||||||||||||||||||||||||||||||
| Pre-Tax Profit | CNY mil | ... | ... | 17,329 | 23,385 | 24,085 | 19,057 | 19,540 | |||||||||||||||||||||||||||||||||
| Tax | CNY mil | ... | ... | 1,430 | 3,153 | 3,323 | 2,378 | 3,048 | |||||||||||||||||||||||||||||||||
| Minorities | CNY mil | ... | ... | 95.0 | 141 | 82.0 | 146 | 166 | |||||||||||||||||||||||||||||||||
| Net Profit | CNY mil | ... | ... | 15,804 | 20,091 | 20,680 | 16,533 | 16,326 | |||||||||||||||||||||||||||||||||
| growth rates | |||||||||||||||||||||||||||||||||||||||||
| Net Interest Income Growth | % | ... | ... | ... | ... | ... | ... | -7.90 | -6.42 | 4.42 | 7.43 | -127 | |||||||||||||||||||||||||||||
| Net Fee Income Growth | % | ... | ... | ... | ... | ... | ... | 25.9 | -3.86 | 3.57 | 9.24 | -0.996 | |||||||||||||||||||||||||||||
| Total Revenue Growth | % | ... | ... | ... | ... | ... | ... | 0.621 | -10.8 | 4.50 | 20.5 | 19.3 | |||||||||||||||||||||||||||||
| Operating Cost Growth | % | ... | ... | ... | ... | ... | ... | -4.11 | -20.5 | 4.30 | 11.3 | 8.67 | |||||||||||||||||||||||||||||
| Operating Profit Growth | % | ... | ... | ... | ... | ... | ... | 4.13 | -3.69 | 4.62 | 27.8 | 26.6 | |||||||||||||||||||||||||||||
| Pre-Tax Profit Growth | % | ... | ... | ... | ... | ... | ... | -7.28 | -2.61 | 3.18 | 2.56 | 12.8 | |||||||||||||||||||||||||||||
| Net Profit Growth | % | ... | ... | ... | ... | ... | ... | 8.01 | 3.97 | 5.23 | 7.05 | 3.30 |
| balance sheet | Unit | Sep 2009 | Dec 2009 | Mar 2010 | Jun 2010 | Sep 2010 | Dec 2010 | Mar 2011 | Jun 2011 | Sep 2011 | Dec 2011 | Mar 2012 | Jun 2012 | Sep 2012 | Dec 2012 | Mar 2013 | Jun 2013 | Sep 2013 | Dec 2013 | Mar 2014 | Jun 2014 | Sep 2014 | Dec 2014 | Mar 2015 | Jun 2015 | Sep 2015 | Dec 2015 | Mar 2016 | Jun 2016 | Sep 2016 | Dec 2016 | Mar 2017 | Jun 2017 | Sep 2017 | Dec 2017 | Mar 2018 | Jun 2018 | Sep 2018 | Dec 2018 | Mar 2019 | Jun 2019 |
| balance sheet | |||||||||||||||||||||||||||||||||||||||||
| Cash | CNY mil | 938,571 | 908,273 | 917,282 | 862,661 | 840,171 | |||||||||||||||||||||||||||||||||||
| Interbank Loans | CNY mil | 782,468 | 807,894 | 733,308 | 708,349 | 848,067 | |||||||||||||||||||||||||||||||||||
| Customer Loans | CNY mil | 4,354,500 | 4,583,400 | 4,669,200 | 4,725,200 | 4,742,400 | |||||||||||||||||||||||||||||||||||
| Retail Loans | CNY mil | 1,409,900 | 1,483,800 | 1,567,500 | 1,601,550 | 1,635,600 | |||||||||||||||||||||||||||||||||||
| Mortgage Loans | CNY mil | 897,264 | 924,958 | 952,652 | 980,076 | 1,007,500 | |||||||||||||||||||||||||||||||||||
| Consumer Loans | CNY mil | 512,636 | 558,842 | 614,848 | 621,474 | 628,100 | |||||||||||||||||||||||||||||||||||
| Corporate Loans | CNY mil | 3,047,000 | 3,220,300 | 3,062,800 | 3,140,700 | 3,218,600 | |||||||||||||||||||||||||||||||||||
| Debt Securities | CNY mil | 2,536,500 | 703,738 | 2,684,200 | 2,807,400 | 2,829,800 | |||||||||||||||||||||||||||||||||||
| Fixed Assets | CNY mil | 134,326 | 134,395 | 141,901 | 147,249 | 155,155 | |||||||||||||||||||||||||||||||||||
| Total Assets | CNY mil | 9,038,300 | 9,266,800 | 9,322,700 | 9,391,500 | 9,531,200 | |||||||||||||||||||||||||||||||||||
| Shareholders' Equity | CNY mil | 676,271 | 668,501 | 670,061 | 689,085 | 705,308 | |||||||||||||||||||||||||||||||||||
| Of Which Minority Interest | CNY mil | 5,128 | 5,165 | 6,408 | 6,627 | 6,903 | |||||||||||||||||||||||||||||||||||
| Liabilities | CNY mil | 8,362,030 | 8,598,300 | 8,652,640 | 8,702,420 | 8,825,890 | |||||||||||||||||||||||||||||||||||
| Interbank Borrowing | CNY mil | 2,397,100 | 1,978,300 | 2,003,600 | 2,093,800 | 2,173,700 | |||||||||||||||||||||||||||||||||||
| Customer Deposits | CNY mil | 5,419,300 | 6,046,800 | 6,051,700 | 6,003,200 | 6,160,100 | |||||||||||||||||||||||||||||||||||
| Sight Deposits | CNY mil | 2,497,900 | 2,500,650 | 2,503,400 | 2,469,850 | 2,436,300 | |||||||||||||||||||||||||||||||||||
| Term Deposits | CNY mil | 2,921,400 | 3,546,150 | 3,548,300 | 3,533,350 | 3,723,800 | |||||||||||||||||||||||||||||||||||
| Issued Debt Securities | CNY mil | 287,662 | 289,574 | 293,818 | 303,834 | 317,688 | |||||||||||||||||||||||||||||||||||
| Other Liabilities | CNY mil | 257,967 | 283,625 | 303,521 | 301,581 | 174,404 | |||||||||||||||||||||||||||||||||||
| asset quality | |||||||||||||||||||||||||||||||||||||||||
| Non-Performing Loans | CNY mil | 67,808 | 70,561 | 72,350 | 72,280 | 73,336 | |||||||||||||||||||||||||||||||||||
| Gross Loans | CNY mil | ... | ... | 4,456,900 | 4,704,100 | 4,794,000 | 4,852,000 | 4,854,200 | |||||||||||||||||||||||||||||||||
| Total Provisions | CNY mil | ... | ... | 102,415 | 120,715 | 124,758 | 126,854 | 111,856 | |||||||||||||||||||||||||||||||||
| growth rates | |||||||||||||||||||||||||||||||||||||||||
| Customer Loan Growth | % | ... | ... | ... | ... | 8.62 | 7.97 | 9.34 | 9.57 | 8.91 | |||||||||||||||||||||||||||||||
| Retail Loan Growth | % | ... | ... | ... | ... | 18.9 | 19.7 | 21.2 | 18.5 | 16.0 | |||||||||||||||||||||||||||||||
| Mortgage Loan Growth | % | ... | ... | ... | ... | 16.5 | 15.2 | 13.9 | 13.1 | 12.3 | |||||||||||||||||||||||||||||||
| Consumer Loan Growth | % | ... | ... | ... | ... | 23.3 | 28.0 | 34.5 | 28.2 | 22.5 | |||||||||||||||||||||||||||||||
| Corporate Loan Growth | % | ... | ... | ... | ... | 4.46 | 7.45 | -0.461 | 2.57 | 5.63 | |||||||||||||||||||||||||||||||
| Total Asset Growth | % | ... | ... | ... | ... | 7.56 | 6.10 | 4.39 | 5.10 | 5.45 | |||||||||||||||||||||||||||||||
| Shareholders' Equity Growth | % | ... | ... | ... | ... | 6.94 | 2.51 | 3.34 | 3.86 | 4.29 | |||||||||||||||||||||||||||||||
| Customer Deposit Growth | % | ... | ... | ... | ... | 7.37 | 13.8 | 12.4 | 12.2 | 13.7 | |||||||||||||||||||||||||||||||
| market share | |||||||||||||||||||||||||||||||||||||||||
| Market Share in Customer Loans | % | 3.38 | 3.42 | 3.40 | 3.32 | 3.27 | ... | ||||||||||||||||||||||||||||||||||
| Market Share in Total Assets | % | ... | ... | ... | ... | ... | ... | ... | ... | ... | ... | ... | ... | ... | ... | ... | ... | ... | ... | ... | ... | ... | ... | ... | ... | ... | ... | ... | ... | ... | ... | ... | ... | ||||||||
| Market Share in Customer Deposits | % | ... | ... | ... | ... | ... | ... | ... | ... | ... | ... | ... | ... | ... | ... | ... | ... | ... | ... | ... | ... | ... | ... | ... | ... | ... | ... | ... | ... | ... | ... | ... | ... |
| ratios | Unit | Sep 2009 | Dec 2009 | Mar 2010 | Jun 2010 | Sep 2010 | Dec 2010 | Mar 2011 | Jun 2011 | Sep 2011 | Dec 2011 | Mar 2012 | Jun 2012 | Sep 2012 | Dec 2012 | Mar 2013 | Jun 2013 | Sep 2013 | Dec 2013 | Mar 2014 | Jun 2014 | Sep 2014 | Dec 2014 | Mar 2015 | Jun 2015 | Sep 2015 | Dec 2015 | Mar 2016 | Jun 2016 | Sep 2016 | Dec 2016 | Mar 2017 | Jun 2017 | Sep 2017 | Dec 2017 | Mar 2018 | Jun 2018 | Sep 2018 | Dec 2018 | Mar 2019 | Jun 2019 |
| ratios | |||||||||||||||||||||||||||||||||||||||||
| ROE | % | ... | ... | 9.44 | 12.0 | 12.4 | 9.73 | 9.37 | |||||||||||||||||||||||||||||||||
| ROA | % | ... | ... | 0.703 | 0.878 | 0.890 | 0.707 | 0.690 | |||||||||||||||||||||||||||||||||
| Costs (As % Of Assets) | % | ... | ... | 0.844 | 0.819 | 0.819 | 1.00 | 0.871 | |||||||||||||||||||||||||||||||||
| Costs (As % Of Income) | % | ... | ... | 40.6 | 37.6 | 36.6 | 41.1 | 37.0 | |||||||||||||||||||||||||||||||||
| Capital Adequacy Ratio | % | ... | ... | 14.0 | 14.0 | 13.9 | 14.1 | 14.4 | |||||||||||||||||||||||||||||||||
| Tier 1 Ratio | % | ... | ... | ... | ... | ... | ... | ... | ... | ... | ... | ... | ... | 11.9 | 11.8 | 11.7 | 11.9 | 12.2 | |||||||||||||||||||||||
| Net Interest Margin | % | ... | ... | 1.40 | 1.28 | 1.35 | 1.48 | -0.360 | |||||||||||||||||||||||||||||||||
| Interest Spread | % | ... | ... | 1.22 | 1.09 | 1.17 | 1.29 | -0.539 | |||||||||||||||||||||||||||||||||
| Asset Yield | % | ... | ... | 3.61 | 3.67 | 3.72 | 3.82 | 1.89 | |||||||||||||||||||||||||||||||||
| Cost Of Liabilities | % | ... | ... | 2.39 | 2.58 | 2.56 | 2.53 | 2.43 | |||||||||||||||||||||||||||||||||
| Payout Ratio | % | ... | ... | 0 | 0 | 0 | 0 | 0 | |||||||||||||||||||||||||||||||||
| Interest Income (As % Of Revenues) | % | ... | ... | 67.3 | 58.6 | 60.5 | 60.6 | -15.3 | |||||||||||||||||||||||||||||||||
| Fee Income (As % Of Revenues) | % | ... | ... | 21.3 | 21.8 | 19.9 | 17.9 | 17.7 | |||||||||||||||||||||||||||||||||
| Other Income (As % Of Revenues) | % | ... | ... | 11.4 | 19.7 | 19.6 | 21.5 | 97.6 | |||||||||||||||||||||||||||||||||
| Equity (As % Of Assets) | % | 7.48 | 7.21 | 7.19 | 7.34 | 7.40 | |||||||||||||||||||||||||||||||||||
| Loans (As % Of Deposits) | % | 80.4 | 75.8 | 77.2 | 78.7 | 77.0 | |||||||||||||||||||||||||||||||||||
| Loans (As % Assets) | % | 48.2 | 49.5 | 50.1 | 50.3 | 49.8 | |||||||||||||||||||||||||||||||||||
| NPLs (As % Of Loans) | % | ... | ... | 1.52 | 1.50 | 1.51 | 1.49 | 1.51 | |||||||||||||||||||||||||||||||||
| Provisions (As % Of NPLs) | % | ... | ... | 151 | 171 | 172 | 176 | 153 | |||||||||||||||||||||||||||||||||
| Provisions (As % Of Loans) | % | ... | ... | 2.35 | 2.63 | 2.67 | 2.68 | 2.36 | |||||||||||||||||||||||||||||||||
| Cost of Provisions (As % Of Loans) | % | ... | ... | 0.906 | 0.633 | 0.703 | 1.16 | 1.24 |
| other data | Unit | Sep 2009 | Dec 2009 | Mar 2010 | Jun 2010 | Sep 2010 | Dec 2010 | Mar 2011 | Jun 2011 | Sep 2011 | Dec 2011 | Mar 2012 | Jun 2012 | Sep 2012 | Dec 2012 | Mar 2013 | Jun 2013 | Sep 2013 | Dec 2013 | Mar 2014 | Jun 2014 | Sep 2014 | Dec 2014 | Mar 2015 | Jun 2015 | Sep 2015 | Dec 2015 | Mar 2016 | Jun 2016 | Sep 2016 | Dec 2016 | Mar 2017 | Jun 2017 | Sep 2017 | Dec 2017 | Mar 2018 | Jun 2018 | Sep 2018 | Dec 2018 | Mar 2019 | Jun 2019 |
| other data | |||||||||||||||||||||||||||||||||||||||||
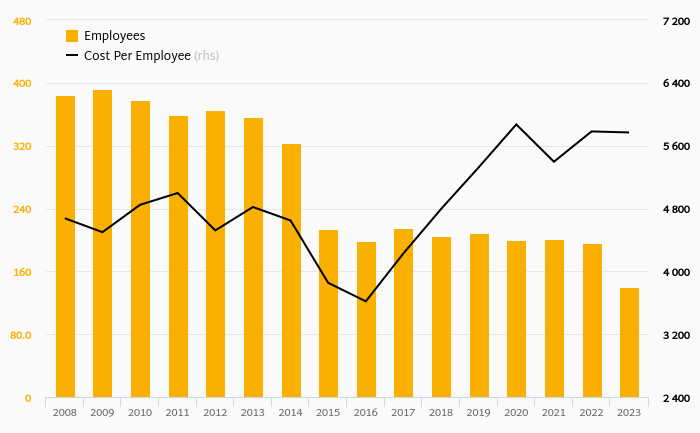
| Employees | 91,240 | 89,923 | 88,605 | 89,074 | 89,542 | ||||||||||||||||||||||||||||||||||||
| Sight (As % Of Customer Deposits) | % | 46.1 | 41.4 | 41.4 | 41.1 | 39.5 | |||||||||||||||||||||||||||||||||||
| On-balance Sheet Loans | RMB mil | ... | ... | ... | ... | ... | ... | ... | ... | ... | ... | ... | ... | ... | ... | ... | ... | ... | 4,354,500 | 4,583,400 | 4,669,200 | 4,725,200 | 4,742,400 |
Get all company financials in excel:


By Helgi Library - October 11, 2019
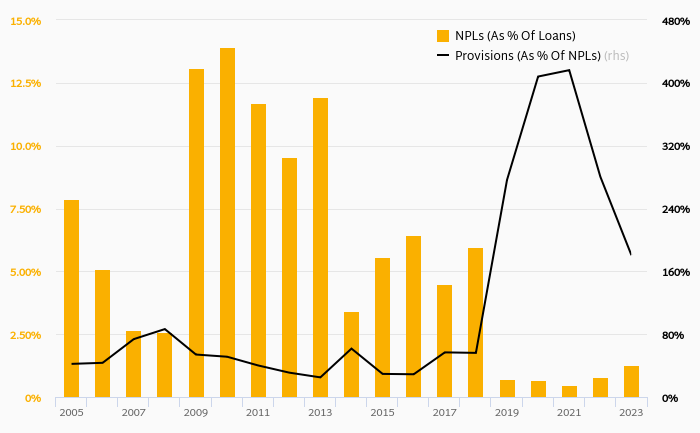
Bank of Communications's non-performing loans reached 1.49% of total loans at the end of 2019-06-30, down from 1.51% compared to the previous year. Historically, the NPL ratio hit an all time high of 2.42% in 2015-12-31 and an all time low of 0.941% in 2011-09-30...
By Helgi Library - October 11, 2019
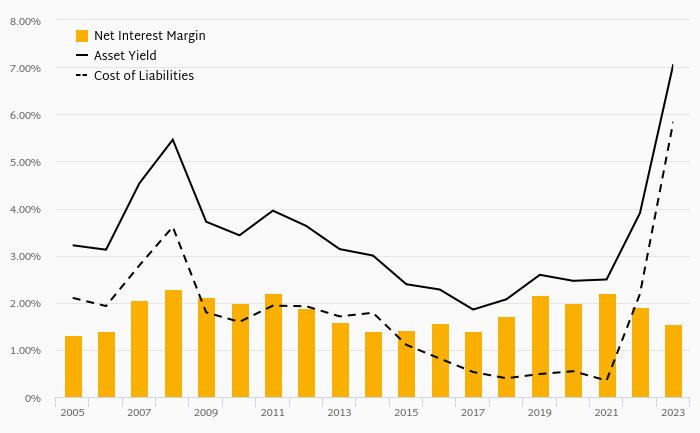
Bank of Communications's net interest margin amounted to 1.43% in the second quarter of 2019, down from 1.44% when compared to the previous quarter. Historically, the bank’s net interest margin reached an all time high of 5.09% in 4Q2015 and an all time low ...
By Helgi Library - October 11, 2019
Bank of Communications stock traded at HKD 5.28 per share at the end second quarter of 2019 implying a market capitalization of USD 49,570 mil. Since the end of 2Q2014, the stock has appreciated by 23.4 % implying an annual average growth of 4.29 %. In absolute terms,...
By Helgi Library - October 23, 2019
Bank of Communications stock traded at HKD 5.28 per share at the end of second quarter of 2019 implying a market capitalization of USD 49,570 mil. Over the last five years, the stock has appreciated by 23.4 implying an annual average growth of 4.29% In ab...
By Helgi Library - October 11, 2019
Bank of Communications's capital adequacy ratio reached 13.8% at the end of second quarter of 2019, down from 14.2% when compared to the previous quarter. Historically, the bank’s capital ratio hit an all time high of 14.5% in 3Q2012 and an all time low of 12.1% in...
By Helgi Library - October 11, 2019
Bank of Communications's retail loans reached CNY 1,654,200 mil at the end of 2019-06-30, up 1.24% compared to the previous year. In the last decade, the average annual loan growth amounted to 0%. Overall, retail loans accounted for 33.0% of the bank's loan...
By Helgi Library - October 11, 2019
Bank of Communications stock traded at HKD 5.28 per share at the end of second quarter of 2019 implying a market capitalization of USD 49,570 mil. Over the last five years, the stock has appreciated by 23.4 % implying an annual average growth of 4.29 %. In absolute te...
By Helgi Library - October 11, 2019
Bank of Communications generated total banking revenues of CNY 56,651 mil in the second quarter of 2019, up 9.07% when compared to the same period of last year and down 10% when compared to the previous quarter. Historically, the bank’s revenues c...
By Helgi Library - October 11, 2019
Bank of Communications's Equity reached 4.91% of total assets in the 2Q2019, up from 4.86% for the previous year. As a share of net customer loans, the ratio amounted to 10.9% at the end of the second quarter of 2019. ...
By Helgi Library - October 11, 2019
Bank of Communications's customer loan growth reached 7.38% in 2019-06-30, down from 9.34% compared to the previous year. Historically, the bank’s loans growth reached an all time high of 21.6% in 2010-12-31 and an all time low of 4.68% in 2014-03-31. In ...

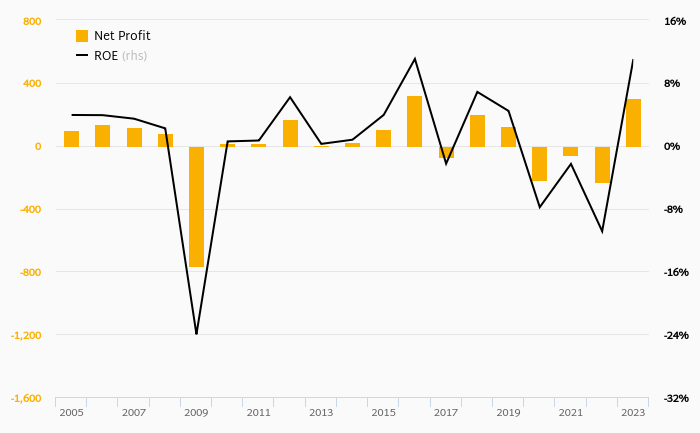
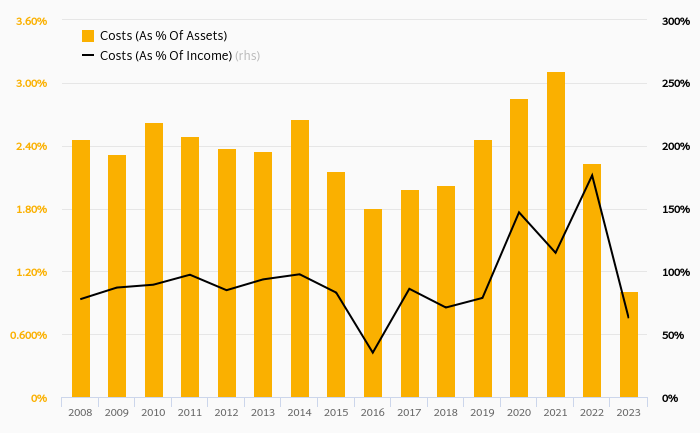
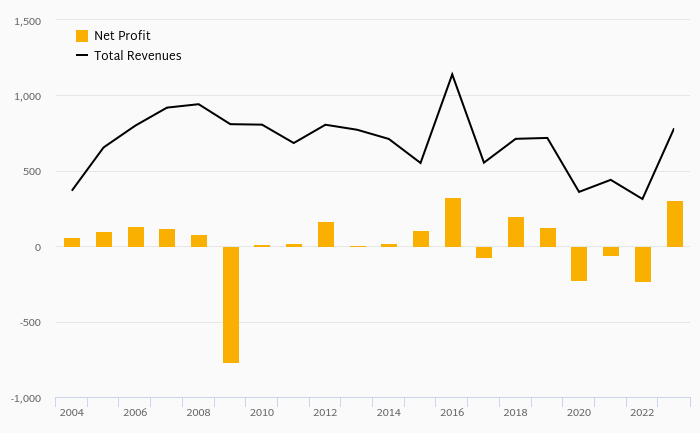
Bank of Communications has been growing its revenues and asset by 10.7% and 14.1% a year on average in the last 10 years. Its loans and deposits have grown by 13.8% and 12.7% a year during that time and loans to deposits ratio reached 77.0% at the end of 2018. The company achieved an average return on equity of 15.4% in the last decade with net profit growing 9.95% a year on average. In terms of operating efficiency, its cost to income ratio reached 38.6% in 2018, compared to 39.5% average in the last decade.
Equity represented 7.40% of total assets or 14.9% of loans at the end of 2018. Bank of Communications's non-performing loans were 1.51% of total loans while provisions covered some 153% of NPLs at the end of 2018.
Bank of Communications stock traded at HKD 5.37 per share at the end of 2018 resulting in a market capitalization of USD 50,893 mil. Over the previous five years, stock price rose by 32.7% or 5.83% a year on average. That’s compared to an average ROE of 12.1% the bank generated for its shareholders. This closing price put stock at a 12-month trailing price to earnings (PE) of 6.16x and price to book value (PBV) of 0.643x in 2018.
 Helgi Library