By Helgi Library - March 4, 2020
Federal International Finance's net interest margin amounted to 21.6% in the second quarter of 2019, up from 20.9% when compared...
By Helgi Library - March 4, 2020
Federal International Finance generated total banking revenues of IDR 1,959 bil in the second quarter of 2019, up 5.32% when comp...
By Helgi Library - March 4, 2020
Federal International Finance's Equity reached 18.1% of total assets in the 2Q2019, up from 16.0% for the previous year. As a sh...
| Profit Statement | Dec 2018 | Mar 2019 | Jun 2019 | |
| Net Interest Income | IDR bil | 1,959 | 1,816 | 1,917 |
| Net Fee Income | IDR bil | -20.6 | -12.5 | -13.0 |
| Other Income | IDR bil | 50.3 | 55.8 | 54.7 |
| Total Revenues | IDR bil | 1,988 | 1,859 | 1,959 |
| Staff Cost | IDR bil | 360 | 386 | 369 |
| Operating Profit | IDR bil | 1,251 | 1,158 | 1,237 |
| Provisions | IDR bil | 407 | 300 | 353 |
| Net Profit | IDR bil | 591 | 604 | 624 |
| Balance Sheet | Dec 2018 | Mar 2019 | Jun 2019 | |
| Customer Loans | IDR bil | 32,090 | 32,347 | 33,288 |
| Total Assets | IDR bil | 33,796 | 35,541 | 35,526 |
| Shareholders' Equity | IDR bil | 6,007 | 6,590 | 6,415 |
| Interbank Borrowing | IDR bil | 7,391 | 5,423 | 7,274 |
| Customer Deposits | IDR bil | ... | 0 | ... |
| Issued Debt Securities | IDR bil | 18,556 | 21,101 | 19,361 |
| Ratios | Dec 2018 | Mar 2019 | Jun 2019 | |
| ROE | % | 40.2 | 38.4 | 38.4 |
| ROA | % | 7.01 | 6.97 | 7.03 |
| Costs (As % Of Assets) | % | 8.76 | 8.09 | 8.12 |
| Costs (As % Of Income) | % | 37.1 | 37.7 | 36.8 |
| Net Interest Margin | % | 23.3 | 20.9 | 21.6 |
| NPLs (As % Of Loans) | % | ... | ... | ... |
| Provisions (As % Of NPLs) | % | ... | ... | ... |
| Growth Rates | Dec 2018 | Mar 2019 | Jun 2019 | |
| Total Revenue Growth | % | 15.5 | 6.32 | 5.32 |
| Operating Cost Growth | % | 10.1 | 22.2 | -4.21 |
| Operating Profit Growth | % | 18.9 | -1.45 | 11.8 |
| Net Profit Growth | % | 10.1 | 11.6 | 7.94 |
| Customer Loan Growth | % | 9.63 | 10.8 | 8.90 |
| Total Asset Growth | % | 9.90 | 16.5 | 10.4 |
| Shareholders' Equity Growth | % | 12.6 | 12.6 | 24.7 |
| Employees | 17,162 | 16,869 | 16,927 | |
Get all company financials in excel:
| summary | Unit | Mar 2013 | Jun 2013 | Sep 2013 | Dec 2013 | Mar 2014 | Jun 2014 | Sep 2014 | Dec 2014 | Mar 2015 | Jun 2015 | Sep 2015 | Dec 2015 | Mar 2016 | Jun 2016 | Sep 2016 | Dec 2016 | Mar 2017 | Jun 2017 | Sep 2017 | Dec 2017 | Mar 2018 | Jun 2018 | Sep 2018 | Dec 2018 | Mar 2019 | Jun 2019 |
| income statement | |||||||||||||||||||||||||||
| Net Interest Income | IDR bil | 1,705 | 1,733 | 1,872 | 1,858 | 1,959 | |||||||||||||||||||||
| Total Revenues | IDR bil | 1,722 | 1,748 | 1,860 | 1,905 | 1,988 | |||||||||||||||||||||
| Operating Profit | IDR bil | 1,052 | 1,175 | 1,107 | 1,193 | 1,251 | |||||||||||||||||||||
| Net Profit | IDR bil | 536 | 542 | 578 | 605 | 591 | |||||||||||||||||||||
| balance sheet | |||||||||||||||||||||||||||
| Customer Loans | IDR bil | 29,272 | 29,200 | 30,566 | 31,294 | 32,090 | |||||||||||||||||||||
| Debt Securities | IDR bil | ... | ... | ... | ... | ... | ... | ... | ... | ... | ... | ... | ... | ... | ... | ... | ... | 0 | 0 | 0 | ... | ... | ... | ... | |||
| Total Assets | IDR bil | 30,753 | 30,515 | 32,192 | 33,582 | 33,796 | |||||||||||||||||||||
| Shareholders' Equity | IDR bil | 5,332 | 5,850 | 5,144 | 5,758 | 6,007 | |||||||||||||||||||||
| Interbank Borrowing | IDR bil | ... | ... | ... | 8,438 | 7,864 | 6,769 | 6,876 | 7,391 | ||||||||||||||||||
| Customer Deposits | IDR bil | ... | ... | ... | ... | ... | ... | ... | ... | ... | 0 | 0 | 0 | ... | ... | ... | |||||||||||
| Issued Debt Securities | IDR bil | 15,403 | 14,742 | 18,144 | 18,653 | 18,556 | |||||||||||||||||||||
| ratios | |||||||||||||||||||||||||||
| ROE | % | ... | 40.0 | 38.7 | 42.1 | 44.4 | 40.2 | ||||||||||||||||||||
| ROA | % | ... | 7.00 | 7.07 | 7.38 | 7.35 | 7.01 | ||||||||||||||||||||
| Costs (As % Of Assets) | % | ... | 8.75 | 7.49 | 9.61 | 8.66 | 8.76 | ||||||||||||||||||||
| Costs (As % Of Income) | % | 38.9 | 32.8 | 40.5 | 37.4 | 37.1 | |||||||||||||||||||||
| Net Interest Margin | % | ... | 22.3 | 22.6 | 23.9 | 22.6 | 23.3 | ||||||||||||||||||||
| Interest Income (As % Of Revenues) | % | 99.0 | 99.1 | 101 | 97.5 | 98.5 | |||||||||||||||||||||
| Fee Income (As % Of Revenues) | % | ... | ... | ... | ... | ... | ... | ... | -2.25 | -2.70 | -3.30 | -0.755 | -1.04 | ||||||||||||||
| Staff Cost (As % Of Total Cost) | % | 46.1 | 62.0 | 46.5 | 51.2 | 48.8 | |||||||||||||||||||||
| Equity (As % Of Assets) | % | 17.3 | 19.2 | 16.0 | 17.1 | 17.8 | |||||||||||||||||||||
| Loans (As % Assets) | % | 95.2 | 95.7 | 95.0 | 93.2 | 95.0 | |||||||||||||||||||||
| NPLs (As % Of Loans) | % | ... | ... | ... | ... | ... | ... | ... | ... | ... | ... | ... | ... | ... | ... | ... | ... | ... | ... | ... | ... | ... | ... | ... | ... | ||
| Provisions (As % Of NPLs) | % | ... | ... | ... | ... | ... | ... | ... | ... | ... | ... | ... | ... | ... | ... | ... | ... | ... | ... | ... | ... | ... | ... | ... | ... | ||
| valuation | |||||||||||||||||||||||||||
| Number Of Shares (Average) | mil | 280 | 280 | 280 | 280 | 280 | |||||||||||||||||||||
| Earnings Per Share (EPS) | IDR | 7,662 | 7,736 | 8,261 | 8,637 | 8,437 | |||||||||||||||||||||
| Book Value Per Share | IDR | 19,044 | 20,893 | 18,371 | 20,564 | 21,453 | |||||||||||||||||||||
| Earnings Per Share Growth | % | ... | ... | ... | ... | 2.58 | 22.0 | 18.9 | 15.3 | 10.1 | |||||||||||||||||
| Book Value Per Share Growth | % | ... | ... | ... | ... | 7.61 | 9.59 | 5.18 | 6.82 | 12.6 |
| income statement | Unit | Mar 2013 | Jun 2013 | Sep 2013 | Dec 2013 | Mar 2014 | Jun 2014 | Sep 2014 | Dec 2014 | Mar 2015 | Jun 2015 | Sep 2015 | Dec 2015 | Mar 2016 | Jun 2016 | Sep 2016 | Dec 2016 | Mar 2017 | Jun 2017 | Sep 2017 | Dec 2017 | Mar 2018 | Jun 2018 | Sep 2018 | Dec 2018 | Mar 2019 | Jun 2019 |
| income statement | |||||||||||||||||||||||||||
| Interest Income | IDR bil | 2,191 | 2,228 | 2,381 | 2,339 | 2,432 | |||||||||||||||||||||
| Interest Cost | IDR bil | 486 | 494 | 509 | 482 | 473 | |||||||||||||||||||||
| Net Interest Income | IDR bil | 1,705 | 1,733 | 1,872 | 1,858 | 1,959 | |||||||||||||||||||||
| Net Fee Income | IDR bil | ... | ... | ... | ... | ... | ... | ... | -38.7 | -47.2 | -61.3 | -14.4 | -20.6 | ||||||||||||||
| Other Income | IDR bil | ... | ... | ... | ... | ... | ... | ... | 55.9 | 62.1 | 49.2 | 62.3 | 50.3 | ||||||||||||||
| Total Revenues | IDR bil | 1,722 | 1,748 | 1,860 | 1,905 | 1,988 | |||||||||||||||||||||
| Staff Cost | IDR bil | 309 | 356 | 350 | 365 | 360 | |||||||||||||||||||||
| Depreciation | IDR bil | ... | ... | ... | ... | ... | ... | ... | ... | ... | ... | ... | ... | ... | ... | ... | ... | 37.5 | 36.3 | 38.7 | 39.0 | 41.5 | |||||
| Other Cost | IDR bil | ... | ... | ... | ... | ... | ... | ... | ... | ... | ... | ... | ... | ... | ... | ... | ... | 323 | 181 | 364 | 308 | 336 | |||||
| Operating Cost | IDR bil | 670 | 573 | 753 | 712 | 738 | |||||||||||||||||||||
| Operating Profit | IDR bil | 1,052 | 1,175 | 1,107 | 1,193 | 1,251 | |||||||||||||||||||||
| Provisions | IDR bil | 280 | 390 | 287 | 321 | 407 | |||||||||||||||||||||
| Extra and Other Cost | IDR bil | 54.7 | 60.5 | 48.0 | 62.0 | 48.4 | |||||||||||||||||||||
| Pre-Tax Profit | IDR bil | 717 | 724 | 772 | 810 | 795 | |||||||||||||||||||||
| Tax | IDR bil | 181 | 182 | 193 | 205 | 204 | |||||||||||||||||||||
| Minorities | IDR bil | 0 | 0 | 0 | 0 | 0 | |||||||||||||||||||||
| Net Profit | IDR bil | 536 | 542 | 578 | 605 | 591 | |||||||||||||||||||||
| growth rates | |||||||||||||||||||||||||||
| Net Interest Income Growth | % | ... | ... | ... | ... | 0.439 | 12.9 | 17.0 | 13.1 | 14.9 | |||||||||||||||||
| Net Fee Income Growth | % | ... | ... | ... | ... | ... | ... | ... | ... | ... | ... | ... | 21.2 | 77.3 | 212 | -54.7 | -46.9 | ||||||||||
| Total Revenue Growth | % | ... | ... | ... | ... | 5.20 | 11.8 | 15.0 | 14.4 | 15.5 | |||||||||||||||||
| Operating Cost Growth | % | ... | ... | ... | ... | 40.4 | -6.63 | 29.0 | 20.2 | 10.1 | |||||||||||||||||
| Operating Profit Growth | % | ... | ... | ... | ... | -9.28 | 23.8 | 7.08 | 11.2 | 18.9 | |||||||||||||||||
| Pre-Tax Profit Growth | % | ... | ... | ... | ... | -20.3 | 21.5 | 18.9 | 15.4 | 10.8 | |||||||||||||||||
| Net Profit Growth | % | ... | ... | ... | ... | 2.58 | 22.0 | 18.9 | 15.3 | 10.1 | |||||||||||||||||
| market share | |||||||||||||||||||||||||||
| Market Share in Revenues | % | ... | ... | ... | ... | ... | ... | ... | ... | ... | ... | ... | |||||||||||||||
| Market Share in Net Profit | % | ... | ... | ... | ... | ... | ... | ... | ... | ... | ... | ... |
| balance sheet | Unit | Mar 2013 | Jun 2013 | Sep 2013 | Dec 2013 | Mar 2014 | Jun 2014 | Sep 2014 | Dec 2014 | Mar 2015 | Jun 2015 | Sep 2015 | Dec 2015 | Mar 2016 | Jun 2016 | Sep 2016 | Dec 2016 | Mar 2017 | Jun 2017 | Sep 2017 | Dec 2017 | Mar 2018 | Jun 2018 | Sep 2018 | Dec 2018 | Mar 2019 | Jun 2019 |
| balance sheet | |||||||||||||||||||||||||||
| Cash | IDR bil | 691 | 464 | 451 | 865 | 484 | |||||||||||||||||||||
| Customer Loans | IDR bil | 29,272 | 29,200 | 30,566 | 31,294 | 32,090 | |||||||||||||||||||||
| Retail Loans | IDR bil | ... | ... | ... | ... | ... | ... | ... | ... | ... | ... | ... | ... | ... | ... | ... | 30,737 | 30,701 | 32,159 | 32,923 | 33,797 | ||||||
| Debt Securities | IDR bil | ... | ... | ... | ... | ... | ... | ... | ... | ... | ... | ... | ... | ... | ... | ... | ... | 0 | 0 | 0 | ... | ... | ... | ... | |||
| Fixed Assets | IDR bil | 361 | 356 | 360 | 351 | 381 | |||||||||||||||||||||
| Total Assets | IDR bil | 30,753 | 30,515 | 32,192 | 33,582 | 33,796 | |||||||||||||||||||||
| Shareholders' Equity | IDR bil | 5,332 | 5,850 | 5,144 | 5,758 | 6,007 | |||||||||||||||||||||
| Of Which Minority Interest | IDR bil | 0 | 0 | 0 | 0 | 0.087 | |||||||||||||||||||||
| Liabilities | IDR bil | 25,420 | 24,665 | 27,048 | 27,824 | 27,789 | |||||||||||||||||||||
| Interbank Borrowing | IDR bil | ... | ... | ... | 8,438 | 7,864 | 6,769 | 6,876 | 7,391 | ||||||||||||||||||
| Customer Deposits | IDR bil | ... | ... | ... | ... | ... | ... | ... | ... | ... | 0 | 0 | 0 | ... | ... | ... | |||||||||||
| Issued Debt Securities | IDR bil | 15,403 | 14,742 | 18,144 | 18,653 | 18,556 | |||||||||||||||||||||
| asset quality | |||||||||||||||||||||||||||
| Non-Performing Loans | IDR bil | ... | ... | ... | ... | ... | ... | ... | ... | ... | ... | ... | ... | ... | ... | ... | ... | ... | ... | ... | ... | ... | ... | ... | ... | ||
| Gross Loans | IDR bil | 30,737 | 30,701 | 32,159 | 32,923 | 33,797 | |||||||||||||||||||||
| Total Provisions | IDR bil | ... | ... | ... | 1,464 | 1,502 | 1,593 | 1,629 | 1,707 | ||||||||||||||||||
| growth rates | |||||||||||||||||||||||||||
| Customer Loan Growth | % | ... | ... | ... | ... | 4.54 | 3.68 | 5.97 | 7.87 | 9.63 | |||||||||||||||||
| Retail Loan Growth | % | ... | ... | ... | ... | ... | ... | ... | ... | ... | ... | ... | ... | ... | ... | ... | ... | ... | ... | ... | 4.87 | 4.05 | 6.28 | 8.06 | 9.96 | ||
| Total Asset Growth | % | ... | ... | ... | ... | 4.56 | 3.39 | 6.12 | 10.1 | 9.90 | |||||||||||||||||
| Shareholders' Equity Growth | % | ... | ... | ... | ... | 7.61 | 9.59 | 5.18 | 6.82 | 12.6 | |||||||||||||||||
| market share | |||||||||||||||||||||||||||
| Market Share in Customer Loans | % | ... | ... | ... | ... | ... | ... | ... | ... | ... | ... | ... | |||||||||||||||
| Market Share in Total Assets | % | ... | ... | ... | ... | ... | ... | ... | ... | ... | ... | ... | |||||||||||||||
| Market Share in Customer Deposits | % | ... | ... | ... | ... | ... | ... | ... | ... | ... | ... | ... | ... | ... | ... | ... | ... | ... | ... | ... | ... |
| ratios | Unit | Mar 2013 | Jun 2013 | Sep 2013 | Dec 2013 | Mar 2014 | Jun 2014 | Sep 2014 | Dec 2014 | Mar 2015 | Jun 2015 | Sep 2015 | Dec 2015 | Mar 2016 | Jun 2016 | Sep 2016 | Dec 2016 | Mar 2017 | Jun 2017 | Sep 2017 | Dec 2017 | Mar 2018 | Jun 2018 | Sep 2018 | Dec 2018 | Mar 2019 | Jun 2019 |
| ratios | |||||||||||||||||||||||||||
| ROE | % | ... | 40.0 | 38.7 | 42.1 | 44.4 | 40.2 | ||||||||||||||||||||
| ROA | % | ... | 7.00 | 7.07 | 7.38 | 7.35 | 7.01 | ||||||||||||||||||||
| Costs (As % Of Assets) | % | ... | 8.75 | 7.49 | 9.61 | 8.66 | 8.76 | ||||||||||||||||||||
| Costs (As % Of Income) | % | 38.9 | 32.8 | 40.5 | 37.4 | 37.1 | |||||||||||||||||||||
| Net Interest Margin | % | ... | 22.3 | 22.6 | 23.9 | 22.6 | 23.3 | ||||||||||||||||||||
| Interest Spread | % | ... | 20.9 | 21.2 | 22.5 | 21.4 | 22.1 | ||||||||||||||||||||
| Asset Yield | % | ... | 28.6 | 29.1 | 30.4 | 28.5 | 28.9 | ||||||||||||||||||||
| Cost Of Liabilities | % | ... | 7.70 | 7.90 | 7.87 | 7.03 | 6.81 | ||||||||||||||||||||
| Interest Income (As % Of Revenues) | % | 99.0 | 99.1 | 101 | 97.5 | 98.5 | |||||||||||||||||||||
| Fee Income (As % Of Revenues) | % | ... | ... | ... | ... | ... | ... | ... | -2.25 | -2.70 | -3.30 | -0.755 | -1.04 | ||||||||||||||
| Other Income (As % Of Revenues) | % | ... | ... | ... | ... | ... | ... | ... | 3.25 | 3.55 | 2.64 | 3.27 | 2.53 | ||||||||||||||
| Cost Per Employee | USD per month | 437 | 509 | 483 | 484 | 475 | |||||||||||||||||||||
| Cost Per Employee (Local Currency) | IDR per month | 5,903,670 | 6,949,170 | 6,796,830 | 7,098,230 | 6,990,440 | |||||||||||||||||||||
| Staff Cost (As % Of Total Cost) | % | 46.1 | 62.0 | 46.5 | 51.2 | 48.8 | |||||||||||||||||||||
| Equity (As % Of Assets) | % | 17.3 | 19.2 | 16.0 | 17.1 | 17.8 | |||||||||||||||||||||
| Loans (As % Assets) | % | 95.2 | 95.7 | 95.0 | 93.2 | 95.0 | |||||||||||||||||||||
| NPLs (As % Of Loans) | % | ... | ... | ... | ... | ... | ... | ... | ... | ... | ... | ... | ... | ... | ... | ... | ... | ... | ... | ... | ... | ... | ... | ... | ... | ||
| Provisions (As % Of NPLs) | % | ... | ... | ... | ... | ... | ... | ... | ... | ... | ... | ... | ... | ... | ... | ... | ... | ... | ... | ... | ... | ... | ... | ... | ... | ||
| Provisions (As % Of Loans) | % | ... | ... | ... | 5.00 | 5.14 | 5.21 | 5.21 | 5.32 | ||||||||||||||||||
| Cost of Provisions (As % Of Loans) | % | ... | 3.85 | 5.34 | 3.84 | 4.16 | 5.14 |
| other data | Unit | Mar 2013 | Jun 2013 | Sep 2013 | Dec 2013 | Mar 2014 | Jun 2014 | Sep 2014 | Dec 2014 | Mar 2015 | Jun 2015 | Sep 2015 | Dec 2015 | Mar 2016 | Jun 2016 | Sep 2016 | Dec 2016 | Mar 2017 | Jun 2017 | Sep 2017 | Dec 2017 | Mar 2018 | Jun 2018 | Sep 2018 | Dec 2018 | Mar 2019 | Jun 2019 |
| other data | |||||||||||||||||||||||||||
| Employees | 17,452 | 17,064 | 17,185 | 17,141 | 17,162 | ||||||||||||||||||||||
| Return on Loans | % | ... | 6.83 | 7.14 | 7.30 | 7.31 | 7.30 | ||||||||||||||||||||
| Operating Profit (As % of Loans) | % | ... | ... | ... | 14.1 | 14.8 | 14.7 | 14.6 | 14.9 | ||||||||||||||||||
| Costs (As % Of Loans) | % | ... | 8.54 | 8.32 | 8.77 | 9.01 | 9.02 | ||||||||||||||||||||
| Equity (As % Of Loans) | % | 18.2 | 20.0 | 16.8 | 18.4 | 18.7 |
Get all company financials in excel:


By Helgi Library - March 4, 2020
Federal International Finance's customer deposits reached IDR 0 bil in 2015-12-31, down 0% compared to the previous year. Indonesian banking sector accepted customer deposits of IDR 4,073,547 bil in 2015-12-31, down 1.14% when compared to the last year. F...
By Helgi Library - March 4, 2020
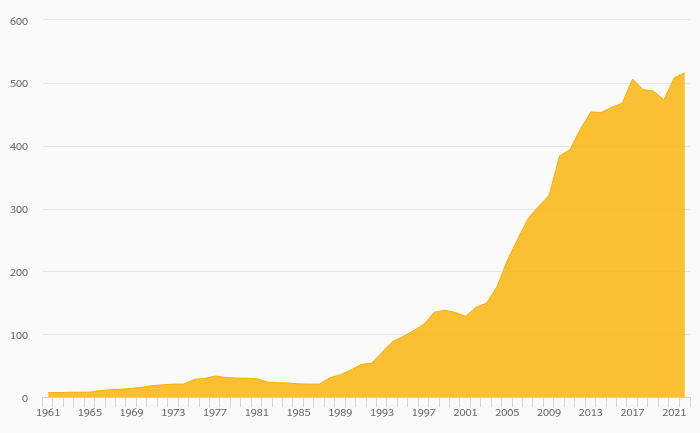
Federal International Finance generated total banking revenues of IDR 7,502 bil in 2018, up 14.2% compared to the previous year. Historically, the bank’s revenues containing of interest, fee and other non-interest income reached an all time high of IDR 7,502 bi...
By Helgi Library - March 4, 2020
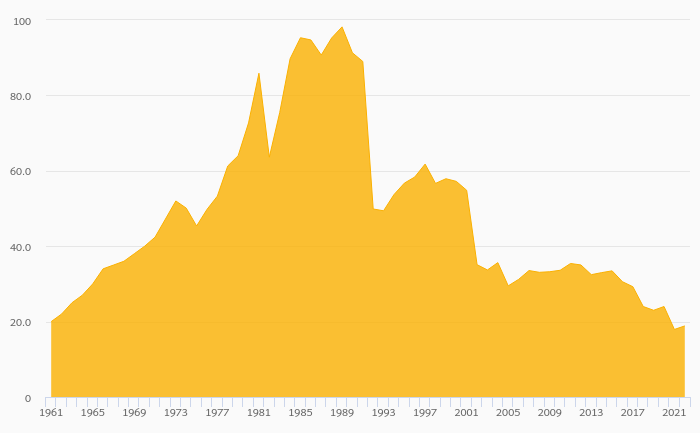
Federal International Finance's net interest margin amounted to 23.0% in 2018, up from 21.6% compared to the previous year. Historically, the bank’s net interest margin reached an all time high of 40.4% in 2009 and an all time low of 19.1% in 2013. The ...
By Helgi Library - March 4, 2020
Federal International Finance generated total banking revenues of IDR 6,568 bil in 2017, up 5.94% compared to the previous year. Indonesian banking sector banking sector generated total revenues of IDR 516,680,067 mil in 2017, up 2.44% when compared t...
By Helgi Library - March 4, 2020
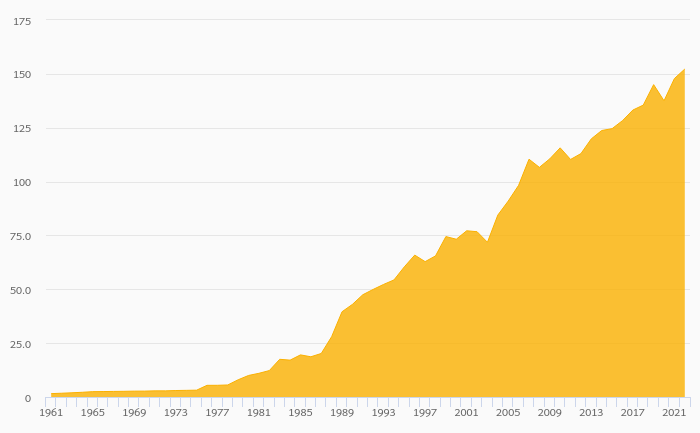
Federal International Finance's customer loans reached IDR 29,272 bil in 2017, up 4.54% compared to the previous year. Indonesian banking sector provided customer loans of IDR 4,736,963 bil in 2017, up 8.70% when compared to the last year. Federal Interna...
By Helgi Library - March 4, 2020
Federal International Finance's customer deposits reached IDR 0 bil in 2017, down 0% compared to the previous year. Indonesian banking sector accepted customer deposits of IDR 4,920,427 bil in 2017, up 8.86% when compared to the last year. Federal Interna...
By Helgi Library - March 4, 2020
Federal International Finance generated total banking revenues of IDR 1,659 bil in 2016-09-30, up 10.4% compared to the previous year. Indonesian banking sector banking sector generated total revenues of IDR 119,255,024 mil in 2016-09-30, up 4.32% whe...
By Helgi Library - March 4, 2020
Federal International Finance's customer loans reached IDR 27,037 bil in 2016-09-30, up 1.39% compared to the previous year. Indonesian banking sector provided customer loans of IDR 4,266,074 bil in 2016-09-30, up 1.34% when compared to the last year. Fed...

Federal International Finance has been growing its revenues and asset by 11.1% and 5.56% a year on average in the last 3 years. Its loans and deposits have grown by 7.32% and % a year during that time and loans to deposits ratio reached at the end of 2018. The company achieved an average return on equity of 37.8% in the last three years with net profit growing 15.4% a year on average. In terms of operating efficiency, its cost to income ratio reached 37.0% in 2018, compared to 38.7% average in the last three years.
Equity represented 17.8% of total assets or 18.7% of loans at the end of 2018. Federal International Finance's non-performing loans were of total loans while provisions covered some of NPLs at the end of 2018.
 Helgi Library