By Helgi Library - May 11, 2022
La Bottega Gastronomica made a net profit of CZK 0.739 mil with revenues of CZK 15.3 mil in 2020, up by 127% and down b...
By Helgi Library - May 11, 2022
La Bottega Gastronomica made a net profit of CZK 0.739 mil with revenues of CZK 15.3 mil in 2020, up by 127% and down b...
By Helgi Library - May 11, 2022
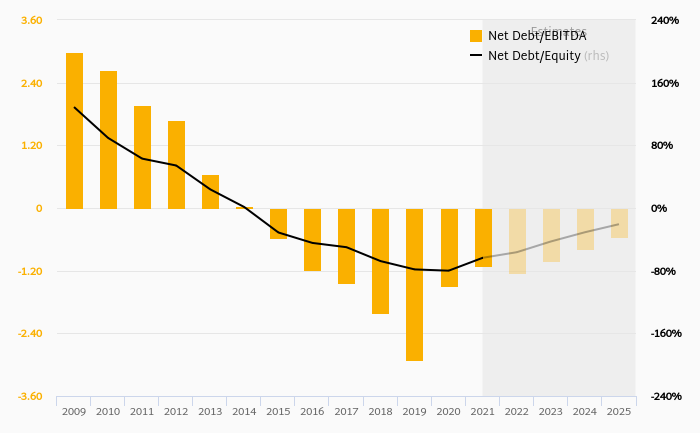
La Bottega Gastronomica's net debt stood at CZK 9.34 mil and accounted for -141% of equity at the end of 2020. The ratio is ...
| Profit Statement | 2018 | 2019 | 2020 | |
| Sales | CZK mil | 27.0 | 24.7 | 15.3 |
| Gross Profit | CZK mil | 6.29 | 4.84 | 4.38 |
| EBITDA | CZK mil | -0.311 | -1.99 | 1.24 |
| EBIT | CZK mil | -0.311 | -2.52 | 0.829 |
| Pre-Tax Profit | CZK mil | -1.14 | -2.69 | 0.739 |
| Net Profit | CZK mil | -1.14 | -2.69 | 0.739 |
| Balance Sheet | 2018 | 2019 | 2020 | |
| Total Assets | CZK mil | 9.05 | 5.56 | 6.10 |
| Non-Current Assets | CZK mil | 2.81 | 2.28 | 1.86 |
| Current Assets | CZK mil | 3.87 | 3.19 | 4.22 |
| Working Capital | CZK mil | -7.07 | -2.89 | -0.040 |
| Shareholders' Equity | CZK mil | -4.66 | -7.35 | -6.61 |
| Liabilities | CZK mil | 13.7 | 12.9 | 12.7 |
| Total Debt | CZK mil | 0.374 | 7.54 | 10.9 |
| Net Debt | CZK mil | -1.52 | 6.09 | 9.34 |
| Ratios | 2018 | 2019 | 2020 | |
| ROE | % | 27.9 | 44.8 | -10.6 |
| ROCE | % | 35.9 | 111 | 122 |
| Gross Margin | % | 23.3 | 19.6 | 28.7 |
| EBITDA Margin | % | -1.15 | -8.04 | 8.14 |
| EBIT Margin | % | -1.15 | -10.2 | 5.43 |
| Net Margin | % | -4.22 | -10.9 | 4.84 |
| Net Debt/EBITDA | 4.90 | -3.07 | 7.51 | |
| Net Debt/Equity | % | 32.7 | -82.8 | -141 |
| Cash Flow | 2018 | 2019 | 2020 | |
| Cash Conversion Cycle | days | -125 | -53.4 | -4.03 |
| Cash Earnings | CZK mil | -1.14 | -2.16 | 1.15 |
Get all company financials in excel:
| overview | Unit | 2016 | 2017 | 2018 | 2019 | 2020 |
| income statement | ||||||
| Sales | CZK mil | 19.4 | 26.8 | 27.0 | ||
| Gross Profit | CZK mil | -1.37 | 5.81 | 6.29 | ||
| EBIT | CZK mil | -5.04 | 0.439 | -0.311 | ||
| Net Profit | CZK mil | -5.17 | -0.087 | -1.14 | ||
| ROE | % | -59.7 | -3.39 | 27.9 | ||
| EBIT Margin | % | -26.0 | 1.64 | -1.15 | ||
| Net Margin | % | -26.6 | -0.325 | -4.22 | ||
| Employees | ... | ... | 18.0 | |||
| balance sheet | ||||||
| Total Assets | CZK mil | 2.80 | 7.37 | 9.05 | ||
| Non-Current Assets | CZK mil | 0.874 | 1.26 | 2.81 | ||
| Current Assets | CZK mil | 1.90 | 4.88 | 3.87 | ||
| Shareholders' Equity | CZK mil | 8.66 | -3.52 | -4.66 | ||
| Liabilities | CZK mil | -5.85 | 10.9 | 13.7 | ||
| Non-Current Liabilities | CZK mil | 0 | 0 | 0.374 | ||
| Current Liabilities | CZK mil | 11.2 | 10.5 | 13.3 | ||
| Net Debt/EBITDA | 0.232 | -2.42 | 4.90 | |||
| Net Debt/Equity | % | -11.8 | 30.2 | 32.7 |
| income statement | Unit | 2016 | 2017 | 2018 | 2019 | 2020 |
| income statement | ||||||
| Sales | CZK mil | 19.4 | 26.8 | 27.0 | ||
| Cost of Goods & Services | CZK mil | 20.8 | 21.0 | 20.7 | ||
| Gross Profit | CZK mil | -1.37 | 5.81 | 6.29 | ||
| Staff Cost | CZK mil | 2.96 | 5.37 | 6.75 | ||
| Other Operating Cost (Income) | CZK mil | 0.086 | 0.003 | -0.148 | ||
| EBITDA | CZK mil | -4.41 | 0.439 | -0.311 | ||
| Depreciation | CZK mil | 0.625 | 0 | 0 | ||
| EBIT | CZK mil | -5.04 | 0.439 | -0.311 | ||
| Net Financing Cost | CZK mil | 0.126 | 0.526 | 0.829 | ||
| Extraordinary Cost | CZK mil | 0 | 0 | 0 | ||
| Pre-Tax Profit | CZK mil | -5.17 | -0.087 | -1.14 | ||
| Tax | CZK mil | 0 | 0 | 0 | ||
| Net Profit | CZK mil | -5.17 | -0.087 | -1.14 | ||
| Net Profit Avail. to Common | CZK mil | -5.17 | -0.087 | -1.14 | ||
| growth rates | ||||||
| Total Revenue Growth | % | ... | 38.0 | 1.01 | ||
| Staff Cost Growth | % | ... | 81.3 | 25.7 | ||
| EBITDA Growth | % | ... | -110 | -171 | ||
| EBIT Growth | % | ... | -109 | -171 | ||
| Pre-Tax Profit Growth | % | ... | -98.3 | 1,210 | ||
| Net Profit Growth | % | ... | -98.3 | 1,210 | ||
| ratios | ||||||
| ROE | % | -59.7 | -3.39 | 27.9 | ||
| ROA | % | -184 | -1.71 | -13.9 | ||
| ROCE | % | ... | 2.26 | 35.9 | ||
| Gross Margin | % | -7.04 | 21.7 | 23.3 | ||
| EBITDA Margin | % | -22.8 | 1.64 | -1.15 | ||
| EBIT Margin | % | -26.0 | 1.64 | -1.15 | ||
| Net Margin | % | -26.6 | -0.325 | -4.22 | ||
| Net Debt/EBITDA | 0.232 | -2.42 | 4.90 |
| balance sheet | Unit | 2016 | 2017 | 2018 | 2019 | 2020 |
| balance sheet | ||||||
| Cash & Cash Equivalents | CZK mil | 1.02 | 1.06 | 1.90 | ||
| Receivables | CZK mil | 0.252 | 0.098 | 0.101 | ||
| Inventories | CZK mil | 0 | 2.82 | 0.820 | ||
| Other ST Assets | CZK mil | 0.628 | 0.901 | 1.05 | ||
| Current Assets | CZK mil | 1.90 | 4.88 | 3.87 | ||
| Property, Plant & Equipment | CZK mil | 0.871 | 1.25 | 2.81 | ||
| LT Investments & Receivables | CZK mil | < 0.001 | < -0.001 | < 0.001 | ||
| Intangible Assets | CZK mil | 0.003 | 0.003 | 0.003 | ||
| Goodwill | CZK mil | 0 | 0 | 0 | ||
| Non-Current Assets | CZK mil | 0.874 | 1.26 | 2.81 | ||
| Total Assets | CZK mil | 2.80 | 7.37 | 9.05 | ||
| Trade Payables | CZK mil | 6.73 | 6.27 | 7.99 | ||
| Short-Term Debt | CZK mil | 0 | 0 | 0 | ||
| Other ST Liabilities | CZK mil | 4.49 | 4.18 | 5.32 | ||
| Current Liabilities | CZK mil | 11.2 | 10.5 | 13.3 | ||
| Long-Term Debt | CZK mil | 0 | 0 | 0.374 | ||
| Other LT Liabilities | CZK mil | 0 | 0 | 0 | ||
| Non-Current Liabilities | CZK mil | 0 | 0 | 0.374 | ||
| Liabilities | CZK mil | -5.85 | 10.9 | 13.7 | ||
| Equity Before Minority Interest | CZK mil | 8.66 | -3.52 | -4.66 | ||
| Minority Interest | CZK mil | 0 | 0 | 0 | ||
| Equity | CZK mil | 8.66 | -3.52 | -4.66 | ||
| growth rates | ||||||
| Total Asset Growth | % | ... | 163 | 22.9 | ||
| Shareholders' Equity Growth | % | ... | -141 | 32.4 | ||
| Net Debt Growth | % | ... | 3.71 | 43.4 | ||
| Total Debt Growth | % | ... | ... | ... | ||
| ratios | ||||||
| Total Debt | CZK mil | 0 | 0 | 0.374 | ||
| Net Debt | CZK mil | -1.02 | -1.06 | -1.52 | ||
| Working Capital | CZK mil | -6.48 | -3.36 | -7.07 | ||
| Capital Employed | CZK mil | -5.60 | -2.10 | -4.25 | ||
| Net Debt/Equity | % | -11.8 | 30.2 | 32.7 | ||
| Current Ratio | 0.170 | 0.467 | 0.291 | |||
| Quick Ratio | 0.114 | 0.111 | 0.150 |
| cash flow | Unit | 2016 | 2017 | 2018 | 2019 | 2020 |
| cash flow | ||||||
| Net Profit | CZK mil | -5.17 | -0.087 | -1.14 | ||
| Depreciation | CZK mil | 0.625 | 0 | 0 | ||
| ratios | ||||||
| Days Sales Outstanding | days | 4.74 | 1.34 | 1.36 | ||
| Days Sales Of Inventory | days | 0 | 49.1 | 14.4 | ||
| Days Payable Outstanding | days | 118 | 109 | 141 | ||
| Cash Conversion Cycle | days | -114 | -58.8 | -125 | ||
| Cash Earnings | CZK mil | -4.54 | -0.087 | -1.14 |
| other ratios | Unit | 2016 | 2017 | 2018 | 2019 | 2020 |
| Employees | ... | ... | 18.0 | |||
| Cost Per Employee | USD per month | ... | ... | 1,429 | ||
| Cost Per Employee (Local Currency) | CZK per month | ... | ... | 31,259 | ||
| Material & Energy (As % of Sales) | % | 86.4 | 58.6 | 58.8 | ||
| Services (As % of Sales) | % | 20.7 | 19.7 | 17.9 | ||
| Staff Cost (As % of Sales) | % | 15.3 | 20.1 | 25.0 | ||
| Effective Tax Rate | % | 0 | 0 | 0 |
Get all company financials in excel:


By Helgi Library - May 11, 2022
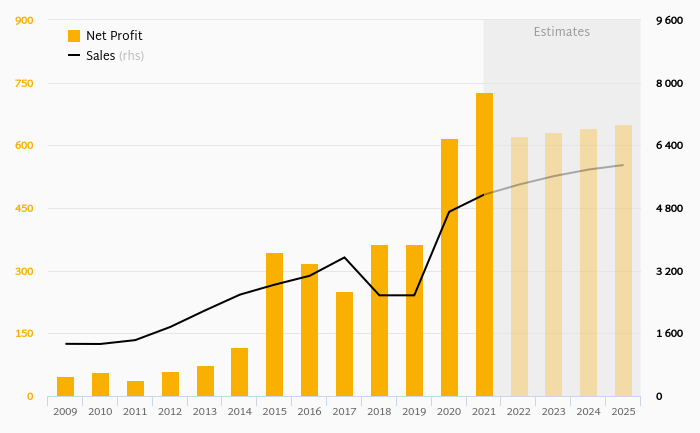
La Bottega Gastronomica made a net profit of CZK 0.739 mil with revenues of CZK 15.3 mil in 2020, up by 127% and down by 38.1%, respectively, compared to the previous year. This translates into a net margin of 4.84%. Historically, between 2016 and 2020,...
By Helgi Library - May 11, 2022
La Bottega Gastronomica's net debt stood at CZK 9.34 mil and accounted for -141% of equity at the end of 2020. The ratio is down 58.4 pp compared to the previous year. Historically, the firm’s net debt to equity reached a high of 32.7% in 2018 and ...
By Helgi Library - May 11, 2022
La Bottega Gastronomica made a net profit of CZK 0.739 mil with revenues of CZK 15.3 mil in 2020, up by 127% and down by 38.1%, respectively, compared to the previous year. This translates into a net margin of 4.84%. Historically, between 2016 and 2020,...

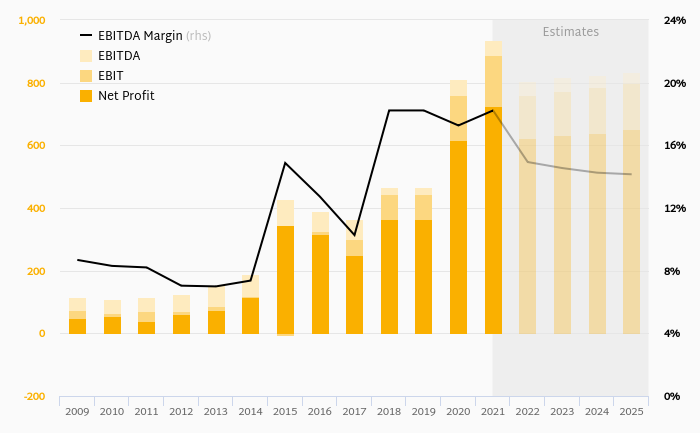
La Bottega Gastronomica has been growing its sales by a year on average in the last 5 years. EBITDA has grown by 0% during that time to total of CZK 1.24 mil in 2020, or 8.14% of sales. That’s compared to -4.43% average margin seen in last five years.
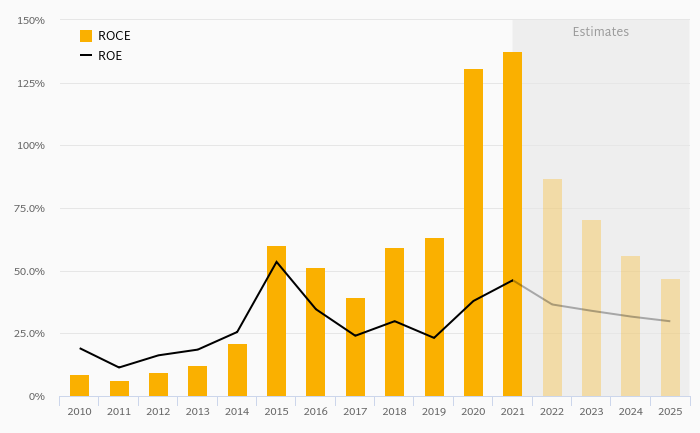
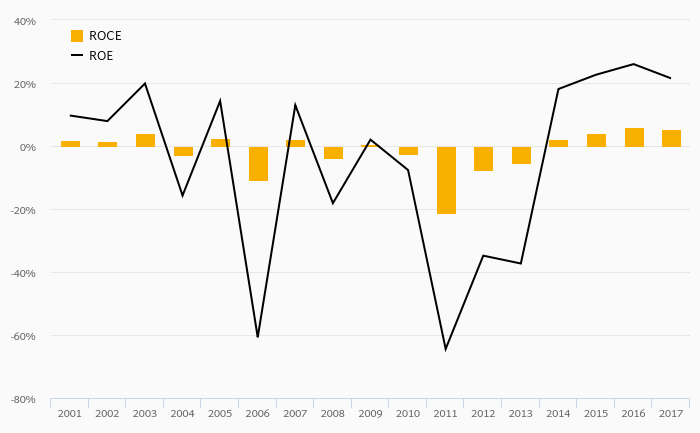
The company netted CZK 0.739 mil in 2020 implying ROE of -10.6% and ROCE of 122%. Again, the average figures were -0.189% and 67.8%, respectively when looking at the previous 5 years.
La Bottega Gastronomica’s net debt amounted to CZK 9.34 mil at the end of 2020, or -141% of equity. When compared to EBITDA, net debt was 7.51x, up when compared to average of 1.43x seen in the last 5 years.
 Helgi Library