By Helgi Library - December 12, 2019
Anadolubank's customer loans reached TRY 11,009 mil in 2017, up 25.2% compared to the previous year. Turkish banking sector pro...
By Helgi Library - December 12, 2019
Anadolubank's customer deposits reached TRY 11,841 mil in 2017, up 28.7% compared to the previous year. Turkish banking sector ...
By Helgi Library - June 30, 2018
Anadolubank made a net profit of TRY 151 mil in 2017, down 5.60% compared to the previous year. This implies a return on equity ...
| Profit Statement | 2015 | 2016 | 2017 | |
| Net Interest Income | TRY mil | 377 | 432 | 496 |
| Net Fee Income | TRY mil | 64.3 | 76.6 | 122 |
| Other Income | TRY mil | 46.1 | 84.5 | 45.9 |
| Total Revenues | TRY mil | 488 | 593 | 664 |
| Staff Cost | TRY mil | 151 | 173 | 209 |
| Operating Profit | TRY mil | 242 | 320 | 337 |
| Provisions | TRY mil | 84.2 | 113 | 143 |
| Net Profit | TRY mil | 129 | 160 | 151 |
| Balance Sheet | 2015 | 2016 | 2017 | |
| Interbank Loans | TRY mil | 68.3 | 197 | 593 |
| Customer Loans | TRY mil | 6,815 | 8,795 | 11,009 |
| Total Assets | TRY mil | 10,967 | 12,454 | 15,154 |
| Shareholders' Equity | TRY mil | 1,360 | 1,520 | 1,780 |
| Interbank Borrowing | TRY mil | 643 | 669 | 297 |
| Customer Deposits | TRY mil | 7,323 | 9,200 | 11,841 |
| Issued Debt Securities | TRY mil | 2,926 | 1,701 | 1,402 |
| Ratios | 2015 | 2016 | 2017 | |
| ROE | % | 9.99 | 11.1 | 9.17 |
| ROA | % | 1.26 | 1.37 | 1.10 |
| Costs (As % Of Assets) | % | 2.41 | 2.34 | 2.37 |
| Costs (As % Of Income) | % | 50.4 | 46.1 | 49.3 |
| Capital Adequacy Ratio | % | 14.5 | 13.8 | 14.2 |
| Net Interest Margin | % | 3.69 | 3.69 | 3.59 |
| Loans (As % Of Deposits) | % | 93.1 | 95.6 | 93.0 |
| NPLs (As % Of Loans) | % | 3.61 | 3.00 | 2.88 |
| Provisions (As % Of NPLs) | % | 75.0 | 60.6 | 42.9 |
| Growth Rates | 2015 | 2016 | 2017 | |
| Total Revenue Growth | % | -13.2 | 21.6 | 11.9 |
| Operating Cost Growth | % | -7.37 | 11.3 | 19.5 |
| Operating Profit Growth | % | -18.4 | 32.1 | 5.35 |
| Net Profit Growth | % | -5.65 | 24.0 | -5.60 |
| Customer Loan Growth | % | 9.05 | 29.1 | 25.2 |
| Total Asset Growth | % | 15.7 | 13.6 | 21.7 |
| Customer Deposit Growth | % | 12.5 | 25.6 | 28.7 |
| Shareholders' Equity Growth | % | 10.7 | 11.8 | 17.1 |
| Employees | 1,711 | 1,784 | 1,750 | |
Get all company financials in excel:
| summary | Unit | 1997 | 1998 | 1999 | 2000 | 2001 | 2002 | 2003 | 2004 | 2005 | 2006 | 2007 | 2008 | 2009 | 2010 | 2011 | 2012 | 2013 | 2014 | 2015 | 2016 | 2017 |
| income statement | ||||||||||||||||||||||
| Net Interest Income | TRY mil | ... | ... | ... | ... | ... | 255 | 415 | 313 | 358 | 377 | |||||||||||
| Total Revenues | TRY mil | ... | ... | ... | ... | ... | 299 | 509 | 404 | 562 | 488 | |||||||||||
| Operating Profit | TRY mil | ... | ... | ... | ... | ... | 133 | 290 | 174 | 297 | 242 | |||||||||||
| Net Profit | TRY mil | ... | ... | ... | ... | ... | 75.8 | 168 | 82.5 | 137 | 129 | |||||||||||
| balance sheet | ||||||||||||||||||||||
| Interbank Loans | TRY mil | ... | ... | ... | ... | ... | 247 | 161 | 143 | 284 | 68.3 | |||||||||||
| Customer Loans | TRY mil | 3,733 | 4,176 | 5,041 | 6,249 | 6,815 | ||||||||||||||||
| Debt Securities | TRY mil | ... | ... | ... | ... | ... | 973 | 948 | 1,045 | 1,269 | 1,969 | |||||||||||
| Total Assets | TRY mil | 5,781 | 6,291 | 7,483 | 9,477 | 10,967 | ||||||||||||||||
| Shareholders' Equity | TRY mil | 840 | 1,160 | 1,053 | 1,228 | 1,360 | ||||||||||||||||
| Interbank Borrowing | TRY mil | ... | ... | ... | ... | ... | 391 | 228 | 426 | 501 | 643 | |||||||||||
| Customer Deposits | TRY mil | 3,667 | 3,921 | 4,945 | 6,512 | 7,323 | ||||||||||||||||
| Issued Debt Securities | TRY mil | ... | ... | ... | ... | ... | 1,434 | 1,287 | 1,776 | 2,124 | 2,926 | |||||||||||
| ratios | ||||||||||||||||||||||
| ROE | % | ... | ... | ... | ... | ... | 9.50 | 16.8 | 7.46 | 12.0 | 9.99 | |||||||||||
| ROA | % | ... | ... | ... | ... | ... | 1.48 | 2.79 | 1.20 | 1.62 | 1.26 | |||||||||||
| Costs (As % Of Assets) | % | ... | ... | ... | ... | ... | 3.24 | 3.63 | 3.34 | 3.13 | 2.41 | |||||||||||
| Costs (As % Of Income) | % | ... | ... | ... | ... | ... | 55.6 | 43.0 | 57.0 | 47.2 | 50.4 | |||||||||||
| Capital Adequacy Ratio | % | ... | ... | ... | ... | ... | 17.0 | 19.6 | 15.2 | 15.1 | 14.5 | |||||||||||
| Net Interest Margin | % | ... | ... | ... | ... | ... | 4.97 | 6.87 | 4.54 | 4.22 | 3.69 | |||||||||||
| Interest Income (As % Of Revenues) | % | ... | ... | ... | ... | ... | 85.5 | 81.4 | 77.5 | 63.7 | 77.4 | |||||||||||
| Fee Income (As % Of Revenues) | % | ... | ... | ... | ... | ... | 20.3 | 9.86 | 11.3 | 11.3 | 13.2 | |||||||||||
| Staff Cost (As % Of Total Cost) | % | ... | ... | ... | ... | ... | 66.8 | 67.5 | 67.3 | 64.1 | 61.2 | |||||||||||
| Equity (As % Of Assets) | % | 14.5 | 18.4 | 14.1 | 13.0 | 12.4 | ||||||||||||||||
| Loans (As % Of Deposits) | % | 102 | 106 | 102 | 96.0 | 93.1 | ||||||||||||||||
| Loans (As % Assets) | % | 64.6 | 66.4 | 67.4 | 65.9 | 62.1 | ||||||||||||||||
| NPLs (As % Of Loans) | % | ... | ... | ... | ... | ... | 2.62 | 3.19 | 2.55 | 3.08 | 3.61 | |||||||||||
| Provisions (As % Of NPLs) | % | ... | ... | ... | ... | ... | 82.0 | 100 | 100 | 69.1 | 75.0 | |||||||||||
| valuation | ||||||||||||||||||||||
| Book Value Per Share Growth | % | ... | ... | ... | ... | ... | ... | 1.22 | 62.3 | -24.6 | 14.5 | 5.47 |
| income statement | Unit | 1997 | 1998 | 1999 | 2000 | 2001 | 2002 | 2003 | 2004 | 2005 | 2006 | 2007 | 2008 | 2009 | 2010 | 2011 | 2012 | 2013 | 2014 | 2015 | 2016 | 2017 |
| income statement | ||||||||||||||||||||||
| Interest Income | TRY mil | ... | ... | ... | ... | ... | 483 | 768 | 555 | 780 | 862 | |||||||||||
| Interest Cost | TRY mil | ... | ... | ... | ... | ... | 228 | 354 | 242 | 422 | 485 | |||||||||||
| Net Interest Income | TRY mil | ... | ... | ... | ... | ... | 255 | 415 | 313 | 358 | 377 | |||||||||||
| Net Fee Income | TRY mil | ... | ... | ... | ... | ... | 60.7 | 50.2 | 45.6 | 63.7 | 64.3 | |||||||||||
| Other Income | TRY mil | ... | ... | ... | ... | ... | -17.3 | 44.3 | 45.3 | 140 | 46.1 | |||||||||||
| Total Revenues | TRY mil | ... | ... | ... | ... | ... | 299 | 509 | 404 | 562 | 488 | |||||||||||
| Staff Cost | TRY mil | ... | ... | ... | ... | ... | 111 | 148 | 155 | 170 | 151 | |||||||||||
| Operating Cost | TRY mil | ... | ... | ... | ... | ... | 166 | 219 | 230 | 266 | 246 | |||||||||||
| Operating Profit | TRY mil | ... | ... | ... | ... | ... | 133 | 290 | 174 | 297 | 242 | |||||||||||
| Provisions | TRY mil | ... | ... | ... | ... | ... | 34.2 | 76.7 | 69.5 | 126 | 84.2 | |||||||||||
| Extra and Other Cost | TRY mil | ... | ... | ... | ... | ... | 0 | 0 | 0 | 0 | 0 | |||||||||||
| Pre-Tax Profit | TRY mil | ... | ... | ... | ... | ... | 98.4 | 213 | 104 | 170 | 158 | |||||||||||
| Tax | TRY mil | ... | ... | ... | ... | ... | 22.5 | 45.2 | 21.6 | 33.4 | 28.4 | |||||||||||
| Net Profit | TRY mil | ... | ... | ... | ... | ... | 75.8 | 168 | 82.5 | 137 | 129 | |||||||||||
| growth rates | ||||||||||||||||||||||
| Net Interest Income Growth | % | ... | ... | ... | ... | ... | ... | 1.22 | 62.3 | -24.6 | 14.5 | 5.47 | ||||||||||
| Net Fee Income Growth | % | ... | ... | ... | ... | ... | ... | -0.512 | -17.3 | -9.09 | 39.6 | 0.935 | ||||||||||
| Total Revenue Growth | % | ... | ... | ... | ... | ... | ... | -8.71 | 70.4 | -20.7 | 39.3 | -13.2 | ||||||||||
| Operating Cost Growth | % | ... | ... | ... | ... | ... | ... | 0.661 | 31.8 | 4.99 | 15.5 | -7.37 | ||||||||||
| Operating Profit Growth | % | ... | ... | ... | ... | ... | ... | -18.3 | 119 | -40.1 | 70.8 | -18.4 | ||||||||||
| Pre-Tax Profit Growth | % | ... | ... | ... | ... | ... | ... | -32.9 | 117 | -51.2 | 63.7 | -7.51 | ||||||||||
| Net Profit Growth | % | ... | ... | ... | ... | ... | ... | -36.9 | 122 | -50.9 | 66.1 | -5.65 | ||||||||||
| market share | ||||||||||||||||||||||
| Market Share in Revenues | % | ... | ... | ... | ... | ... | 0.510 | 0.700 | 0.500 | 0.632 | 0.492 | ... | ||||||||||
| Market Share in Net Profit | % | ... | ... | ... | ... | ... | 0.398 | 0.744 | 0.349 | 0.560 | 0.504 | ... | ||||||||||
| Market Share in Employees | % | 1.05 | 1.09 | 1.07 | 0.877 | 0.850 | ||||||||||||||||
| Market Share in Branches | % | 0.895 | 0.889 | 1.04 | 0.962 | 0.947 |
| balance sheet | Unit | 1997 | 1998 | 1999 | 2000 | 2001 | 2002 | 2003 | 2004 | 2005 | 2006 | 2007 | 2008 | 2009 | 2010 | 2011 | 2012 | 2013 | 2014 | 2015 | 2016 | 2017 |
| balance sheet | ||||||||||||||||||||||
| Cash | TRY mil | ... | ... | ... | ... | ... | 501 | 664 | 867 | 1,214 | 1,603 | |||||||||||
| Interbank Loans | TRY mil | ... | ... | ... | ... | ... | 247 | 161 | 143 | 284 | 68.3 | |||||||||||
| Customer Loans | TRY mil | 3,733 | 4,176 | 5,041 | 6,249 | 6,815 | ||||||||||||||||
| Debt Securities | TRY mil | ... | ... | ... | ... | ... | 973 | 948 | 1,045 | 1,269 | 1,969 | |||||||||||
| Fixed Assets | TRY mil | ... | ... | ... | ... | ... | 20.2 | 26.3 | 29.2 | 124 | 132 | |||||||||||
| Total Assets | TRY mil | 5,781 | 6,291 | 7,483 | 9,477 | 10,967 | ||||||||||||||||
| Shareholders' Equity | TRY mil | 840 | 1,160 | 1,053 | 1,228 | 1,360 | ||||||||||||||||
| Liabilities | TRY mil | 4,941 | 5,131 | 6,431 | 8,249 | 9,607 | ||||||||||||||||
| Interbank Borrowing | TRY mil | ... | ... | ... | ... | ... | 391 | 228 | 426 | 501 | 643 | |||||||||||
| Customer Deposits | TRY mil | 3,667 | 3,921 | 4,945 | 6,512 | 7,323 | ||||||||||||||||
| Issued Debt Securities | TRY mil | ... | ... | ... | ... | ... | 1,434 | 1,287 | 1,776 | 2,124 | 2,926 | |||||||||||
| Other Liabilities | TRY mil | ... | ... | ... | ... | ... | -550 | -306 | -716 | -889 | -1,285 | |||||||||||
| asset quality | ||||||||||||||||||||||
| Non-Performing Loans | TRY mil | ... | ... | ... | ... | ... | 99.8 | 137 | 132 | 197 | 253 | |||||||||||
| Gross Loans | TRY mil | ... | ... | ... | ... | ... | 3,815 | 4,313 | 5,173 | 6,385 | 7,005 | |||||||||||
| Total Provisions | TRY mil | ... | ... | ... | ... | ... | 81.9 | 137 | 132 | 136 | 190 | |||||||||||
| growth rates | ||||||||||||||||||||||
| Customer Loan Growth | % | ... | 23.3 | 11.9 | 20.7 | 24.0 | 9.05 | |||||||||||||||
| Total Asset Growth | % | ... | 28.8 | 8.81 | 19.0 | 26.6 | 15.7 | |||||||||||||||
| Shareholders' Equity Growth | % | ... | 11.2 | 38.0 | -9.22 | 16.7 | 10.7 | |||||||||||||||
| Customer Deposit Growth | % | ... | 39.1 | 6.95 | 26.1 | 31.7 | 12.5 | |||||||||||||||
| market share | ||||||||||||||||||||||
| Market Share in Customer Loans | % | 0.587 | 0.570 | 0.520 | 0.544 | 0.493 | ||||||||||||||||
| Market Share in Total Assets | % | 0.498 | 0.485 | 0.458 | 0.502 | 0.490 | ||||||||||||||||
| Market Share in Customer Deposits | % | 0.559 | 0.540 | 0.552 | 0.653 | 0.625 |
| ratios | Unit | 1997 | 1998 | 1999 | 2000 | 2001 | 2002 | 2003 | 2004 | 2005 | 2006 | 2007 | 2008 | 2009 | 2010 | 2011 | 2012 | 2013 | 2014 | 2015 | 2016 | 2017 |
| ratios | ||||||||||||||||||||||
| ROE | % | ... | ... | ... | ... | ... | 9.50 | 16.8 | 7.46 | 12.0 | 9.99 | |||||||||||
| ROA | % | ... | ... | ... | ... | ... | 1.48 | 2.79 | 1.20 | 1.62 | 1.26 | |||||||||||
| Costs (As % Of Assets) | % | ... | ... | ... | ... | ... | 3.24 | 3.63 | 3.34 | 3.13 | 2.41 | |||||||||||
| Costs (As % Of Income) | % | ... | ... | ... | ... | ... | 55.6 | 43.0 | 57.0 | 47.2 | 50.4 | |||||||||||
| Capital Adequacy Ratio | % | ... | ... | ... | ... | ... | 17.0 | 19.6 | 15.2 | 15.1 | 14.5 | |||||||||||
| Net Interest Margin | % | ... | ... | ... | ... | ... | 4.97 | 6.87 | 4.54 | 4.22 | 3.69 | |||||||||||
| Interest Spread | % | ... | ... | ... | ... | ... | 4.16 | 5.71 | 3.87 | 3.45 | 3.01 | |||||||||||
| Asset Yield | % | ... | ... | ... | ... | ... | 9.41 | 12.7 | 8.06 | 9.20 | 8.44 | |||||||||||
| Cost Of Liabilities | % | ... | ... | ... | ... | ... | 5.26 | 7.02 | 4.19 | 5.75 | 5.43 | |||||||||||
| Interest Income (As % Of Revenues) | % | ... | ... | ... | ... | ... | 85.5 | 81.4 | 77.5 | 63.7 | 77.4 | |||||||||||
| Fee Income (As % Of Revenues) | % | ... | ... | ... | ... | ... | 20.3 | 9.86 | 11.3 | 11.3 | 13.2 | |||||||||||
| Other Income (As % Of Revenues) | % | ... | ... | ... | ... | ... | -5.77 | 8.70 | 11.2 | 25.0 | 9.45 | |||||||||||
| Cost Per Employee | USD per month | ... | ... | ... | ... | ... | 2,881 | 3,382 | 3,203 | 3,592 | 2,798 | |||||||||||
| Cost Per Employee (Local Currency) | TRY per month | ... | ... | ... | ... | ... | 4,842 | 6,088 | 6,107 | 8,057 | 7,339 | |||||||||||
| Staff Cost (As % Of Total Cost) | % | ... | ... | ... | ... | ... | 66.8 | 67.5 | 67.3 | 64.1 | 61.2 | |||||||||||
| Equity (As % Of Assets) | % | 14.5 | 18.4 | 14.1 | 13.0 | 12.4 | ||||||||||||||||
| Loans (As % Of Deposits) | % | 102 | 106 | 102 | 96.0 | 93.1 | ||||||||||||||||
| Loans (As % Assets) | % | 64.6 | 66.4 | 67.4 | 65.9 | 62.1 | ||||||||||||||||
| NPLs (As % Of Loans) | % | ... | ... | ... | ... | ... | 2.62 | 3.19 | 2.55 | 3.08 | 3.61 | |||||||||||
| Provisions (As % Of NPLs) | % | ... | ... | ... | ... | ... | 82.0 | 100 | 100 | 69.1 | 75.0 | |||||||||||
| Provisions (As % Of Loans) | % | ... | ... | ... | ... | ... | 2.19 | 3.29 | 2.62 | 2.18 | 2.79 | |||||||||||
| Cost of Provisions (As % Of Loans) | % | ... | ... | ... | ... | ... | 1.01 | 1.94 | 1.51 | 2.23 | 1.29 |
Get all company financials in excel:


By Helgi Library - June 30, 2018
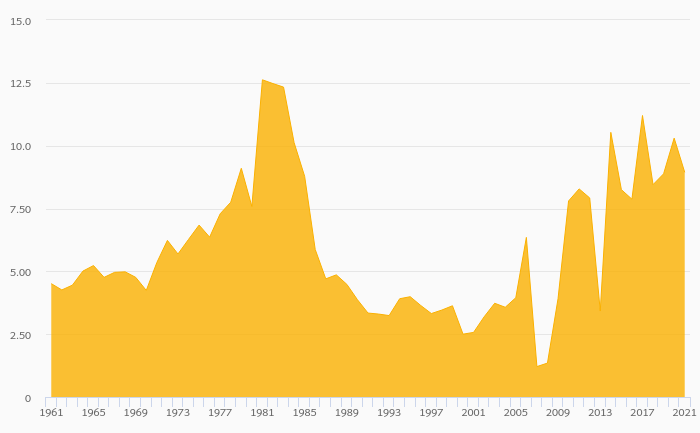
Anadolubank's net interest margin amounted to 3.59% in 2017, down from 3.69% compared to the previous year. Historically, the bank’s net interest margin reached an all time high of 7.71% in 2009 and an all time low of 3.59% in 2017. The average margin i...
By Helgi Library - June 30, 2018
Anadolubank's cost to income ratio reached 49.3% in 2017, up from 46.1% compared to the previous year. Historically, the bank’s costs reached an all time high of 65.0% of income in 2002 and an all time low of 43.0% in 2012. When compared to total assets, b...
By Helgi Library - June 30, 2018
Anadolubank's non-performing loans reached 2.88% of total loans at the end of 2017, down from 3.00% compared to the previous year. Historically, the NPL ratio hit an all time high of 3.61% in 2015 and an all time low of 1.33% in 2006. Provision coverage amo...
By Helgi Library - June 30, 2018
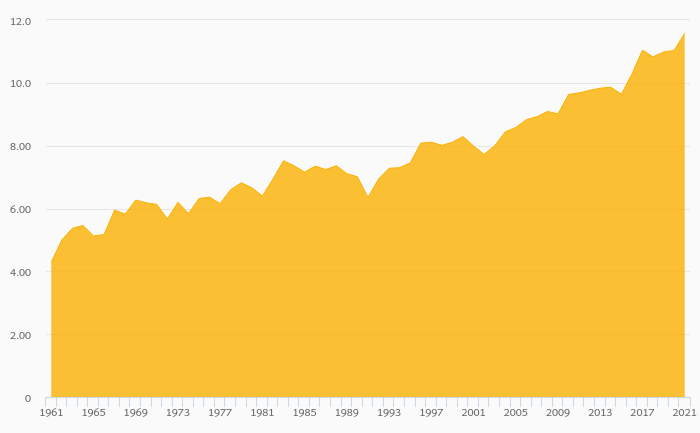
Anadolubank generated total banking revenues of TRY 664 mil in 2017, up 11.9% compared to the previous year. Historically, the bank’s revenues containing of interest, fee and other non-interest income reached an all time high of TRY 664 mil in 2017 and an all t...
By Helgi Library - June 30, 2018
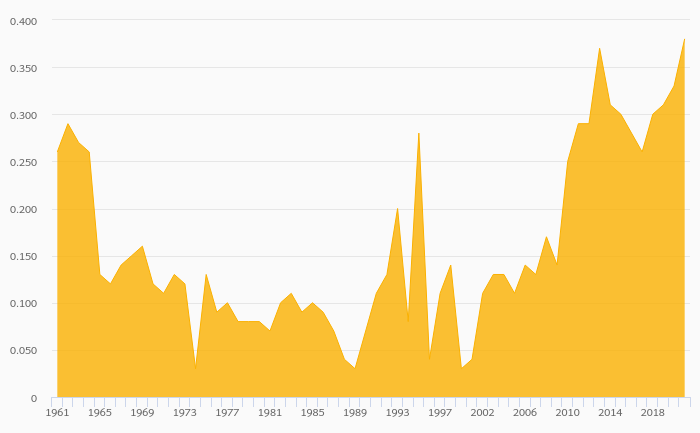
Anadolubank employed 1,750 persons in 2017, down 1.91% when compared to the previous year. Historically, the bank's workforce hit an all time high of 2,111 persons in 2013 and an all time low of 826 in 2002. Average cost reached USD 2,720 per month per employee, ...
By Helgi Library - June 30, 2018
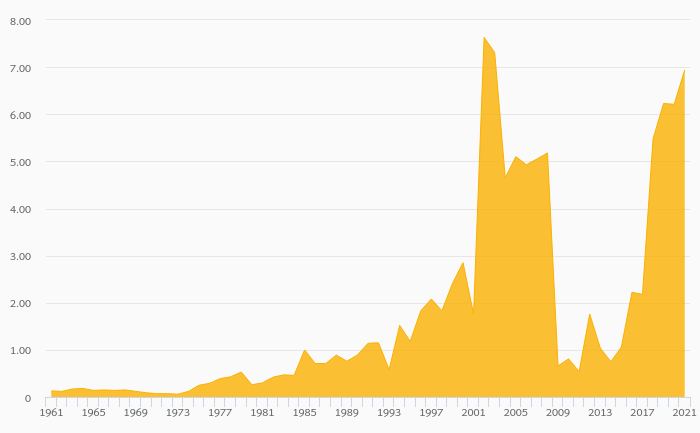
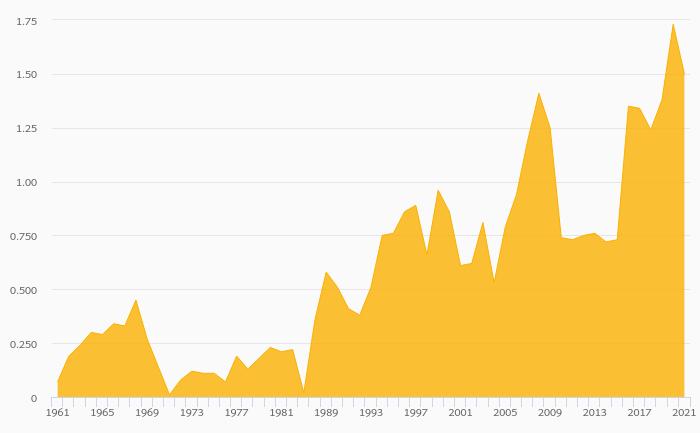
Anadolubank's customer loan growth reached 25.2% in 2017, down from 29.1% compared to the previous year. Historically, the bank’s loans growth reached an all time high of 377% in 1998 and an all time low of 9.05% in 2015. In the last decade, the average a...
By Helgi Library - July 16, 2018
Anadolubank generated total banking revenues of TRY 593 mil in 2016, up 21.6% compared to the previous year. Turkish banking sector banking sector generated total revenues of TRY 121,108 mil in 2016, up 22.1% when compared to the last year. As a...

Anadolubank has been growing its revenues and asset by 10.2% and 17.5% a year on average in the last 10 years. Its loans and deposits have grown by 20.1% and 20.4% a year during that time and loans to deposits ratio reached 93.0% at the end of 2017. The company achieved an average return on equity of 13.2% in the last decade with net profit growing 6.36% a year on average. In terms of operating efficiency, its cost to income ratio reached 49.3% in 2017, compared to 49.3% average in the last decade.
Equity represented 11.7% of total assets or 16.2% of loans at the end of 2017. Anadolubank's non-performing loans were 2.88% of total loans while provisions covered some 42.9% of NPLs at the end of 2017.
 Helgi Library