By Helgi Library - November 3, 2019
DCB Bank's non-performing loans reached 1.86% of total loans at the end of 2018, up from 1.80% compared to the previous year. ...
By Helgi Library - November 3, 2019
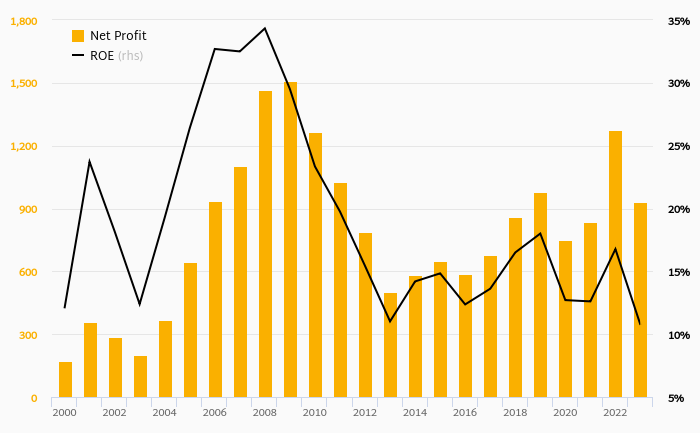
DCB Bank made a net profit of INR 3.25 bil under revenues of INR 15.0 bil in 2018, up 32.6% and 14.8% respectively compared to the pr...
By Helgi Library - November 3, 2019
DCB Bank stock traded at INR 201 per share at the end 2018 implying a market capitalization of USD 904 mil. Since the end of 2013, the ...
| Profit Statement |
| Balance Sheet |
| Ratios |
| Valuation |
Get all company financials in excel:
Get all company financials in excel:


By Helgi Library - November 3, 2019
DCB Bank stock traded at INR 201 per share at the end of 2018 implying a market capitalization of USD 904 mil. Since the end of 2013, the stock has appreciated by % implying an annual average growth of 0 %. In absolute terms, the value of the company rose by...
By Helgi Library - November 3, 2019
DCB Bank generated total banking revenues of INR 15.0 bil in 2018, up 14.8% compared to the previous year. Historically, the bank’s revenues containing of interest, fee and other non-interest income reached an all time high of INR 15.0 bil in 2018 and an all ti...
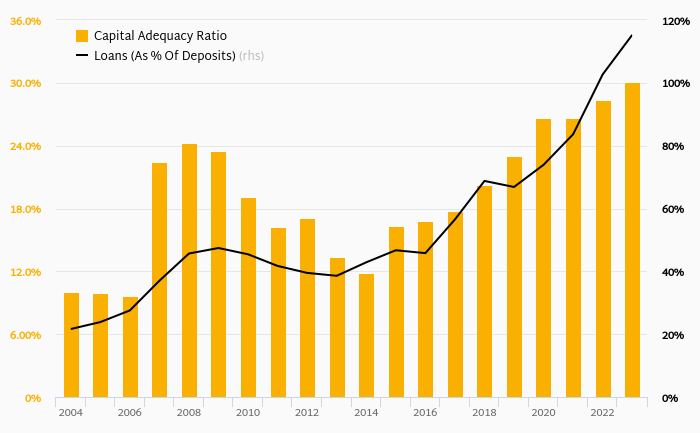
DCB Bank has been growing its revenues and asset by 21.3% and 23.2% a year on average in the last 3 years. Its loans and deposits have grown by 22.2% and 24.0% a year during that time and loans to deposits ratio reached 82.9% at the end of 2018. The company achieved an average return on equity of 10.3% in the last three years with net profit growing 18.7% a year on average. In terms of operating efficiency, its cost to income ratio reached 56.9% in 2018, compared to 58.9% average in the last three years.
Equity represented 8.70% of total assets or 13.2% of loans at the end of 2018. DCB Bank's non-performing loans were 1.86% of total loans while provisions covered some 68.3% of NPLs at the end of 2018.
DCB Bank stock traded at INR 201 per share at the end of 2018 resulting in a market capitalization of USD 904 mil. Over the previous five years, stock price rose by 0% or 0% a year on average. That’s compared to an average ROE of 10.9% the bank generated for its shareholders. This closing price put stock at a 12-month trailing price to earnings (PE) of 19.4x and price to book value (PBV) of 2.02x in 2018.
 Helgi Library