By Helgi Library - November 4, 2019
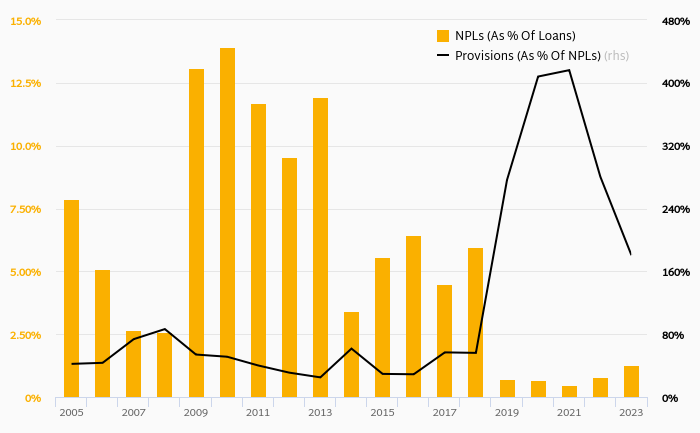
Indian Overseas Bank's non-performing loans reached 22.1% of total loans at the end of 2018, down from 25.5% compared to the prev...
By Helgi Library - November 2, 2019
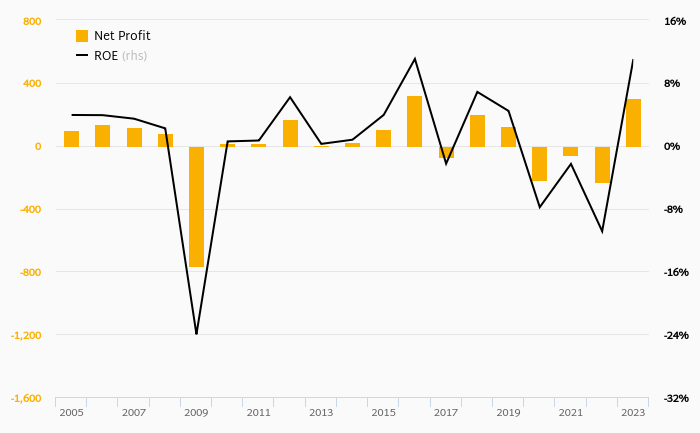
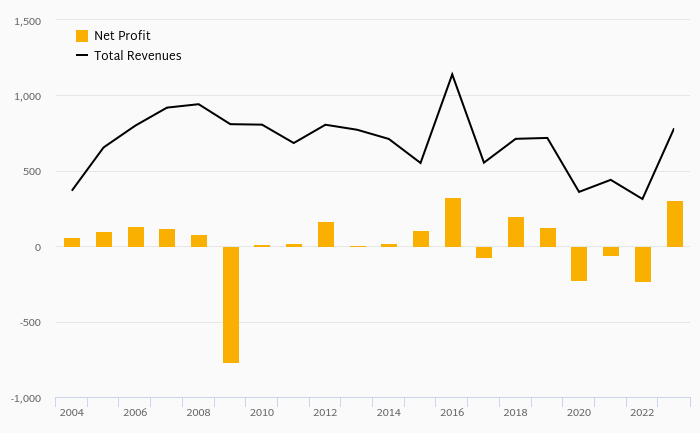
Indian Overseas Bank made a net profit of INR -37.4 bil under revenues of INR 93.8 bil in 2018, up 40.7% and 1.87% respectively compa...
By Helgi Library - November 2, 2019
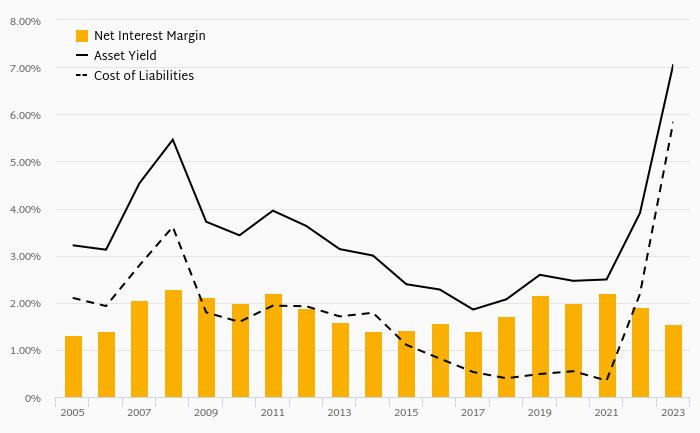
Indian Overseas Bank's net interest margin amounted to 2.12% in 2018, down from 2.21% compared to the previous year. Histo...
| Profit Statement |
| Balance Sheet |
| Ratios |
| Valuation |
Get all company financials in excel:
Get all company financials in excel:


By Helgi Library - November 2, 2019
Indian Overseas Bank's capital adequacy ratio reached 10.2% at the end of 2018, up from 9.25% compared to the previous year. Historically, the bank’s capital ratio hit an all time high of 26.7% in 2006 and an all time low of 9.25% in 2017. The Tier 1 ratio am...
By Helgi Library - November 2, 2019
Indian Overseas Bank generated total banking revenues of INR 93.8 bil in 2018, up 1.87% compared to the previous year. Historically, the bank’s revenues containing of interest, fee and other non-interest income reached an all time high of INR 93.8 bil in 2018 a...
By Helgi Library - November 2, 2019
Indian Overseas Bank's customer loan growth reached 0.082% in 2018, up from -5.67% compared to the previous year. Historically, the bank’s loans growth reached an all time high of 41.6% in 2010 and an all time low of -12.7% in 2016. In the last decade, th...
By Helgi Library - November 2, 2019
Indian Overseas Bank's customer deposits reached INR 2,168 bil in 2017, up 2.60% compared to the previous year. Indian banking sector accepted customer deposits of INR 110,303 bil in 2017, up 3.61% when compared to the last year. Indian Overseas Bank acco...
By Helgi Library - November 2, 2019
Indian Overseas Bank generated total banking revenues of INR 92.1 bil in 2017, up 7.61% compared to the previous year. Indian banking sector banking sector generated total revenues of INR 4,320,359 mil in 2017, up 7.41% when compared to the last year....
By Helgi Library - November 2, 2019
Indian Overseas Bank's customer loans reached INR 1,325 bil in 2017, down 5.67% compared to the previous year. Indian banking sector provided customer loans of INR 88,362 bil in 2017, up 7.04% when compared to the last year. Indian Overseas Bank accounted...
By Helgi Library - November 2, 2019
Indian Overseas Bank stock traded at INR 63.2 per share at the end 2013 implying a market capitalization of USD 1,016 mil. Since the end of 2008, the stock has appreciated by 38.5 % implying an annual average growth of 6.73 %. In absolute terms, the value of the compa...
By Helgi Library - November 2, 2019
Indian Overseas Bank stock traded at INR 63.2 per share at the end of 2013 implying a market capitalization of USD 1,016 mil. Since the end of 2008, the stock has appreciated by 38.5 % implying an annual average growth of 6.73 %. In absolute terms, the value of the co...

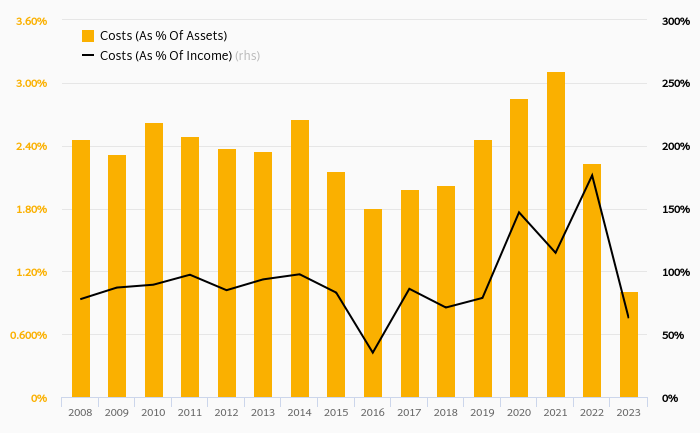
Indian Overseas Bank has been growing its revenues and asset by 3.92% and -1.88% a year on average in the last 5 years. Its loans and deposits have grown by -5.49% and -0.482% a year during that time and loans to deposits ratio reached 59.6% at the end of 2018. The company achieved an average return on equity of -23.3% in the last five years with net profit growing % a year on average. In terms of operating efficiency, its cost to income ratio reached 47.4% in 2018, compared to 57.0% average in the last five years.
Equity represented 6.54% of total assets or 12.3% of loans at the end of 2018. Indian Overseas Bank's non-performing loans were 22.1% of total loans while provisions covered some 55.8% of NPLs at the end of 2018.
Indian Overseas Bank stock traded at INR 24.1 per share at the end of 2018 resulting in a market capitalization of USD 1,893 mil. Over the previous five years, stock price fell by 61.8% or 17.5% a year on average. That’s compared to an average ROE of -23.3% the bank generated for its shareholders. This closing price put stock at a 12-month trailing price to earnings (PE) of x and price to book value (PBV) of 0.807x in 2018.
 Helgi Library