
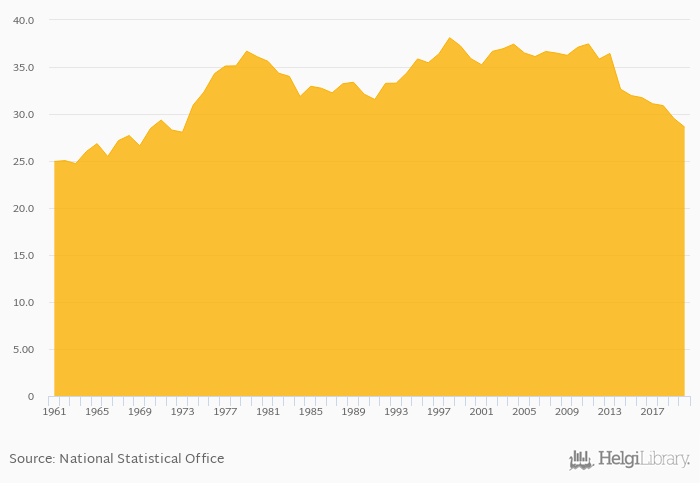
Pork meat consumption per capita fell 3.08% to 28.6 kg in Sweden in 2020, according to Faostat.
Historically, pork meat consumption per capita in Sweden reached an all time high of 38.1 kg in 1998 and an all time low of 24.7 kg in 1963. When compared to Sweden's main peers, pork meat consumption per capita in Denmark amounted to 13.5 kg, 30.8 kg in Finland, 23.7 kg in Norway and 28.2 kg in Russia in 2020.
Sweden has been ranked 29th within the group of 153 countries we follow in terms of pork meat consumption per capita, 8 places below the position seen 10 years ago.
| Pork Meat Consumption Per Capita | Unit | 2001 | 2002 | 2003 | 2004 | 2005 | 2006 | 2007 | 2008 | 2009 | 2010 | 2011 | 2012 | 2013 | 2014 | 2015 | 2016 | 2017 | 2018 | 2019 | 2020 | 2021 |
| Australia | kg | 26.1 | 25.6 | 25.5 | 25.8 | 28.4 | ||||||||||||||||
| China | kg | 39.6 | 39.9 | 39.5 | 38.3 | 37.0 | ||||||||||||||||
| Denmark | kg | 20.8 | 23.7 | 25.8 | 26.6 | 23.1 | ||||||||||||||||
| Finland | kg | 36.0 | 36.1 | 36.2 | 37.4 | 31.8 | ||||||||||||||||
| Germany | kg | 51.6 | 46.0 | 44.7 | 45.6 | 46.7 | ||||||||||||||||
| Iceland | kg | 19.8 | 20.0 | 19.9 | 20.3 | 21.1 | ||||||||||||||||
| Indonesia | kg | 1.54 | 1.33 | 1.20 | 0.810 | 0.880 | ||||||||||||||||
| Japan | kg | 20.1 | 21.0 | 21.8 | 21.9 | 22.2 | ||||||||||||||||
| Netherlands | kg | 27.6 | 27.6 | 30.0 | 28.9 | 26.9 | ||||||||||||||||
| New Zealand | kg | 25.9 | 26.1 | 25.9 | 26.7 | 26.8 | ||||||||||||||||
| Norway | kg | 23.5 | 23.5 | 22.9 | 25.8 | 24.8 | ||||||||||||||||
| Papua New Guinea | kg | ... | ... | ... | ... | ... | ... | ... | ... | ... | 9.82 | 9.86 | 9.94 | 9.64 | 9.42 | |||||||
| Russia | kg | 24.0 | 25.4 | 26.6 | 26.0 | 27.1 | ||||||||||||||||
| Sweden | kg | 32.0 | 31.7 | 30.9 | 30.6 | 29.2 | ||||||||||||||||
| USA | kg | 26.3 | 26.5 | 26.4 | 29.6 | 30.4 |
 Helgi Library


