By Helgi Library - November 29, 2018
Getin Noble Bank's mortgage loans reached PLN 28,368 mil in 2017, down 11.4% compared to the previous year. Polish banking sect...
By Helgi Library - September 25, 2018
Getin Noble Bank's non-performing loans reached 15.8% of total loans at the end of 2017, up from 14.7% compared to the previous y...
By Helgi Library - September 25, 2018
Getin Noble Bank made a net profit of PLN -575 mil under revenues of PLN 1,480 mil in 2017, up -882% and -3.72% respectively compared...
| Profit Statement | 2015 | 2016 | 2017 | |
| Net Interest Income | PLN mil | 1,196 | 1,317 | 1,297 |
| Net Fee Income | PLN mil | 327 | 126 | 154 |
| Other Income | PLN mil | 139 | 94.2 | 29.0 |
| Total Revenues | PLN mil | 1,662 | 1,537 | 1,480 |
| Staff Cost | PLN mil | 393 | 387 | 399 |
| Operating Profit | PLN mil | 469 | 678 | 585 |
| Provisions | PLN mil | 430 | 660 | 1,261 |
| Net Profit | PLN mil | 44.2 | -58.5 | -575 |
| Balance Sheet | 2015 | 2016 | 2017 | |
| Interbank Loans | PLN mil | 2,295 | 1,178 | 656 |
| Customer Loans | PLN mil | 49,225 | 46,666 | 42,712 |
| Total Assets | PLN mil | 70,757 | 66,517 | 59,836 |
| Shareholders' Equity | PLN mil | 5,164 | 5,114 | 4,316 |
| Interbank Borrowing | PLN mil | 3,829 | 2,595 | 1,848 |
| Customer Deposits | PLN mil | 55,726 | 53,041 | 48,614 |
| Issued Debt Securities | PLN mil | 5,614 | 3,820 | 4,443 |
| Ratios | 2015 | 2016 | 2017 | |
| ROE | % | 0.860 | -1.14 | -12.2 |
| ROA | % | 0.063 | -0.085 | -0.910 |
| Costs (As % Of Assets) | % | 1.71 | 1.25 | 1.42 |
| Costs (As % Of Income) | % | 71.8 | 55.9 | 60.5 |
| Capital Adequacy Ratio | % | 14.3 | 15.7 | 12.4 |
| Net Interest Margin | % | 1.71 | 1.92 | 2.05 |
| Loans (As % Of Deposits) | % | 88.3 | 88.0 | 87.9 |
| NPLs (As % Of Loans) | % | 13.2 | 14.7 | 15.8 |
| Provisions (As % Of NPLs) | % | 34.7 | 37.1 | 44.2 |
| Valuation | 2015 | 2016 | 2017 | |
| Price/Earnings (P/E) | 36.0 | ... | ... | |
| Price/Book Value (P/BV) | 0.308 | 0.228 | 0.338 | |
| Earnings Per Share (EPS) | 0.050 | -0.066 | -0.638 | |
| Book Value Per Share | 5.85 | 5.79 | 4.79 | |
Get all company financials in excel:
| summary | Unit | 2011 | 2012 | 2013 | 2014 | 2015 | 2016 | 2017 |
| income statement | ||||||||
| Net Interest Income | PLN mil | 1,372 | 1,248 | 1,298 | 1,431 | 1,196 | ||
| Total Revenues | PLN mil | 3,178 | 2,238 | 1,886 | 1,956 | 1,662 | ||
| Operating Profit | PLN mil | 2,311 | 1,404 | 1,007 | 1,033 | 469 | ||
| Net Profit | PLN mil | 980 | 371 | 400 | 360 | 44.2 | ||
| balance sheet | ||||||||
| Interbank Loans | PLN mil | 3,313 | 2,105 | 1,380 | 2,444 | 2,295 | ||
| Customer Loans | PLN mil | 41,056 | 42,394 | 45,353 | 44,910 | 49,225 | ||
| Debt Securities | PLN mil | 4,650 | 7,398 | 9,118 | 11,976 | 13,049 | ||
| Total Assets | PLN mil | 54,488 | 58,794 | 63,617 | 68,831 | 70,757 | ||
| Shareholders' Equity | PLN mil | 4,227 | 4,722 | 4,780 | 5,111 | 5,164 | ||
| Interbank Borrowing | PLN mil | 579 | 795 | 3,140 | 4,822 | 3,829 | ||
| Customer Deposits | PLN mil | 47,217 | 50,185 | 51,486 | 53,847 | 55,726 | ||
| Issued Debt Securities | PLN mil | 1,947 | 2,624 | 3,640 | 4,498 | 5,614 | ||
| ratios | ||||||||
| ROE | % | 23.2 | 8.29 | 8.41 | 7.28 | 0.860 | ||
| ROA | % | 1.80 | 0.655 | 0.653 | 0.544 | 0.063 | ||
| Costs (As % Of Assets) | % | 1.59 | 1.47 | 1.44 | 1.39 | 1.71 | ||
| Costs (As % Of Income) | % | 27.3 | 37.3 | 46.6 | 47.2 | 71.8 | ||
| Capital Adequacy Ratio | % | 10.0 | 12.2 | 12.4 | 13.1 | 14.3 | ||
| Net Interest Margin | % | 2.52 | 2.20 | 2.12 | 2.16 | 1.71 | ||
| Interest Income (As % Of Revenues) | % | 43.2 | 55.8 | 68.8 | 73.1 | 71.9 | ||
| Fee Income (As % Of Revenues) | % | 27.4 | 34.4 | 23.1 | 22.3 | 19.7 | ||
| Staff Cost (As % Of Total Cost) | % | 41.9 | 43.6 | 43.0 | 43.6 | 32.9 | ||
| Equity (As % Of Assets) | % | 7.76 | 8.03 | 7.51 | 7.43 | 7.30 | ||
| Loans (As % Of Deposits) | % | 87.0 | 84.5 | 88.1 | 83.4 | 88.3 | ||
| Loans (As % Assets) | % | 75.3 | 72.1 | 71.3 | 65.2 | 69.6 | ||
| NPLs (As % Of Loans) | % | 12.3 | 13.5 | 13.6 | 13.7 | 13.2 | ||
| Provisions (As % Of NPLs) | % | 66.9 | 65.4 | 64.5 | 53.6 | 34.7 | ||
| valuation | ||||||||
| Market Capitalisation (End Of Period) | USD mil | ... | 1,525 | 2,372 | 1,647 | 449 | ||
| Number Of Shares (Average) | mil | 762 | 883 | 875 | 883 | 883 | ||
| Share Price (End Of Period) | PLN | ... | 5.34 | 8.17 | 6.60 | 1.80 | ||
| Earnings Per Share (EPS) | 1.29 | 0.420 | 0.457 | 0.408 | 0.050 | |||
| Book Value Per Share | 5.54 | 5.34 | 5.46 | 5.79 | 5.85 | |||
| Price/Earnings (P/E) | ... | 12.7 | 17.9 | 16.2 | 36.0 | ... | ... | |
| Price/Book Value (P/BV) | ... | 0.999 | 1.50 | 1.14 | 0.308 | |||
| Earnings Per Share Growth | % | ... | -67.3 | 8.75 | -10.8 | -87.7 | ||
| Book Value Per Share Growth | % | ... | -3.61 | 2.24 | 5.88 | 1.03 |
| income statement | Unit | 2011 | 2012 | 2013 | 2014 | 2015 | 2016 | 2017 |
| income statement | ||||||||
| Interest Income | PLN mil | 3,684 | 4,291 | 3,817 | 3,595 | 3,005 | ||
| Interest Cost | PLN mil | 2,312 | 3,043 | 2,519 | 2,164 | 1,810 | ||
| Net Interest Income | PLN mil | 1,372 | 1,248 | 1,298 | 1,431 | 1,196 | ||
| Net Fee Income | PLN mil | 871 | 769 | 436 | 437 | 327 | ||
| Other Income | PLN mil | 935 | 221 | 152 | 88.7 | 139 | ||
| Total Revenues | PLN mil | 3,178 | 2,238 | 1,886 | 1,956 | 1,662 | ||
| Staff Cost | PLN mil | 364 | 364 | 378 | 403 | 393 | ||
| Depreciation | PLN mil | 62.5 | 63.7 | 72.8 | 68.2 | 72.4 | ||
| Other Cost | PLN mil | 441 | 406 | 428 | 452 | 728 | ||
| Operating Cost | PLN mil | 867 | 834 | 879 | 923 | 1,193 | ||
| Operating Profit | PLN mil | 2,311 | 1,404 | 1,007 | 1,033 | 469 | ||
| Provisions | PLN mil | 1,225 | 975 | 624 | 733 | 430 | ||
| Extra and Other Cost | PLN mil | -9.82 | -27.2 | -5.08 | -14.0 | -33.9 | ||
| Pre-Tax Profit | PLN mil | 1,095 | 456 | 388 | 314 | 73.0 | ||
| Tax | PLN mil | 116 | 70.1 | -14.5 | -46.2 | 18.6 | ||
| Minorities | PLN mil | -0.381 | 14.6 | 2.76 | 0.461 | 10.2 | ||
| Net Profit | PLN mil | 980 | 371 | 400 | 360 | 44.2 | ||
| growth rates | ||||||||
| Net Interest Income Growth | % | ... | -9.05 | 4.03 | 10.2 | -16.4 | ||
| Net Fee Income Growth | % | ... | -11.8 | -43.3 | 0.170 | -25.2 | ||
| Total Revenue Growth | % | ... | -29.6 | -15.7 | 3.71 | -15.0 | ||
| Operating Cost Growth | % | ... | -3.88 | 5.41 | 5.01 | 29.2 | ||
| Operating Profit Growth | % | ... | -39.2 | -28.2 | 2.57 | -54.6 | ||
| Pre-Tax Profit Growth | % | ... | -58.4 | -14.9 | -19.0 | -76.8 | ||
| Net Profit Growth | % | ... | -62.1 | 7.70 | -9.93 | -87.7 | ||
| market share | ||||||||
| Market Share in Revenues | % | 5.55 | 3.82 | 3.40 | 3.40 | 2.98 | ||
| Market Share in Net Profit | % | 6.30 | 2.40 | 2.63 | 2.27 | 0.395 | ||
| Market Share in Employees | % | 3.14 | 3.38 | 3.53 | 3.40 | 3.52 | ||
| Market Share in Branches | % | ... | ... | ... | ... | ... | ... |
| balance sheet | Unit | 2011 | 2012 | 2013 | 2014 | 2015 | 2016 | 2017 |
| balance sheet | ||||||||
| Cash | PLN mil | 2,423 | 2,907 | 2,630 | 2,841 | 2,724 | ||
| Interbank Loans | PLN mil | 3,313 | 2,105 | 1,380 | 2,444 | 2,295 | ||
| Customer Loans | PLN mil | 41,056 | 42,394 | 45,353 | 44,910 | 49,225 | ||
| Retail Loans | PLN mil | 42,312 | 43,427 | 44,644 | 43,128 | 41,007 | ||
| Mortgage Loans | PLN mil | 33,874 | 34,903 | 35,666 | 34,831 | 33,358 | ||
| Consumer Loans | PLN mil | 8,437 | 8,524 | 8,979 | 8,297 | 7,650 | ||
| Corporate Loans | PLN mil | 2,422 | 3,084 | 5,064 | 5,355 | 10,590 | ||
| Debt Securities | PLN mil | 4,650 | 7,398 | 9,118 | 11,976 | 13,049 | ||
| Fixed Assets | PLN mil | 294 | 420 | 528 | 615 | 576 | ||
| Total Assets | PLN mil | 54,488 | 58,794 | 63,617 | 68,831 | 70,757 | ||
| Shareholders' Equity | PLN mil | 4,227 | 4,722 | 4,780 | 5,111 | 5,164 | ||
| Of Which Minority Interest | PLN mil | 2.48 | 2.98 | 5.35 | 0.191 | 0.005 | ||
| Liabilities | PLN mil | 50,261 | 54,073 | 58,837 | 63,720 | 65,593 | ||
| Interbank Borrowing | PLN mil | 579 | 795 | 3,140 | 4,822 | 3,829 | ||
| Customer Deposits | PLN mil | 47,217 | 50,185 | 51,486 | 53,847 | 55,726 | ||
| Retail Deposits | PLN mil | 37,164 | 38,901 | 39,507 | 40,153 | 43,675 | ||
| Corporate Deposits | PLN mil | 8,563 | 9,369 | 9,637 | 10,936 | 8,876 | ||
| Sight Deposits | PLN mil | 4,434 | 4,690 | 8,672 | 8,438 | 8,986 | ||
| Term Deposits | PLN mil | 42,783 | 45,495 | 42,815 | 45,409 | 46,740 | ||
| Issued Debt Securities | PLN mil | 1,947 | 2,624 | 3,640 | 4,498 | 5,614 | ||
| Other Liabilities | PLN mil | 517 | 469 | 571 | 553 | 424 | ||
| asset quality | ||||||||
| Non-Performing Loans | PLN mil | 5,495 | 6,294 | 6,749 | 6,662 | 6,836 | ||
| Gross Loans | PLN mil | 44,733 | 46,510 | 49,709 | 48,483 | 51,597 | ||
| Total Provisions | PLN mil | 3,678 | 4,117 | 4,355 | 3,573 | 2,372 | ||
| growth rates | ||||||||
| Customer Loan Growth | % | ... | 3.26 | 6.98 | -0.976 | 9.61 | ||
| Retail Loan Growth | % | ... | 2.64 | 2.80 | -3.40 | -4.92 | ||
| Mortgage Loan Growth | % | ... | 3.04 | 2.19 | -2.34 | -4.23 | ||
| Consumer Loan Growth | % | ... | 1.03 | 5.34 | -7.59 | -7.80 | ||
| Corporate Loan Growth | % | ... | 27.3 | 64.2 | 5.75 | 97.7 | ||
| Total Asset Growth | % | ... | 7.90 | 8.20 | 8.20 | 2.80 | ||
| Shareholders' Equity Growth | % | ... | 11.7 | 1.25 | 6.92 | 1.03 | ||
| Customer Deposit Growth | % | ... | 6.29 | 2.59 | 4.58 | 3.49 | ||
| Retail Deposit Growth | % | ... | 4.67 | 1.56 | 1.63 | 8.77 | ||
| Corporate Deposit Growth | % | ... | 9.41 | 2.85 | 13.5 | -18.8 | ||
| market share | ||||||||
| Market Share in Customer Loans | % | 4.52 | 4.54 | 4.68 | 4.32 | 4.42 | ||
| Market Share in Corporate Loans | % | 0.916 | 1.13 | 1.82 | 1.78 | 3.25 | ||
| Market Share in Retail Loans | % | 7.98 | 8.17 | 8.08 | 7.36 | 6.57 | ||
| Market Share in Consumer Loans | % | 3.94 | 4.03 | 4.10 | 3.56 | 3.09 | ||
| Market Share in Mortgage Loans | % | 10.7 | 10.9 | 10.7 | 9.85 | 8.82 | ||
| Market Share in Total Assets | % | 4.31 | 4.47 | 4.63 | 4.60 | 4.53 | ||
| Market Share in Customer Deposits | % | 5.24 | 5.42 | 5.29 | 5.17 | 5.02 | ||
| Market Share in Retail Deposits | % | 8.42 | 8.12 | 7.81 | 7.20 | 7.14 | ||
| Market Share in Corporate Deposits | % | 3.37 | 3.88 | 3.63 | 3.75 | 2.76 |
| ratios | Unit | 2011 | 2012 | 2013 | 2014 | 2015 | 2016 | 2017 |
| ratios | ||||||||
| ROE | % | 23.2 | 8.29 | 8.41 | 7.28 | 0.860 | ||
| ROA | % | 1.80 | 0.655 | 0.653 | 0.544 | 0.063 | ||
| Costs (As % Of Assets) | % | 1.59 | 1.47 | 1.44 | 1.39 | 1.71 | ||
| Costs (As % Of Income) | % | 27.3 | 37.3 | 46.6 | 47.2 | 71.8 | ||
| Capital Adequacy Ratio | % | 10.0 | 12.2 | 12.4 | 13.1 | 14.3 | ||
| Tier 1 Ratio | % | ... | ... | ... | 9.70 | 11.1 | ||
| Net Interest Margin | % | 2.52 | 2.20 | 2.12 | 2.16 | 1.71 | ||
| Interest Spread | % | ... | 1.74 | 1.77 | 1.90 | 1.51 | ||
| Asset Yield | % | 6.76 | 7.57 | 6.24 | 5.43 | 4.31 | ||
| Cost Of Liabilities | % | ... | 5.83 | 4.46 | 3.53 | 2.80 | ||
| Interest Income (As % Of Revenues) | % | 43.2 | 55.8 | 68.8 | 73.1 | 71.9 | ||
| Fee Income (As % Of Revenues) | % | 27.4 | 34.4 | 23.1 | 22.3 | 19.7 | ||
| Other Income (As % Of Revenues) | % | 29.4 | 9.89 | 8.07 | 4.54 | 8.39 | ||
| Cost Per Employee | USD per month | 1,845 | 1,574 | 1,622 | 1,742 | 1,661 | ||
| Cost Per Employee (Local Currency) | PLN per month | 5,469 | 5,123 | 5,125 | 5,709 | 5,444 | ||
| Staff Cost (As % Of Total Cost) | % | 41.9 | 43.6 | 43.0 | 43.6 | 32.9 | ||
| Equity (As % Of Assets) | % | 7.76 | 8.03 | 7.51 | 7.43 | 7.30 | ||
| Loans (As % Of Deposits) | % | 87.0 | 84.5 | 88.1 | 83.4 | 88.3 | ||
| Loans (As % Assets) | % | 75.3 | 72.1 | 71.3 | 65.2 | 69.6 | ||
| NPLs (As % Of Loans) | % | 12.3 | 13.5 | 13.6 | 13.7 | 13.2 | ||
| Provisions (As % Of NPLs) | % | 66.9 | 65.4 | 64.5 | 53.6 | 34.7 | ||
| Provisions (As % Of Loans) | % | 8.96 | 9.71 | 9.60 | 7.96 | 4.82 | ||
| Cost of Provisions (As % Of Loans) | % | 2.98 | 2.34 | 1.42 | 1.62 | 0.914 |
| other data | Unit | 2011 | 2012 | 2013 | 2014 | 2015 | 2016 | 2017 |
| other data | ||||||||
| Branches | ... | ... | ... | ... | ... | ... | ||
| Employees | 5,543 | 5,917 | 6,149 | 5,877 | 6,015 | |||
| Sight (As % Of Customer Deposits) | % | 9.39 | 9.35 | 16.8 | 15.7 | 16.1 |
Get all company financials in excel:
By Helgi Library - May 22, 2018
Getin Noble Bank generated total banking revenues of PLN 1,480 mil in 2017, down 3.72% compared to the previous year. Polish banking sector banking sector generated total revenues of PLN 61,763 mil in 2017, up 4.13% when compared to the last year. ...
By Helgi Library - May 22, 2018
Getin Noble Bank's customer deposits reached PLN 48,614 mil in 2017, down 8.35% compared to the previous year. Polish banking sector accepted customer deposits of PLN 1,270 bil in 2017, up 4.79% when compared to the last year. Getin Noble Bank accounted f...
By Helgi Library - September 25, 2018
Getin Noble Bank's corporate deposits reached PLN 6,690 mil in 2017, down 14.8% compared to the previous year. Polish banking sector accepted corporate deposits of PLN 285 bil in 2017, up 3.64% when compared to the last year. Getin Noble Bank accounted fo...
By Helgi Library - September 25, 2018
Getin Noble Bank's consumer loans reached PLN 6,827 mil in 2017, down 3.66% compared to the previous year. Polish banking sector provided consumer loans of PLN 278 bil in 2017, up 6.64% when compared to the last year. Getin Noble Bank accounted for 5.24% ...
By Helgi Library - September 25, 2018
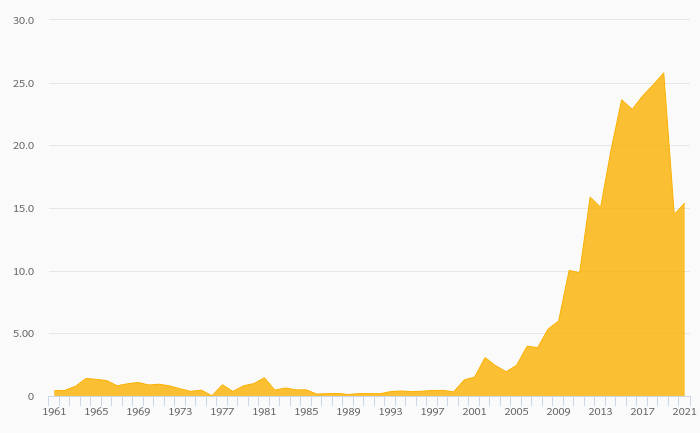
Getin Noble Bank's loans reached PLN 45,908 mil in the 2017, down from PLN 49,361 mil compared to the previous year. Historically, the bank’s loans reached an all time high of PLN 51,597 mil in 2015 and an all time low of PLN 45,908 mil in 2017. In the ...
By Helgi Library - May 22, 2018
Getin Noble Bank's customer loans reached PLN 42,712 mil in 2017, down 8.47% compared to the previous year. Polish banking sector provided customer loans of PLN 1,206 bil in 2017, up 3.69% when compared to the last year. Getin Noble Bank accounted for 3.5...
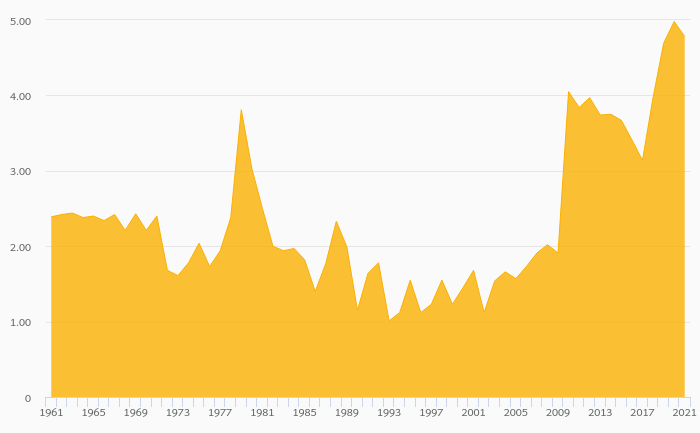
By Helgi Library - May 1, 2018
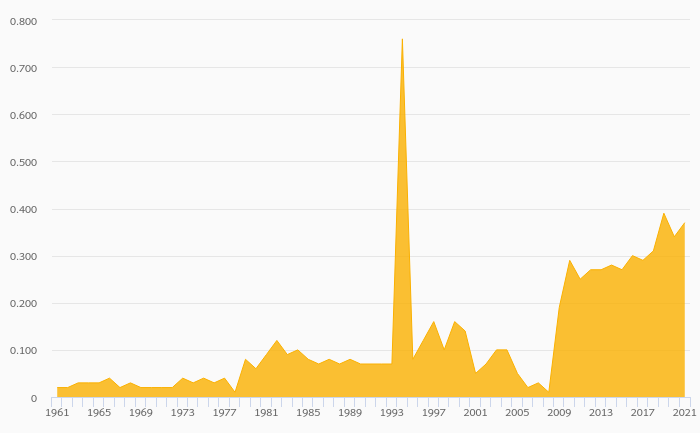
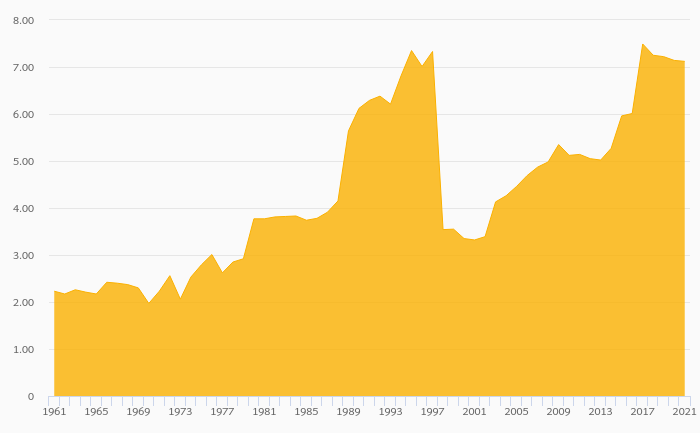
Getin Noble Bank's net interest margin amounted to 2.05% in 2017, up from 1.92% compared to the previous year. Historically, the bank’s net interest margin reached an all time high of 2.20% in 2012 and an all time low of 1.71% in 2015. The average margi...
By Helgi Library - September 25, 2018
Getin Noble Bank's retail deposits reached PLN 39,619 mil in 2017, down 7.35% compared to the previous year. Polish banking sector accepted retail deposits of PLN 761 bil in 2017, up 4.18% when compared to the last year. Getin Noble Bank accounted for 5.2...
By Helgi Library - September 25, 2018
Getin Noble Bank's retail loans reached PLN 35,195 mil at the end of 2017, down 10.0% compared to the previous year. In the last decade, the average annual loan growth amounted to 0%. Overall, retail loans accounted for 82.4% of the bank's loan book at the ...
By Helgi Library - May 1, 2018
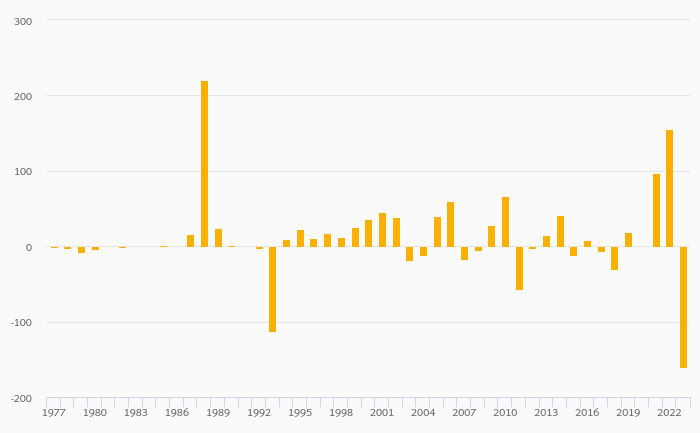
Getin Noble Bank's customer loan growth reached -8.47% in 2017, down from -5.20% compared to the previous year. Historically, the bank’s loans growth reached an all time high of 9.61% in 2015 and an all time low of -8.47% in 2017. In the last decade, the ...

Getin Noble Bank has been growing its revenues and asset by -7.94% and 0.352% a year on average in the last 5 years. Its loans and deposits have grown by 0.150% and -0.634% a year during that time and loans to deposits ratio reached 87.9% at the end of 2017. The company achieved an average return on equity of 0.644% in the last five years with net profit growing % a year on average. In terms of operating efficiency, its cost to income ratio reached 60.5% in 2017, compared to 56.4% average in the last five years.
Equity represented 7.21% of total assets or 10.1% of loans at the end of 2017. Getin Noble Bank's non-performing loans were 15.8% of total loans while provisions covered some 44.2% of NPLs at the end of 2017.
Getin Noble Bank stock traded at PLN 1.62 per share at the end of 2017 resulting in a market capitalization of USD 419 mil. Over the previous three years, stock price fell by 75.5% or 37.4% a year on average. That’s compared to an average ROE of -4.16% the bank generated for its shareholders. This closing price put stock at a 12-month trailing price to earnings (PE) of x and price to book value (PBV) of 0.338x in 2017.
 Helgi Library