By Helgi Library - September 3, 2018
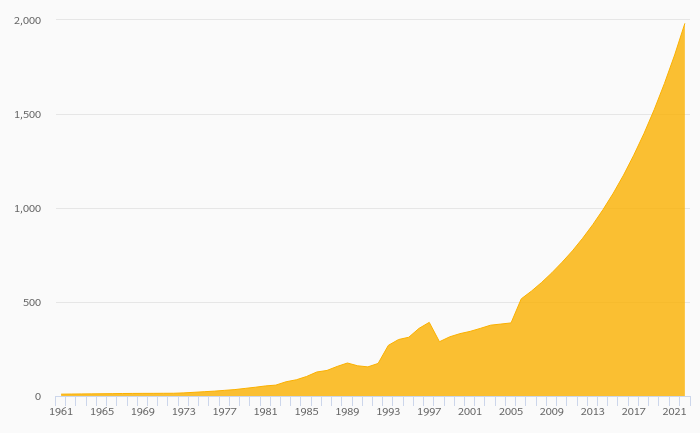
Municipal Bank's customer deposits reached BGN 1,411 mil in 2017, up 15.0% compared to the previous year. Bulgarian banking sec...
By Helgi Library - September 3, 2018
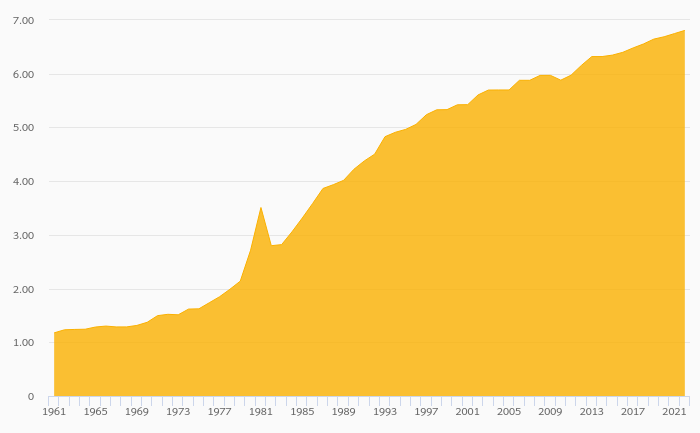
Municipal Bank's net interest margin amounted to 2.28% in 2017, down from 2.53% compared to the previous year. Historicall...
By Helgi Library - September 3, 2018
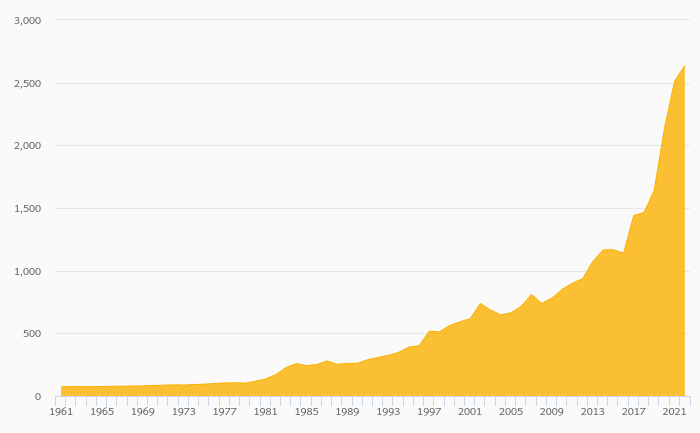
Municipal Bank made a net profit of BGN 4.67 mil under revenues of BGN 41.8 mil in 2017, up 111% and -2.84% respectively compared to ...
| Profit Statement | 2015 | 2016 | 2017 | |
| Net Interest Income | BGN mil | 28.6 | 31.8 | 32.2 |
| Net Fee Income | BGN mil | 8.67 | 8.77 | 9.86 |
| Other Income | BGN mil | 5.34 | 2.50 | -0.272 |
| Total Revenues | BGN mil | 42.6 | 43.0 | 41.8 |
| Operating Profit | BGN mil | 4.86 | 3.57 | 5.85 |
| Provisions | BGN mil | -0.982 | 1.50 | 1.70 |
| Net Profit | BGN mil | 5.41 | 2.21 | 4.67 |
| Balance Sheet | 2015 | 2016 | 2017 | |
| Customer Loans | BGN mil | 393 | 448 | 435 |
| Total Assets | BGN mil | 1,193 | 1,320 | 1,510 |
| Shareholders' Equity | BGN mil | 80.9 | 90.5 | 95.5 |
| Interbank Borrowing | BGN mil | 0 | 0 | 0 |
| Customer Deposits | BGN mil | 1,110 | 1,227 | 1,411 |
| Issued Debt Securities | BGN mil | 0 | 0 | 0 |
| Ratios | 2015 | 2016 | 2017 | |
| ROE | % | 6.92 | 2.57 | 5.02 |
| ROA | % | 0.443 | 0.176 | 0.330 |
| Costs (As % Of Assets) | % | 3.09 | 3.14 | 2.54 |
| Costs (As % Of Income) | % | 88.6 | 91.7 | 86.0 |
| Net Interest Margin | % | 2.34 | 2.53 | 2.28 |
| Loans (As % Of Deposits) | % | 35.4 | 36.5 | 30.8 |
| Growth Rates | 2015 | 2016 | 2017 | |
| Total Revenue Growth | % | -1.07 | 1.12 | -2.84 |
| Operating Cost Growth | % | 3.06 | 4.69 | -8.87 |
| Operating Profit Growth | % | -24.5 | -26.6 | 64.0 |
| Net Profit Growth | % | -5.91 | -59.2 | 111 |
| Customer Loan Growth | % | 1.44 | 14.0 | -3.03 |
| Total Asset Growth | % | -4.31 | 10.7 | 14.4 |
| Customer Deposit Growth | % | -4.77 | 10.5 | 15.0 |
| Shareholders' Equity Growth | % | 7.33 | 11.9 | 5.43 |
Get all company financials in excel:
| summary | Unit | 2007 | 2008 | 2009 | 2010 | 2011 | 2012 | 2013 | 2014 | 2015 | 2016 | 2017 |
| income statement | ||||||||||||
| Net Interest Income | BGN mil | 30.5 | 31.5 | 31.7 | 25.7 | 28.6 | ||||||
| Total Revenues | BGN mil | 44.6 | 57.7 | 50.0 | 43.0 | 42.6 | ||||||
| Operating Profit | BGN mil | 9.82 | 24.7 | 16.0 | 6.44 | 4.86 | ||||||
| Net Profit | BGN mil | 2.91 | 6.03 | 6.05 | 5.75 | 5.41 | ||||||
| balance sheet | ||||||||||||
| Customer Loans | BGN mil | 418 | 365 | 457 | 388 | 393 | ||||||
| Debt Securities | BGN mil | 402 | 426 | 501 | 525 | 548 | ||||||
| Total Assets | BGN mil | 954 | 1,017 | 1,156 | 1,247 | 1,193 | ||||||
| Shareholders' Equity | BGN mil | 63.0 | 63.4 | 69.6 | 75.4 | 80.9 | ||||||
| Interbank Borrowing | BGN mil | 0 | 0 | 0 | 0 | 0 | ||||||
| Customer Deposits | BGN mil | 888 | 949 | 1,082 | 1,166 | 1,110 | ||||||
| Issued Debt Securities | BGN mil | 0 | 0 | 0 | 0 | 0 | ||||||
| ratios | ||||||||||||
| ROE | % | 4.73 | 9.54 | 9.10 | 7.93 | 6.92 | ||||||
| ROA | % | 0.299 | 0.611 | 0.557 | 0.479 | 0.443 | ||||||
| Costs (As % Of Assets) | % | 3.56 | 3.34 | 3.13 | 3.05 | 3.09 | ||||||
| Costs (As % Of Income) | % | 78.0 | 57.1 | 68.0 | 85.0 | 88.6 | ||||||
| Net Interest Margin | % | 3.13 | 3.20 | 2.91 | 2.14 | 2.34 | ||||||
| Interest Income (As % Of Revenues) | % | 68.4 | 54.7 | 63.4 | 59.6 | 67.1 | ||||||
| Fee Income (As % Of Revenues) | % | 23.7 | 16.3 | 17.7 | 20.6 | 20.4 | ||||||
| Equity (As % Of Assets) | % | 6.60 | 6.23 | 6.03 | 6.05 | 6.78 | ||||||
| Loans (As % Of Deposits) | % | 47.1 | 38.5 | 42.2 | 33.3 | 35.4 | ||||||
| Loans (As % Assets) | % | 43.8 | 35.9 | 39.5 | 31.1 | 33.0 | ||||||
| valuation | ||||||||||||
| Book Value Per Share Growth | % | ... | 17.2 | 3.33 | 0.444 | -19.0 | 11.3 |
| income statement | Unit | 2007 | 2008 | 2009 | 2010 | 2011 | 2012 | 2013 | 2014 | 2015 | 2016 | 2017 |
| income statement | ||||||||||||
| Interest Income | BGN mil | 54.8 | 53.1 | 52.4 | 45.1 | 40.4 | ||||||
| Interest Cost | BGN mil | 24.3 | 21.6 | 20.7 | 19.5 | 11.9 | ||||||
| Net Interest Income | BGN mil | 30.5 | 31.5 | 31.7 | 25.7 | 28.6 | ||||||
| Net Fee Income | BGN mil | 10.6 | 9.37 | 8.87 | 8.85 | 8.67 | ||||||
| Other Income | BGN mil | 3.53 | 16.8 | 9.45 | 8.52 | 5.34 | ||||||
| Total Revenues | BGN mil | 44.6 | 57.7 | 50.0 | 43.0 | 42.6 | ||||||
| Depreciation | BGN mil | 3.01 | 2.31 | 2.19 | 2.03 | 2.05 | ||||||
| Operating Cost | BGN mil | 34.8 | 32.9 | 34.0 | 36.6 | 37.7 | ||||||
| Operating Profit | BGN mil | 9.82 | 24.7 | 16.0 | 6.44 | 4.86 | ||||||
| Provisions | BGN mil | 6.87 | 19.0 | 9.98 | 0.314 | -0.982 | ||||||
| Extra and Other Cost | BGN mil | -0.321 | -0.291 | -0.343 | -0.331 | -0.243 | ||||||
| Pre-Tax Profit | BGN mil | 3.27 | 6.03 | 6.37 | 6.46 | 6.09 | ||||||
| Tax | BGN mil | 0.357 | 0 | 0.316 | 0.708 | 0.676 | ||||||
| Minorities | BGN mil | 0 | 0 | 0 | 0 | 0 | ||||||
| Net Profit | BGN mil | 2.91 | 6.03 | 6.05 | 5.75 | 5.41 | ||||||
| growth rates | ||||||||||||
| Net Interest Income Growth | % | ... | 17.2 | 3.33 | 0.444 | -19.0 | 11.3 | |||||
| Net Fee Income Growth | % | ... | 9.40 | -11.3 | -5.31 | -0.214 | -2.03 | |||||
| Total Revenue Growth | % | ... | 16.0 | 29.3 | -13.3 | -13.9 | -1.07 | |||||
| Operating Cost Growth | % | ... | -1.86 | -5.35 | 3.24 | 7.66 | 3.06 | |||||
| Operating Profit Growth | % | ... | 227 | 152 | -35.3 | -59.7 | -24.5 | |||||
| Pre-Tax Profit Growth | % | ... | 56.9 | 84.3 | 5.61 | 1.46 | -5.76 | |||||
| Net Profit Growth | % | ... | 59.7 | 107 | 0.365 | -4.94 | -5.91 | |||||
| market share | ||||||||||||
| Market Share in Revenues | % | 1.14 | 1.51 | 1.35 | 1.10 | 1.03 | ||||||
| Market Share in Net Profit | % | 0.615 | 1.15 | 1.20 | 0.809 | 0.602 |
| balance sheet | Unit | 2007 | 2008 | 2009 | 2010 | 2011 | 2012 | 2013 | 2014 | 2015 | 2016 | 2017 |
| balance sheet | ||||||||||||
| Cash | BGN mil | 83.5 | 171 | 145 | 278 | 190 | ||||||
| Customer Loans | BGN mil | 418 | 365 | 457 | 388 | 393 | ||||||
| Debt Securities | BGN mil | 402 | 426 | 501 | 525 | 548 | ||||||
| Fixed Assets | BGN mil | 44.2 | 49.6 | 48.9 | 48.4 | 48.8 | ||||||
| Total Assets | BGN mil | 954 | 1,017 | 1,156 | 1,247 | 1,193 | ||||||
| Shareholders' Equity | BGN mil | 63.0 | 63.4 | 69.6 | 75.4 | 80.9 | ||||||
| Of Which Minority Interest | BGN mil | 0 | 0 | 0 | 0 | 0 | ||||||
| Liabilities | BGN mil | 891 | 954 | 1,086 | 1,171 | 1,112 | ||||||
| Interbank Borrowing | BGN mil | 0 | 0 | 0 | 0 | 0 | ||||||
| Customer Deposits | BGN mil | 888 | 949 | 1,082 | 1,166 | 1,110 | ||||||
| Issued Debt Securities | BGN mil | 0 | 0 | 0 | 0 | 0 | ||||||
| Other Liabilities | BGN mil | 0 | 0 | 0 | 0 | 0 | ||||||
| growth rates | ||||||||||||
| Customer Loan Growth | % | ... | -17.4 | -12.6 | 24.9 | -15.1 | 1.44 | |||||
| Total Asset Growth | % | ... | -4.28 | 6.59 | 13.6 | 7.89 | -4.31 | |||||
| Shareholders' Equity Growth | % | ... | 4.54 | 0.565 | 9.87 | 8.28 | 7.33 | |||||
| Customer Deposit Growth | % | ... | -2.81 | 6.91 | 13.9 | 7.78 | -4.77 | |||||
| market share | ||||||||||||
| Market Share in Customer Loans | % | 0.772 | 0.656 | 0.818 | 0.752 | 0.776 | ||||||
| Market Share in Total Assets | % | 1.59 | 1.58 | 1.66 | 1.78 | 1.57 | ||||||
| Market Share in Customer Deposits | % | 1.66 | 1.64 | 1.72 | 1.82 | 1.66 |
| ratios | Unit | 2007 | 2008 | 2009 | 2010 | 2011 | 2012 | 2013 | 2014 | 2015 | 2016 | 2017 |
| ratios | ||||||||||||
| ROE | % | 4.73 | 9.54 | 9.10 | 7.93 | 6.92 | ||||||
| ROA | % | 0.299 | 0.611 | 0.557 | 0.479 | 0.443 | ||||||
| Costs (As % Of Assets) | % | 3.56 | 3.34 | 3.13 | 3.05 | 3.09 | ||||||
| Costs (As % Of Income) | % | 78.0 | 57.1 | 68.0 | 85.0 | 88.6 | ||||||
| Net Interest Margin | % | 3.13 | 3.20 | 2.91 | 2.14 | 2.34 | ||||||
| Interest Spread | % | ... | 2.96 | 3.05 | 2.79 | 2.03 | 2.27 | |||||
| Asset Yield | % | 5.62 | 5.38 | 4.82 | 3.76 | 3.31 | ||||||
| Cost Of Liabilities | % | ... | 2.66 | 2.34 | 2.03 | 1.72 | 1.04 | |||||
| Interest Income (As % Of Revenues) | % | 68.4 | 54.7 | 63.4 | 59.6 | 67.1 | ||||||
| Fee Income (As % Of Revenues) | % | 23.7 | 16.3 | 17.7 | 20.6 | 20.4 | ||||||
| Other Income (As % Of Revenues) | % | 7.92 | 29.1 | 18.9 | 19.8 | 12.5 | ||||||
| Equity (As % Of Assets) | % | 6.60 | 6.23 | 6.03 | 6.05 | 6.78 | ||||||
| Loans (As % Of Deposits) | % | 47.1 | 38.5 | 42.2 | 33.3 | 35.4 | ||||||
| Loans (As % Assets) | % | 43.8 | 35.9 | 39.5 | 31.1 | 33.0 | ||||||
| Cost of Provisions (As % Of Loans) | % | 1.49 | 4.85 | 2.43 | 0.074 | -0.251 |
Get all company financials in excel:
By Helgi Library - September 20, 2018
Municipal Bank generated total banking revenues of BGN 41.8 mil in 2017, down 2.84% compared to the previous year. Bulgarian banking sector banking sector generated total revenues of BGN 3,870 mil in 2017, down 4.62% when compared to the last year. ...
By Helgi Library - September 3, 2018
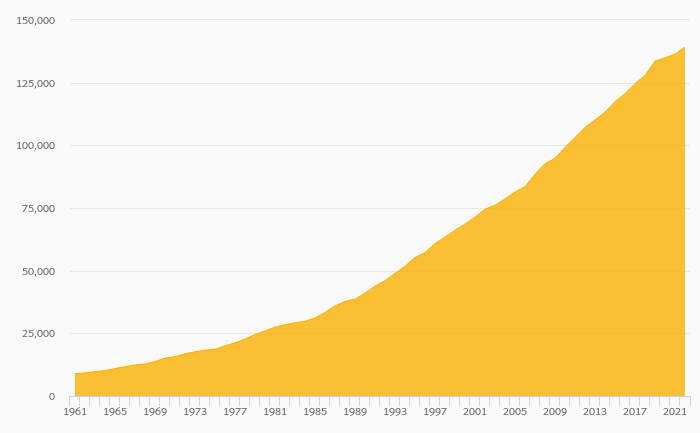
Municipal Bank's customer loans reached BGN 435 mil in 2017, down 3.03% compared to the previous year. Bulgarian banking sector provided customer loans of BGN 59.7 bil in 2017, up 6.73% when compared to the last year. Municipal Bank accounted for 0.729% o...
By Helgi Library - September 3, 2018
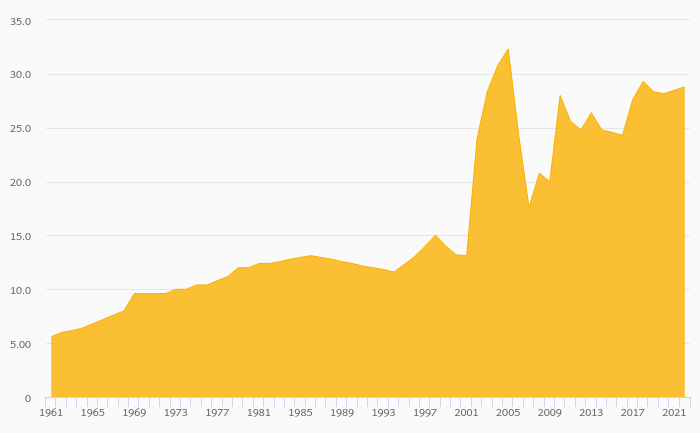
Municipal Bank generated total banking revenues of BGN 41.8 mil in 2017, down 2.84% compared to the previous year. Historically, the bank’s revenues containing of interest, fee and other non-interest income reached an all time high of BGN 57.7 mil in 2012 and a...
By Helgi Library - September 3, 2018
Municipal Bank's customer loan growth reached -3.03% in 2017, down from 14.0% compared to the previous year. Historically, the bank’s loans growth reached an all time high of 30.3% in 2010 and an all time low of -28.1% in 2008. In the last decade, the ave...

Municipal Bank has been growing its revenues and asset by -0.944% and 6.61% a year on average in the last 3 years. Its loans and deposits have grown by 3.89% and 6.58% a year during that time and loans to deposits ratio reached 30.8% at the end of 2017. The company achieved an average return on equity of 4.84% in the last three years with net profit growing -6.73% a year on average. In terms of operating efficiency, its cost to income ratio reached 86.0% in 2017, compared to 88.8% average in the last three years.
Equity represented 6.32% of total assets or 22.0% of loans at the end of 2017. Municipal Bank's non-performing loans were of total loans while provisions covered some of NPLs at the end of 2017.
 Helgi Library