By Helgi Library - September 3, 2018
Texim Bank Bulgaria's customer deposits reached BGN 181 mil in 2017, up 11.9% compared to the previous year. Bulgarian banking ...
By Helgi Library - September 3, 2018
Texim Bank Bulgaria's customer loans reached BGN 110 mil in 2017, up 18.6% compared to the previous year. Bulgarian banking sec...
By Helgi Library - September 3, 2018
Texim Bank Bulgaria made a net profit of BGN 0.120 mil under revenues of BGN 11.3 mil in 2017, up -81.8% and -27.8% respectively comp...
| Profit Statement | 2015 | 2016 | 2017 | |
| Net Interest Income | BGN mil | 5.02 | 5.49 | 6.32 |
| Net Fee Income | BGN mil | 1.24 | 1.70 | 2.33 |
| Other Income | BGN mil | 6.20 | 8.42 | 2.62 |
| Total Revenues | BGN mil | 12.5 | 15.6 | 11.3 |
| Operating Profit | BGN mil | 1.18 | 2.88 | -1.92 |
| Provisions | BGN mil | 1.20 | 0.955 | 0.996 |
| Net Profit | BGN mil | 0.120 | 0.659 | 0.120 |
| Balance Sheet | 2015 | 2016 | 2017 | |
| Customer Loans | BGN mil | 57.3 | 92.7 | 110 |
| Total Assets | BGN mil | 176 | 200 | 220 |
| Shareholders' Equity | BGN mil | 34.1 | 35.1 | 35.6 |
| Interbank Borrowing | BGN mil | 0 | 0 | 0 |
| Customer Deposits | BGN mil | 140 | 162 | 181 |
| Issued Debt Securities | BGN mil | 0 | 0 | 0 |
| Ratios | 2015 | 2016 | 2017 | |
| ROE | % | 0.362 | 1.90 | 0.339 |
| ROA | % | 0.074 | 0.351 | 0.057 |
| Costs (As % Of Assets) | % | 6.99 | 6.78 | 6.29 |
| Costs (As % Of Income) | % | 90.5 | 81.6 | 117 |
| Net Interest Margin | % | 3.11 | 2.92 | 3.01 |
| Loans (As % Of Deposits) | % | 40.9 | 57.2 | 60.7 |
| Growth Rates | 2015 | 2016 | 2017 | |
| Total Revenue Growth | % | 12.1 | 25.4 | -27.8 |
| Operating Cost Growth | % | 6.47 | 13.0 | 3.56 |
| Operating Profit Growth | % | 125 | 144 | -167 |
| Net Profit Growth | % | -30.6 | 449 | -81.8 |
| Customer Loan Growth | % | -16.1 | 61.9 | 18.6 |
| Total Asset Growth | % | 20.4 | 13.4 | 10.1 |
| Customer Deposit Growth | % | 24.2 | 15.6 | 11.9 |
| Shareholders' Equity Growth | % | 5.84 | 3.09 | 1.37 |
Get all company financials in excel:
| summary | Unit | 2007 | 2008 | 2009 | 2010 | 2011 | 2012 | 2013 | 2014 | 2015 | 2016 | 2017 |
| income statement | ||||||||||||
| Net Interest Income | BGN mil | -0.078 | -1.10 | 2.48 | 4.55 | 5.02 | ||||||
| Total Revenues | BGN mil | 3.24 | 3.19 | 6.53 | 11.1 | 12.5 | ||||||
| Operating Profit | BGN mil | -1.28 | -3.67 | -2.01 | 0.526 | 1.18 | ||||||
| Net Profit | BGN mil | -3.78 | -1.67 | 0.087 | 0.173 | 0.120 | ||||||
| balance sheet | ||||||||||||
| Customer Loans | BGN mil | 49.6 | 57.5 | 48.7 | 68.3 | 57.3 | ||||||
| Debt Securities | BGN mil | 14.5 | 31.7 | 34.9 | 19.3 | 43.3 | ||||||
| Total Assets | BGN mil | 97.9 | 126 | 123 | 146 | 176 | ||||||
| Shareholders' Equity | BGN mil | 16.3 | 32.7 | 33.0 | 32.2 | 34.1 | ||||||
| Interbank Borrowing | BGN mil | 0 | 0 | 0 | 0 | 0 | ||||||
| Customer Deposits | BGN mil | 80.5 | 92.2 | 89.0 | 113 | 140 | ||||||
| Issued Debt Securities | BGN mil | 0 | 0 | 0 | 0.004 | 0 | ||||||
| ratios | ||||||||||||
| ROE | % | -20.9 | -6.81 | 0.265 | 0.530 | 0.362 | ||||||
| ROA | % | -4.27 | -1.49 | 0.070 | 0.128 | 0.074 | ||||||
| Costs (As % Of Assets) | % | 5.10 | 6.12 | 6.85 | 7.85 | 6.99 | ||||||
| Costs (As % Of Income) | % | 140 | 215 | 131 | 95.3 | 90.5 | ||||||
| Net Interest Margin | % | -0.088 | -0.981 | 1.99 | 3.37 | 3.11 | ||||||
| Interest Income (As % Of Revenues) | % | -2.41 | -34.5 | 38.0 | 40.9 | 40.3 | ||||||
| Fee Income (As % Of Revenues) | % | 54.0 | 41.9 | 28.3 | 8.52 | 9.93 | ||||||
| Equity (As % Of Assets) | % | 16.6 | 25.9 | 26.8 | 22.0 | 19.3 | ||||||
| Loans (As % Of Deposits) | % | 61.7 | 62.4 | 54.7 | 60.5 | 40.9 | ||||||
| Loans (As % Assets) | % | 50.7 | 45.5 | 39.5 | 46.6 | 32.5 | ||||||
| valuation | ||||||||||||
| Book Value Per Share Growth | % | ... | -109 | 1,310 | -326 | 83.3 | 10.3 |
| income statement | Unit | 2007 | 2008 | 2009 | 2010 | 2011 | 2012 | 2013 | 2014 | 2015 | 2016 | 2017 |
| income statement | ||||||||||||
| Interest Income | BGN mil | 3.10 | 4.41 | 4.31 | 6.31 | 7.04 | ||||||
| Interest Cost | BGN mil | 3.18 | 5.51 | 1.83 | 1.76 | 2.02 | ||||||
| Net Interest Income | BGN mil | -0.078 | -1.10 | 2.48 | 4.55 | 5.02 | ||||||
| Net Fee Income | BGN mil | 1.75 | 1.34 | 1.85 | 0.947 | 1.24 | ||||||
| Other Income | BGN mil | 1.57 | 2.95 | 2.20 | 5.62 | 6.20 | ||||||
| Total Revenues | BGN mil | 3.24 | 3.19 | 6.53 | 11.1 | 12.5 | ||||||
| Depreciation | BGN mil | 0.505 | 0.400 | 0.865 | 1.01 | 1.03 | ||||||
| Operating Cost | BGN mil | 4.52 | 6.86 | 8.54 | 10.6 | 11.3 | ||||||
| Operating Profit | BGN mil | -1.28 | -3.67 | -2.01 | 0.526 | 1.18 | ||||||
| Provisions | BGN mil | 2.51 | -1.99 | -2.08 | 0.369 | 1.20 | ||||||
| Extra and Other Cost | BGN mil | -0.011 | -0.012 | -0.022 | -0.016 | -0.117 | ||||||
| Pre-Tax Profit | BGN mil | -3.78 | -1.67 | 0.087 | 0.173 | 0.100 | ||||||
| Tax | BGN mil | 0 | 0 | 0 | 0 | -0.020 | ||||||
| Minorities | BGN mil | 0 | 0 | 0 | 0 | 0 | ||||||
| Net Profit | BGN mil | -3.78 | -1.67 | 0.087 | 0.173 | 0.120 | ||||||
| growth rates | ||||||||||||
| Net Interest Income Growth | % | ... | -109 | 1,310 | -326 | 83.3 | 10.3 | |||||
| Net Fee Income Growth | % | ... | -10.5 | -23.6 | 38.4 | -48.7 | 30.6 | |||||
| Total Revenue Growth | % | ... | -5.35 | -1.51 | 105 | 70.2 | 12.1 | |||||
| Operating Cost Growth | % | ... | 10.2 | 51.9 | 24.6 | 23.9 | 6.47 | |||||
| Operating Profit Growth | % | ... | 88.8 | 187 | -45.1 | -126 | 125 | |||||
| Pre-Tax Profit Growth | % | ... | -973 | -55.9 | -105 | 98.9 | -42.2 | |||||
| Net Profit Growth | % | ... | -973 | -55.9 | -105 | 98.9 | -30.6 | |||||
| market share | ||||||||||||
| Market Share in Revenues | % | 0.082 | 0.083 | 0.176 | 0.285 | 0.302 | ||||||
| Market Share in Net Profit | % | ... | ... | 0.017 | 0.024 | 0.013 |
| balance sheet | Unit | 2007 | 2008 | 2009 | 2010 | 2011 | 2012 | 2013 | 2014 | 2015 | 2016 | 2017 |
| balance sheet | ||||||||||||
| Cash | BGN mil | 9.06 | 7.06 | 6.43 | 18.3 | 33.9 | ||||||
| Customer Loans | BGN mil | 49.6 | 57.5 | 48.7 | 68.3 | 57.3 | ||||||
| Debt Securities | BGN mil | 14.5 | 31.7 | 34.9 | 19.3 | 43.3 | ||||||
| Fixed Assets | BGN mil | 12.5 | 16.2 | 16.5 | 18.8 | 19.3 | ||||||
| Total Assets | BGN mil | 97.9 | 126 | 123 | 146 | 176 | ||||||
| Shareholders' Equity | BGN mil | 16.3 | 32.7 | 33.0 | 32.2 | 34.1 | ||||||
| Of Which Minority Interest | BGN mil | 0 | 0 | 0 | 0 | 0 | ||||||
| Liabilities | BGN mil | 81.6 | 93.6 | 90.2 | 114 | 142 | ||||||
| Interbank Borrowing | BGN mil | 0 | 0 | 0 | 0 | 0 | ||||||
| Customer Deposits | BGN mil | 80.5 | 92.2 | 89.0 | 113 | 140 | ||||||
| Issued Debt Securities | BGN mil | 0 | 0 | 0 | 0.004 | 0 | ||||||
| Other Liabilities | BGN mil | 0 | 0 | 0 | 0 | 0 | ||||||
| growth rates | ||||||||||||
| Customer Loan Growth | % | ... | -8.04 | 15.9 | -15.4 | 40.3 | -16.1 | |||||
| Total Asset Growth | % | ... | 23.7 | 29.1 | -2.48 | 18.8 | 20.4 | |||||
| Shareholders' Equity Growth | % | ... | -18.7 | 101 | 0.926 | -2.48 | 5.84 | |||||
| Customer Deposit Growth | % | ... | 38.7 | 14.6 | -3.43 | 26.7 | 24.2 | |||||
| market share | ||||||||||||
| Market Share in Customer Loans | % | 0.092 | 0.103 | 0.087 | 0.132 | 0.113 | ||||||
| Market Share in Total Assets | % | 0.163 | 0.196 | 0.177 | 0.209 | 0.231 | ||||||
| Market Share in Customer Deposits | % | 0.151 | 0.159 | 0.142 | 0.176 | 0.210 |
| ratios | Unit | 2007 | 2008 | 2009 | 2010 | 2011 | 2012 | 2013 | 2014 | 2015 | 2016 | 2017 |
| ratios | ||||||||||||
| ROE | % | -20.9 | -6.81 | 0.265 | 0.530 | 0.362 | ||||||
| ROA | % | -4.27 | -1.49 | 0.070 | 0.128 | 0.074 | ||||||
| Costs (As % Of Assets) | % | 5.10 | 6.12 | 6.85 | 7.85 | 6.99 | ||||||
| Costs (As % Of Income) | % | 140 | 215 | 131 | 95.3 | 90.5 | ||||||
| Net Interest Margin | % | -0.088 | -0.981 | 1.99 | 3.37 | 3.11 | ||||||
| Interest Spread | % | ... | -1.01 | -2.36 | 1.46 | 2.96 | 2.79 | |||||
| Asset Yield | % | 3.50 | 3.93 | 3.45 | 4.68 | 4.36 | ||||||
| Cost Of Liabilities | % | ... | 4.51 | 6.29 | 1.99 | 1.72 | 1.58 | |||||
| Interest Income (As % Of Revenues) | % | -2.41 | -34.5 | 38.0 | 40.9 | 40.3 | ||||||
| Fee Income (As % Of Revenues) | % | 54.0 | 41.9 | 28.3 | 8.52 | 9.93 | ||||||
| Other Income (As % Of Revenues) | % | 48.4 | 92.6 | 33.7 | 50.6 | 49.8 | ||||||
| Equity (As % Of Assets) | % | 16.6 | 25.9 | 26.8 | 22.0 | 19.3 | ||||||
| Loans (As % Of Deposits) | % | 61.7 | 62.4 | 54.7 | 60.5 | 40.9 | ||||||
| Loans (As % Assets) | % | 50.7 | 45.5 | 39.5 | 46.6 | 32.5 | ||||||
| Cost of Provisions (As % Of Loans) | % | 4.85 | -3.72 | -3.92 | 0.631 | 1.91 |
Get all company financials in excel:
By Helgi Library - September 20, 2018
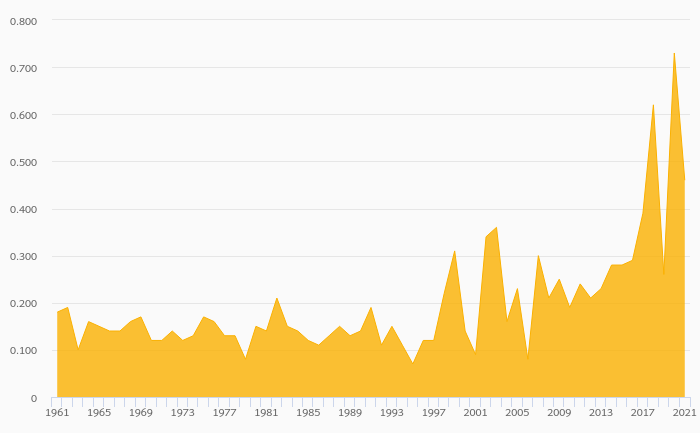
Texim Bank Bulgaria generated total banking revenues of BGN 11.3 mil in 2017, down 27.8% compared to the previous year. Bulgarian banking sector banking sector generated total revenues of BGN 3,870 mil in 2017, down 4.62% when compared to the last yea...
By Helgi Library - September 3, 2018
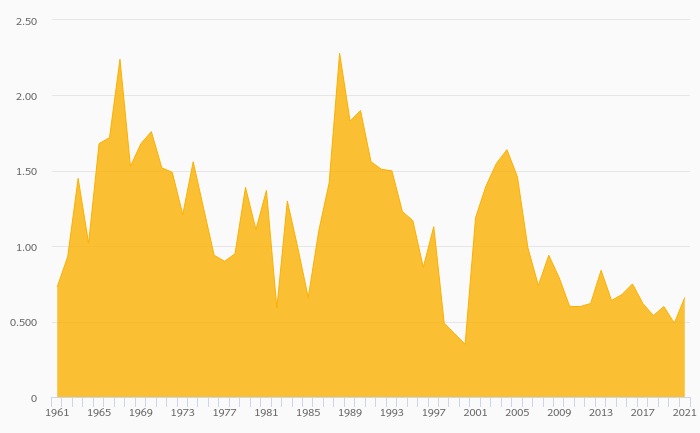
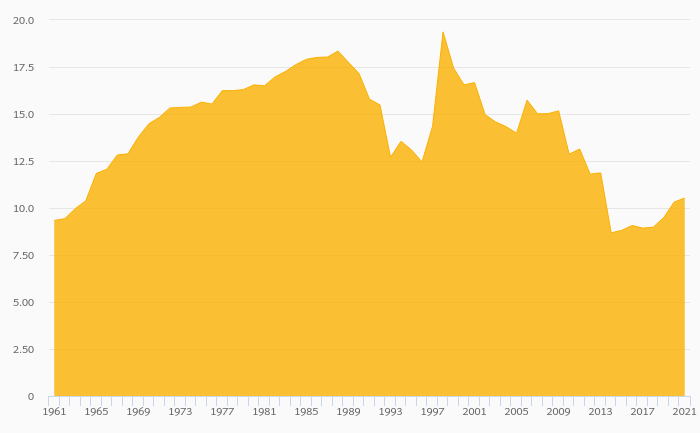
Texim Bank Bulgaria's net interest margin amounted to 3.01% in 2017, up from 2.92% compared to the previous year. Historically, the bank’s net interest margin reached an all time high of 3.69% in 2009 and an all time low of -0.981% in 2012. The average ...
By Helgi Library - September 3, 2018
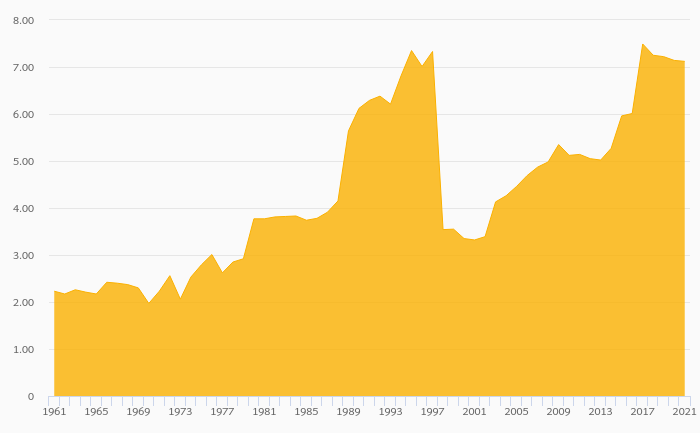
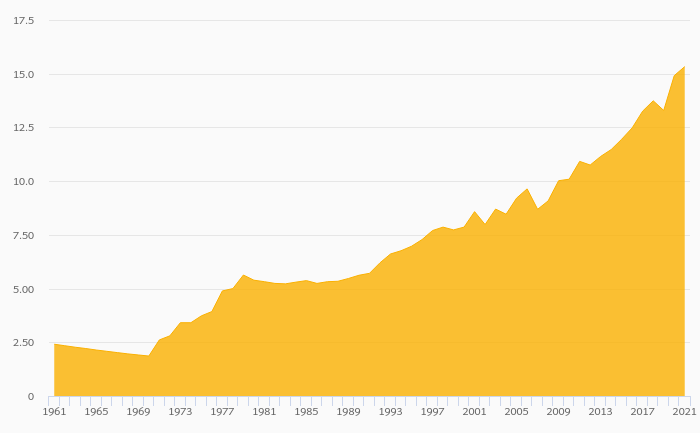
Texim Bank Bulgaria generated total banking revenues of BGN 11.3 mil in 2017, down 27.8% compared to the previous year. Historically, the bank’s revenues containing of interest, fee and other non-interest income reached an all time high of BGN 15.6 mil in 2016 ...
By Helgi Library - September 3, 2018
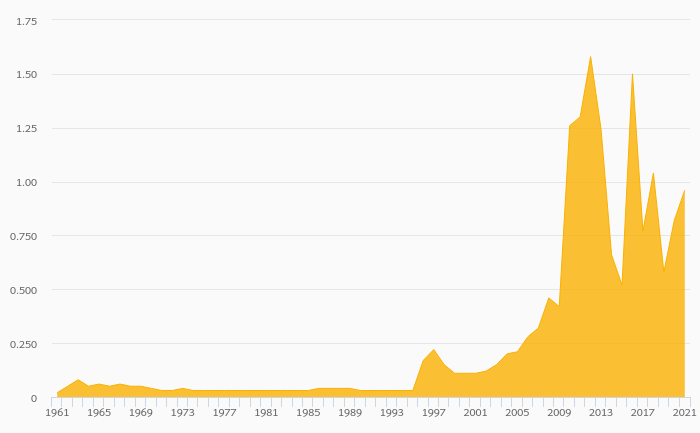
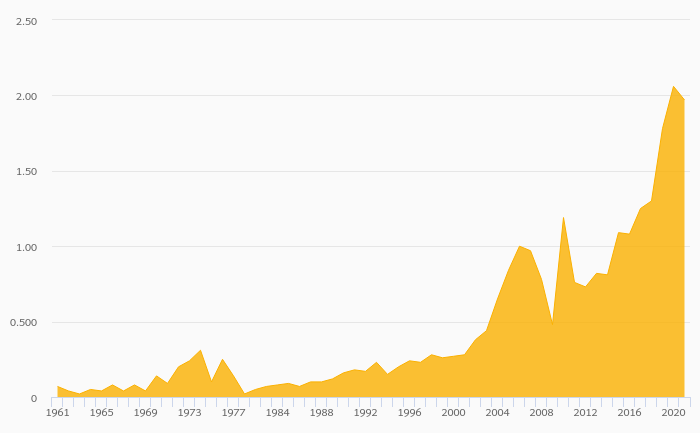
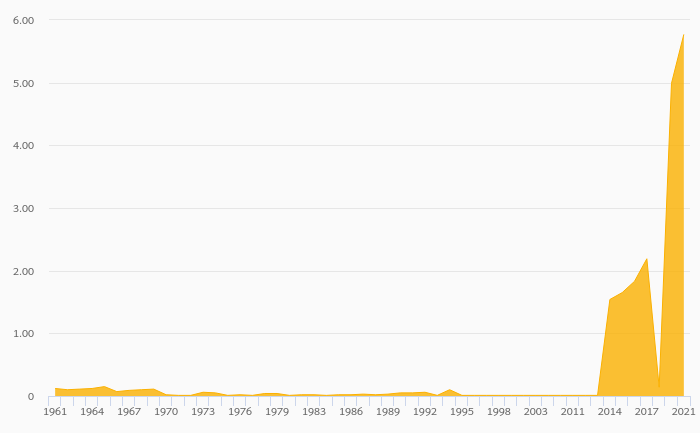
Texim Bank Bulgaria's customer loan growth reached 18.6% in 2017, down from 61.9% compared to the previous year. Historically, the bank’s loans growth reached an all time high of 61.9% in 2016 and an all time low of -16.3% in 2008. In the last decade, the...

Texim Bank Bulgaria has been growing its revenues and asset by 0.469% and 14.5% a year on average in the last 3 years. Its loans and deposits have grown by 17.2% and 17.1% a year during that time and loans to deposits ratio reached 60.7% at the end of 2017. The company achieved an average return on equity of 0.868% in the last three years with net profit growing -11.5% a year on average. In terms of operating efficiency, its cost to income ratio reached 117% in 2017, compared to 96.4% average in the last three years.
Equity represented 16.2% of total assets or 32.4% of loans at the end of 2017. Texim Bank Bulgaria's non-performing loans were of total loans while provisions covered some of NPLs at the end of 2017.
 Helgi Library