By Helgi Library - August 16, 2020
Stock Spirits Group made a net profit of EUR 11.1 mil with revenues of EUR 77.3 mil in 1Q2020, up by 285% and down by 0.3...
By Helgi Library - August 16, 2020
Stock Spirits Group stock traded at EUR 1.94 per share at the end 1Q2020 translating into a market capitalization of USD 423 mil. ...
By Helgi Library - August 16, 2020
Stock Spirits Group made a net profit of EUR 11.1 mil with revenues of EUR 77.3 mil in 1Q2020, up by 285% and down by 0.337%, ...
| Profit Statement | Sep 2019 | Dec 2019 | Mar 2020 | |
| Sales | EUR mil | 78.2 | 77.6 | 77.3 |
| Gross Profit | EUR mil | 37.2 | 36.5 | 36.8 |
| EBITDA | EUR mil | 16.2 | 10.4 | 15.2 |
| EBIT | EUR mil | 13.9 | 7.61 | 13.6 |
| Financing Cost | EUR mil | 0.837 | 0.909 | 0.827 |
| Pre-Tax Profit | EUR mil | 12.9 | 6.27 | 12.7 |
| Net Profit | EUR mil | 11.3 | 2.93 | 11.1 |
| Dividends | EUR mil | 6.34 | 2.60 | 6.21 |
| Balance Sheet | Sep 2019 | Dec 2019 | Mar 2020 | |
| Total Assets | EUR mil | 673 | 642 | 664 |
| Non-Current Assets | EUR mil | 452 | 411 | 437 |
| Current Assets | EUR mil | 221 | 232 | 226 |
| Working Capital | EUR mil | 132 | 126 | 129 |
| Shareholders' Equity | EUR mil | 361 | 346 | 354 |
| Liabilities | EUR mil | 312 | 296 | 310 |
| Total Debt | EUR mil | 105 | 103 | 115 |
| Net Debt | EUR mil | 42.0 | 27.6 | 44.9 |
| Ratios | Sep 2019 | Dec 2019 | Mar 2020 | |
| ROE | % | 12.6 | 3.31 | 12.7 |
| ROCE | % | 7.92 | 2.09 | 8.07 |
| Gross Margin | % | 47.6 | 47.0 | 47.6 |
| EBITDA Margin | % | 20.8 | 13.4 | 19.7 |
| EBIT Margin | % | 17.8 | 9.81 | 17.6 |
| Net Margin | % | 14.4 | 3.78 | 14.4 |
| Net Debt/EBITDA | 0.815 | 0.529 | 0.776 | |
| Net Debt/Equity | % | 11.6 | 7.96 | 12.7 |
| Cost of Financing | % | 3.19 | 3.49 | 3.04 |
| Valuation | Sep 2019 | Dec 2019 | Mar 2020 | |
| Market Capitalisation | USD mil | 564 | 564 | 423 |
| Enterprise Value (EV) | USD mil | 609 | 594 | 472 |
| Number Of Shares | mil | 200 | 200 | 200 |
| Share Price | EUR | 2.59 | 2.59 | 1.94 |
| EV/EBITDA | 10.6 | 10.3 | 7.26 | |
| EV/Sales | 1.75 | 1.73 | 1.35 | |
| Price/Earnings (P/E) | 18.3 | 18.3 | 10.6 | |
| Price/Book Value (P/BV) | 1.43 | 1.49 | 1.10 | |
| Dividend Yield | % | 1.23 | 0.505 | 1.61 |
Get all company financials in excel:
| overview | Unit | Mar 2010 | Jun 2010 | Sep 2010 | Dec 2010 | Mar 2011 | Jun 2011 | Sep 2011 | Dec 2011 | Mar 2012 | Jun 2012 | Sep 2012 | Dec 2012 | Mar 2013 | Jun 2013 | Sep 2013 | Dec 2013 | Mar 2014 | Jun 2014 | Sep 2014 | Dec 2014 | Mar 2015 | Jun 2015 | Sep 2015 | Dec 2015 | Mar 2016 | Jun 2016 | Sep 2016 | Dec 2016 | Mar 2017 | Jun 2017 | Sep 2017 | Dec 2017 | Mar 2018 | Jun 2018 | Sep 2018 | Dec 2018 | Mar 2019 | Jun 2019 | Sep 2019 | Dec 2019 | Mar 2020 |
| income statement | ||||||||||||||||||||||||||||||||||||||||||
| Sales | EUR mil | 105 | 79.3 | 77.6 | 77.3 | 78.2 | ||||||||||||||||||||||||||||||||||||
| Gross Profit | EUR mil | 48.6 | 37.3 | 36.5 | 36.8 | 37.2 | ||||||||||||||||||||||||||||||||||||
| EBIT | EUR mil | 7.71 | 7.63 | 7.46 | 13.8 | 13.9 | ||||||||||||||||||||||||||||||||||||
| Net Profit | EUR mil | 5.34 | 2.95 | 2.89 | 11.2 | 11.3 | ||||||||||||||||||||||||||||||||||||
| ROE | % | ... | ... | ... | ... | 6.13 | 3.37 | 3.32 | 12.8 | 12.6 | ||||||||||||||||||||||||||||||||
| EBIT Margin | % | 7.34 | 9.62 | 9.62 | 17.8 | 17.8 | ||||||||||||||||||||||||||||||||||||
| Net Margin | % | 5.08 | 3.72 | 3.72 | 14.4 | 14.4 | ||||||||||||||||||||||||||||||||||||
| Employees | ... | ... | ... | ... | ... | ... | ... | ... | ... | ... | ... | ... | ... | ... | ... | ... | ||||||||||||||||||||||||||
| balance sheet | ||||||||||||||||||||||||||||||||||||||||||
| Total Assets | EUR mil | ... | ... | ... | 628 | 635 | 642 | 658 | 673 | |||||||||||||||||||||||||||||||||
| Non-Current Assets | EUR mil | ... | ... | ... | 427 | 419 | 411 | 431 | 452 | |||||||||||||||||||||||||||||||||
| Current Assets | EUR mil | ... | ... | ... | 201 | 217 | 232 | 226 | 221 | |||||||||||||||||||||||||||||||||
| Shareholders' Equity | EUR mil | ... | ... | ... | 352 | 349 | 346 | 354 | 361 | |||||||||||||||||||||||||||||||||
| Liabilities | EUR mil | ... | ... | ... | 276 | 286 | 296 | 304 | 312 | |||||||||||||||||||||||||||||||||
| Non-Current Liabilities | EUR mil | ... | ... | ... | 133 | 143 | 153 | 160 | 166 | |||||||||||||||||||||||||||||||||
| Current Liabilities | EUR mil | ... | ... | ... | 143 | 143 | 143 | 144 | 145 | |||||||||||||||||||||||||||||||||
| Net Debt/EBITDA | ... | ... | ... | 0.589 | 0.646 | 0.636 | 0.730 | 0.815 | ||||||||||||||||||||||||||||||||||
| Net Debt/Equity | % | ... | ... | ... | 8.86 | 8.41 | 7.96 | 9.82 | 11.6 | |||||||||||||||||||||||||||||||||
| Cost of Financing | % | ... | ... | ... | ... | ... | 4.28 | 3.72 | 3.19 | 3.19 | ||||||||||||||||||||||||||||||||
| cash flow | ||||||||||||||||||||||||||||||||||||||||||
| Total Cash From Operations | EUR mil | 14.4 | 12.8 | 12.5 | 11.2 | 11.3 | ||||||||||||||||||||||||||||||||||||
| Total Cash From Investing | EUR mil | -2.43 | -3.89 | -3.81 | -17.0 | -17.2 | ||||||||||||||||||||||||||||||||||||
| Total Cash From Financing | EUR mil | -7.84 | 3.82 | 3.73 | 0.153 | 0.155 | ||||||||||||||||||||||||||||||||||||
| Net Change In Cash | EUR mil | 3.70 | 12.9 | 12.6 | -6.10 | -6.16 | ||||||||||||||||||||||||||||||||||||
| valuation | ||||||||||||||||||||||||||||||||||||||||||
| Market Capitalisation | USD mil | ... | ... | ... | ... | ... | ... | ... | ... | ... | ... | ... | ... | ... | ... | ... | 514 | 529 | 538 | 567 | 564 | |||||||||||||||||||||
| Enterprise Value (EV) | USD mil | ... | ... | ... | ... | ... | ... | ... | ... | ... | ... | ... | ... | ... | ... | ... | 550 | 563 | 569 | 607 | 609 | |||||||||||||||||||||
| Number Of Shares | mil | ... | ... | ... | ... | ... | ... | ... | ... | ... | ... | ... | ... | ... | ... | ... | 199 | 199 | 199 | 199 | 200 | |||||||||||||||||||||
| Share Price | EUR | ... | ... | ... | ... | ... | ... | ... | ... | ... | ... | ... | ... | ... | ... | ... | 2.23 | 2.32 | 2.41 | 2.50 | 2.59 | |||||||||||||||||||||
| Price/Earnings (P/E) | ... | ... | ... | ... | ... | ... | ... | ... | ... | ... | ... | ... | ... | ... | ... | 24.8 | 21.9 | 27.3 | 22.3 | 18.3 | ||||||||||||||||||||||
| Price/Cash Earnings (P/CE) | ... | ... | ... | ... | ... | ... | ... | ... | ... | ... | ... | ... | ... | ... | ... | ... | ... | ... | 15.0 | 14.4 | 17.2 | 15.3 | 14.2 | |||||||||||||||||||
| EV/EBITDA | ... | ... | ... | ... | ... | ... | ... | ... | ... | ... | ... | ... | ... | ... | ... | 8.95 | 10.7 | 11.6 | 11.3 | 10.6 | ||||||||||||||||||||||
| Price/Book Value (P/BV) | ... | ... | ... | ... | ... | ... | ... | ... | ... | ... | ... | ... | ... | ... | ... | 1.26 | 1.32 | 1.39 | 1.41 | 1.43 | ||||||||||||||||||||||
| Dividend Yield | % | ... | ... | ... | ... | ... | ... | ... | ... | ... | ... | ... | ... | ... | ... | ... | 2.71 | 0.577 | 0.543 | 1.26 | 1.23 |
| income statement | Unit | Mar 2010 | Jun 2010 | Sep 2010 | Dec 2010 | Mar 2011 | Jun 2011 | Sep 2011 | Dec 2011 | Mar 2012 | Jun 2012 | Sep 2012 | Dec 2012 | Mar 2013 | Jun 2013 | Sep 2013 | Dec 2013 | Mar 2014 | Jun 2014 | Sep 2014 | Dec 2014 | Mar 2015 | Jun 2015 | Sep 2015 | Dec 2015 | Mar 2016 | Jun 2016 | Sep 2016 | Dec 2016 | Mar 2017 | Jun 2017 | Sep 2017 | Dec 2017 | Mar 2018 | Jun 2018 | Sep 2018 | Dec 2018 | Mar 2019 | Jun 2019 | Sep 2019 | Dec 2019 | Mar 2020 |
| income statement | ||||||||||||||||||||||||||||||||||||||||||
| Sales | EUR mil | 105 | 79.3 | 77.6 | 77.3 | 78.2 | ||||||||||||||||||||||||||||||||||||
| Cost of Goods & Services | EUR mil | 56.5 | 42.0 | 41.1 | 40.5 | 41.0 | ||||||||||||||||||||||||||||||||||||
| Gross Profit | EUR mil | 48.6 | 37.3 | 36.5 | 36.8 | 37.2 | ||||||||||||||||||||||||||||||||||||
| Selling, General & Admin | EUR mil | ... | ... | ... | ... | ... | ... | 41.2 | 23.4 | 22.9 | 23.2 | 23.4 | ||||||||||||||||||||||||||||||
| Research & Development | EUR mil | ... | 0 | 0 | ... | ... | ||||||||||||||||||||||||||||||||||||
| Other Operating Expense | EUR mil | 0 | 15.1 | 14.7 | 6.96 | 7.03 | ||||||||||||||||||||||||||||||||||||
| Staff Cost | EUR mil | ... | ... | ... | ... | ... | ... | ... | ... | ... | ... | ... | ... | ... | ||||||||||||||||||||||||||||
| Other Operating Cost (Income) | EUR mil | 0 | 0 | 0 | 0 | 0 | ||||||||||||||||||||||||||||||||||||
| EBITDA | EUR mil | 12.3 | 9.72 | 9.51 | 16.1 | 16.2 | ||||||||||||||||||||||||||||||||||||
| Depreciation | EUR mil | 4.62 | 1.70 | 1.67 | 2.30 | 2.33 | ||||||||||||||||||||||||||||||||||||
| EBIT | EUR mil | 7.71 | 7.63 | 7.46 | 13.8 | 13.9 | ||||||||||||||||||||||||||||||||||||
| Net Financing Cost | EUR mil | ... | ... | ... | ... | ... | ... | ... | ... | ... | 0.888 | 0.868 | 0.772 | 0.780 | ||||||||||||||||||||||||||||
| Financing Cost | EUR mil | ... | 0.930 | 0.909 | 0.827 | 0.837 | ||||||||||||||||||||||||||||||||||||
| Financing Income | EUR mil | ... | ... | ... | ... | ... | ... | ... | ... | ... | 0.042 | 0.041 | 0.056 | 0.056 | ||||||||||||||||||||||||||||
| FX (Gain) Loss | EUR mil | ... | -0.010 | -0.010 | 0.050 | 0.051 | ||||||||||||||||||||||||||||||||||||
| (Income) / Loss from Affiliates | EUR mil | ... | ... | ... | ... | ... | ... | ... | ... | -0.054 | 0.213 | 0.209 | 0.057 | 0.057 | ||||||||||||||||||||||||||||
| Extraordinary Cost | EUR mil | 0 | 0 | 0 | 0 | 0 | ||||||||||||||||||||||||||||||||||||
| Pre-Tax Profit | EUR mil | 7.49 | 6.37 | 6.23 | 12.7 | 12.9 | ||||||||||||||||||||||||||||||||||||
| Tax | EUR mil | 2.16 | 3.42 | 3.34 | 1.57 | 1.59 | ||||||||||||||||||||||||||||||||||||
| Minorities | EUR mil | 0 | 0 | 0 | 0 | 0 | ||||||||||||||||||||||||||||||||||||
| Net Profit | EUR mil | 5.34 | 2.95 | 2.89 | 11.2 | 11.3 | ||||||||||||||||||||||||||||||||||||
| Net Profit Avail. to Common | EUR mil | 5.34 | 2.95 | 2.89 | 11.2 | 11.3 | ||||||||||||||||||||||||||||||||||||
| Dividends | EUR mil | ... | ... | ... | ... | ... | ... | ... | ... | ... | ... | ... | ... | 12.0 | 2.66 | 2.60 | 6.28 | 6.34 | ||||||||||||||||||||||||
| growth rates | ||||||||||||||||||||||||||||||||||||||||||
| Total Revenue Growth | % | ... | ... | ... | ... | 35.8 | 2.48 | 25.8 | 24.0 | -25.6 | ||||||||||||||||||||||||||||||||
| Operating Cost Growth | % | ... | ... | ... | ... | 67.4 | 21.4 | 36.6 | 7.41 | -43.0 | ||||||||||||||||||||||||||||||||
| Staff Cost Growth | % | ... | ... | ... | ... | ... | ... | ... | ... | ... | ... | ... | ... | ... | ... | ... | ... | ... | ||||||||||||||||||||||||
| EBITDA Growth | % | ... | ... | ... | ... | -28.0 | -43.3 | -18.3 | 36.4 | 31.6 | ||||||||||||||||||||||||||||||||
| EBIT Growth | % | ... | ... | ... | ... | -46.2 | -46.8 | -17.3 | 50.7 | 80.3 | ||||||||||||||||||||||||||||||||
| Pre-Tax Profit Growth | % | ... | ... | ... | ... | 28.5 | 9.30 | -25.8 | 50.0 | 71.9 | ||||||||||||||||||||||||||||||||
| Net Profit Growth | % | ... | ... | ... | ... | -3,024 | -1,718 | -54.2 | 75.0 | 112 | ||||||||||||||||||||||||||||||||
| ratios | ||||||||||||||||||||||||||||||||||||||||||
| ROE | % | ... | ... | ... | ... | 6.13 | 3.37 | 3.32 | 12.8 | 12.6 | ||||||||||||||||||||||||||||||||
| ROA | % | ... | ... | ... | ... | 3.42 | 1.87 | 1.81 | 6.87 | 6.79 | ||||||||||||||||||||||||||||||||
| ROCE | % | ... | ... | ... | ... | 3.91 | 2.18 | 2.15 | 8.16 | 7.92 | ||||||||||||||||||||||||||||||||
| Gross Margin | % | 46.2 | 47.0 | 47.0 | 47.6 | 47.6 | ||||||||||||||||||||||||||||||||||||
| EBITDA Margin | % | 11.7 | 12.3 | 12.3 | 20.8 | 20.8 | ||||||||||||||||||||||||||||||||||||
| EBIT Margin | % | 7.34 | 9.62 | 9.62 | 17.8 | 17.8 | ||||||||||||||||||||||||||||||||||||
| Net Margin | % | 5.08 | 3.72 | 3.72 | 14.4 | 14.4 | ||||||||||||||||||||||||||||||||||||
| Payout Ratio | % | ... | ... | ... | ... | ... | ... | ... | ... | ... | ... | ... | ... | 225 | 90.1 | 90.1 | 56.2 | 56.2 | ||||||||||||||||||||||||
| Cost of Financing | % | ... | ... | ... | ... | ... | 4.28 | 3.72 | 3.19 | 3.19 | ||||||||||||||||||||||||||||||||
| Net Debt/EBITDA | ... | ... | ... | 0.589 | 0.646 | 0.636 | 0.730 | 0.815 |
| balance sheet | Unit | Mar 2010 | Jun 2010 | Sep 2010 | Dec 2010 | Mar 2011 | Jun 2011 | Sep 2011 | Dec 2011 | Mar 2012 | Jun 2012 | Sep 2012 | Dec 2012 | Mar 2013 | Jun 2013 | Sep 2013 | Dec 2013 | Mar 2014 | Jun 2014 | Sep 2014 | Dec 2014 | Mar 2015 | Jun 2015 | Sep 2015 | Dec 2015 | Mar 2016 | Jun 2016 | Sep 2016 | Dec 2016 | Mar 2017 | Jun 2017 | Sep 2017 | Dec 2017 | Mar 2018 | Jun 2018 | Sep 2018 | Dec 2018 | Mar 2019 | Jun 2019 | Sep 2019 | Dec 2019 | Mar 2020 |
| balance sheet | ||||||||||||||||||||||||||||||||||||||||||
| Cash & Cash Equivalents | EUR mil | ... | ... | ... | 50.1 | 63.1 | 75.7 | 69.6 | 63.4 | |||||||||||||||||||||||||||||||||
| Receivables | EUR mil | ... | ... | ... | 110 | 110 | 115 | 110 | 111 | |||||||||||||||||||||||||||||||||
| Inventories | EUR mil | ... | ... | ... | 30.7 | 32.0 | 33.2 | 38.1 | 43.1 | |||||||||||||||||||||||||||||||||
| Other ST Assets | EUR mil | ... | ... | ... | 120 | 63.2 | 7.46 | 60.8 | 115 | |||||||||||||||||||||||||||||||||
| Current Assets | EUR mil | ... | ... | ... | 201 | 217 | 232 | 226 | 221 | |||||||||||||||||||||||||||||||||
| Property, Plant & Equipment | EUR mil | ... | ... | ... | 47.3 | 47.2 | 47.2 | 50.4 | 53.7 | |||||||||||||||||||||||||||||||||
| LT Investments & Receivables | EUR mil | ... | ... | ... | 0 | 0 | 0 | 0 | 0 | |||||||||||||||||||||||||||||||||
| Intangible Assets | EUR mil | ... | ... | ... | 357 | 349 | 342 | 359 | 377 | |||||||||||||||||||||||||||||||||
| Goodwill | EUR mil | ... | ... | ... | 45.9 | 42.0 | 38.2 | 44.0 | 49.8 | |||||||||||||||||||||||||||||||||
| Non-Current Assets | EUR mil | ... | ... | ... | 427 | 419 | 411 | 431 | 452 | |||||||||||||||||||||||||||||||||
| Total Assets | EUR mil | ... | ... | ... | 628 | 635 | 642 | 658 | 673 | |||||||||||||||||||||||||||||||||
| Trade Payables | EUR mil | ... | ... | ... | 22.0 | 22.0 | 22.0 | 22.0 | 22.0 | |||||||||||||||||||||||||||||||||
| Short-Term Debt | EUR mil | ... | ... | ... | 0.016 | 0.045 | 0.073 | 0.038 | 0.002 | |||||||||||||||||||||||||||||||||
| Other ST Liabilities | EUR mil | ... | ... | ... | 0.783 | 0.472 | 0.168 | 0.741 | 1.32 | |||||||||||||||||||||||||||||||||
| Current Liabilities | EUR mil | ... | ... | ... | 143 | 143 | 143 | 144 | 145 | |||||||||||||||||||||||||||||||||
| Long-Term Debt | EUR mil | ... | ... | ... | 81.3 | 92.4 | 103 | 104 | 105 | |||||||||||||||||||||||||||||||||
| Other LT Liabilities | EUR mil | ... | ... | ... | 51.5 | 50.7 | 49.9 | 55.4 | 61.0 | |||||||||||||||||||||||||||||||||
| Non-Current Liabilities | EUR mil | ... | ... | ... | 133 | 143 | 153 | 160 | 166 | |||||||||||||||||||||||||||||||||
| Liabilities | EUR mil | ... | ... | ... | 276 | 286 | 296 | 304 | 312 | |||||||||||||||||||||||||||||||||
| Preferred Equity and Hybrid Capital | EUR mil | ... | ... | ... | 0 | 0 | 0 | 0 | 0 | |||||||||||||||||||||||||||||||||
| Share Capital | EUR mil | ... | ... | ... | 23.6 | 23.6 | 23.6 | 23.6 | 23.6 | |||||||||||||||||||||||||||||||||
| Treasury Stock | EUR mil | 3.37 | 3.20 | 3.04 | 2.88 | 2.72 | ||||||||||||||||||||||||||||||||||||
| Equity Before Minority Interest | EUR mil | ... | ... | ... | 352 | 349 | 346 | 354 | 361 | |||||||||||||||||||||||||||||||||
| Minority Interest | EUR mil | ... | ... | ... | 0 | 0 | 0 | 0 | 0 | |||||||||||||||||||||||||||||||||
| Equity | EUR mil | ... | ... | ... | 352 | 349 | 346 | 354 | 361 | |||||||||||||||||||||||||||||||||
| growth rates | ||||||||||||||||||||||||||||||||||||||||||
| Total Asset Growth | % | ... | ... | ... | ... | 1.15 | 1.19 | 1.15 | 2.38 | 2.35 | ||||||||||||||||||||||||||||||||
| Shareholders' Equity Growth | % | ... | ... | ... | ... | 2.07 | -0.797 | -0.786 | 2.17 | 2.14 | ||||||||||||||||||||||||||||||||
| Net Debt Growth | % | ... | ... | ... | ... | -24.5 | -5.82 | -6.05 | 26.0 | 20.8 | ||||||||||||||||||||||||||||||||
| Total Debt Growth | % | ... | ... | ... | ... | -11.3 | 13.7 | 11.8 | 1.03 | 1.04 | ||||||||||||||||||||||||||||||||
| ratios | ||||||||||||||||||||||||||||||||||||||||||
| Total Debt | EUR mil | ... | ... | ... | 81.3 | 92.4 | 103 | 104 | 105 | |||||||||||||||||||||||||||||||||
| Net Debt | EUR mil | ... | ... | ... | 31.2 | 29.4 | 27.6 | 34.7 | 42.0 | |||||||||||||||||||||||||||||||||
| Working Capital | EUR mil | ... | ... | ... | 119 | 120 | 126 | 126 | 132 | |||||||||||||||||||||||||||||||||
| Capital Employed | EUR mil | ... | ... | ... | 545 | 539 | 537 | 557 | 584 | |||||||||||||||||||||||||||||||||
| Net Debt/Equity | % | ... | ... | ... | 8.86 | 8.41 | 7.96 | 9.82 | 11.6 | |||||||||||||||||||||||||||||||||
| Current Ratio | ... | ... | ... | 1.41 | 1.51 | 1.62 | 1.57 | 1.52 | ||||||||||||||||||||||||||||||||||
| Quick Ratio | ... | ... | ... | 1.12 | 1.21 | 1.33 | 1.24 | 1.20 |
| cash flow | Unit | Mar 2010 | Jun 2010 | Sep 2010 | Dec 2010 | Mar 2011 | Jun 2011 | Sep 2011 | Dec 2011 | Mar 2012 | Jun 2012 | Sep 2012 | Dec 2012 | Mar 2013 | Jun 2013 | Sep 2013 | Dec 2013 | Mar 2014 | Jun 2014 | Sep 2014 | Dec 2014 | Mar 2015 | Jun 2015 | Sep 2015 | Dec 2015 | Mar 2016 | Jun 2016 | Sep 2016 | Dec 2016 | Mar 2017 | Jun 2017 | Sep 2017 | Dec 2017 | Mar 2018 | Jun 2018 | Sep 2018 | Dec 2018 | Mar 2019 | Jun 2019 | Sep 2019 | Dec 2019 | Mar 2020 |
| cash flow | ||||||||||||||||||||||||||||||||||||||||||
| Net Profit | EUR mil | 5.34 | 2.95 | 2.89 | 11.2 | 11.3 | ||||||||||||||||||||||||||||||||||||
| Depreciation | EUR mil | 4.62 | 1.70 | 1.67 | 2.30 | 2.33 | ||||||||||||||||||||||||||||||||||||
| Non-Cash Items | EUR mil | 3.47 | 6.60 | 6.45 | -2.90 | -2.93 | ||||||||||||||||||||||||||||||||||||
| Change in Working Capital | EUR mil | 3.91 | 1.16 | 1.14 | 0.611 | 0.618 | ||||||||||||||||||||||||||||||||||||
| Total Cash From Operations | EUR mil | 14.4 | 12.8 | 12.5 | 11.2 | 11.3 | ||||||||||||||||||||||||||||||||||||
| Capital Expenditures | EUR mil | -1.68 | -2.38 | -2.33 | -2.72 | -2.75 | ||||||||||||||||||||||||||||||||||||
| Net Change in LT Investment | EUR mil | -0.758 | -1.52 | -1.48 | 0 | 0 | ||||||||||||||||||||||||||||||||||||
| Net Cash From Acquisitions | EUR mil | 0 | 0 | 0 | -15.8 | -16.0 | ||||||||||||||||||||||||||||||||||||
| Other Investing Activities | EUR mil | 0.002 | 0.004 | 0.003 | 0.007 | 0.007 | ||||||||||||||||||||||||||||||||||||
| Total Cash From Investing | EUR mil | -2.43 | -3.89 | -3.81 | -17.0 | -17.2 | ||||||||||||||||||||||||||||||||||||
| Dividends Paid | EUR mil | -5.87 | -6.04 | -5.91 | -2.57 | -2.60 | ||||||||||||||||||||||||||||||||||||
| Issuance Of Shares | EUR mil | -0.888 | 0 | 0 | 0 | 0 | ||||||||||||||||||||||||||||||||||||
| Issuance Of Debt | EUR mil | -1.08 | 9.86 | 9.65 | 2.72 | 2.75 | ||||||||||||||||||||||||||||||||||||
| Other Financing Activities | EUR mil | 0 | 0 | 0 | 0 | 0 | ||||||||||||||||||||||||||||||||||||
| Total Cash From Financing | EUR mil | -7.84 | 3.82 | 3.73 | 0.153 | 0.155 | ||||||||||||||||||||||||||||||||||||
| Effect of FX Rates | EUR mil | -0.443 | 0.185 | 0.181 | -0.392 | -0.397 | ||||||||||||||||||||||||||||||||||||
| Net Change In Cash | EUR mil | 3.70 | 12.9 | 12.6 | -6.10 | -6.16 | ||||||||||||||||||||||||||||||||||||
| ratios | ||||||||||||||||||||||||||||||||||||||||||
| Days Sales Outstanding | days | ... | ... | ... | 131 | 130 | 130 | 118 | 130 | |||||||||||||||||||||||||||||||||
| Days Sales Of Inventory | days | ... | ... | ... | 70.8 | 72.1 | 70.6 | 77.2 | 95.5 | |||||||||||||||||||||||||||||||||
| Days Payable Outstanding | days | ... | ... | ... | 50.7 | 49.7 | 46.8 | 44.6 | 48.8 | |||||||||||||||||||||||||||||||||
| Cash Conversion Cycle | days | ... | ... | ... | 151 | 153 | 153 | 151 | 176 | |||||||||||||||||||||||||||||||||
| Cash Earnings | EUR mil | 9.96 | 4.65 | 4.55 | 13.5 | 13.6 | ||||||||||||||||||||||||||||||||||||
| Free Cash Flow | EUR mil | 12.0 | 8.91 | 8.72 | -5.86 | -5.92 | ||||||||||||||||||||||||||||||||||||
| Capital Expenditures (As % of Sales) | % | 1.59 | 3.00 | 3.00 | 3.52 | 3.52 |
| other ratios | Unit | Mar 2010 | Jun 2010 | Sep 2010 | Dec 2010 | Mar 2011 | Jun 2011 | Sep 2011 | Dec 2011 | Mar 2012 | Jun 2012 | Sep 2012 | Dec 2012 | Mar 2013 | Jun 2013 | Sep 2013 | Dec 2013 | Mar 2014 | Jun 2014 | Sep 2014 | Dec 2014 | Mar 2015 | Jun 2015 | Sep 2015 | Dec 2015 | Mar 2016 | Jun 2016 | Sep 2016 | Dec 2016 | Mar 2017 | Jun 2017 | Sep 2017 | Dec 2017 | Mar 2018 | Jun 2018 | Sep 2018 | Dec 2018 | Mar 2019 | Jun 2019 | Sep 2019 | Dec 2019 | Mar 2020 |
| Employees | ... | ... | ... | ... | ... | ... | ... | ... | ... | ... | ... | ... | ... | ... | ... | ... | ||||||||||||||||||||||||||
| Cost Per Employee | USD per month | ... | ... | ... | ... | ... | ... | ... | ... | ... | ... | ... | ... | ... | ... | ... | ... | |||||||||||||||||||||||||
| Cost Per Employee (Local Currency) | EUR per month | ... | ... | ... | ... | ... | ... | ... | ... | ... | ... | ... | ... | ... | ... | ... | ... | |||||||||||||||||||||||||
| Operating Cost (As % of Sales) | % | 38.9 | 37.4 | 37.4 | 29.8 | 29.8 | ||||||||||||||||||||||||||||||||||||
| Research & Development (As % of Sales) | % | ... | 0 | 0 | ... | ... | ||||||||||||||||||||||||||||||||||||
| Staff Cost (As % of Sales) | % | ... | ... | ... | ... | ... | ... | ... | ... | ... | ... | ... | ... | ... | ||||||||||||||||||||||||||||
| Effective Tax Rate | % | 28.8 | 53.7 | 53.7 | 12.3 | 12.3 | ||||||||||||||||||||||||||||||||||||
| Total Revenue Growth (5-year average) | % | ... | ... | ... | ... | ... | ... | ... | ... | ... | ... | ... | ... | ... | ... | ... | ... | ... | ... | ... | ... | 2.33 | -3.28 | 2.53 | 2.23 | 0.181 | ||||||||||||||||
| Total Revenue Growth (10-year average) | % | ... | ... | ... | ... | ... | ... | ... | ... | ... | ... | ... | ... | ... | ... | ... | ... | ... | ... | ... | ... | ... | ... | ... | ... | ... | ... | ... | ... | ... | ... | ... | ... | ... | ... | ... | ... | ... | ... | ... | ... |
| valuation | Unit | Mar 2010 | Jun 2010 | Sep 2010 | Dec 2010 | Mar 2011 | Jun 2011 | Sep 2011 | Dec 2011 | Mar 2012 | Jun 2012 | Sep 2012 | Dec 2012 | Mar 2013 | Jun 2013 | Sep 2013 | Dec 2013 | Mar 2014 | Jun 2014 | Sep 2014 | Dec 2014 | Mar 2015 | Jun 2015 | Sep 2015 | Dec 2015 | Mar 2016 | Jun 2016 | Sep 2016 | Dec 2016 | Mar 2017 | Jun 2017 | Sep 2017 | Dec 2017 | Mar 2018 | Jun 2018 | Sep 2018 | Dec 2018 | Mar 2019 | Jun 2019 | Sep 2019 | Dec 2019 | Mar 2020 |
| Market Capitalisation | USD mil | ... | ... | ... | ... | ... | ... | ... | ... | ... | ... | ... | ... | ... | ... | ... | 514 | 529 | 538 | 567 | 564 | |||||||||||||||||||||
| Enterprise Value (EV) | USD mil | ... | ... | ... | ... | ... | ... | ... | ... | ... | ... | ... | ... | ... | ... | ... | 550 | 563 | 569 | 607 | 609 | |||||||||||||||||||||
| Number Of Shares | mil | ... | ... | ... | ... | ... | ... | ... | ... | ... | ... | ... | ... | ... | ... | ... | 199 | 199 | 199 | 199 | 200 | |||||||||||||||||||||
| Share Price | EUR | ... | ... | ... | ... | ... | ... | ... | ... | ... | ... | ... | ... | ... | ... | ... | 2.23 | 2.32 | 2.41 | 2.50 | 2.59 | |||||||||||||||||||||
| EV/EBITDA | ... | ... | ... | ... | ... | ... | ... | ... | ... | ... | ... | ... | ... | ... | ... | 8.95 | 10.7 | 11.6 | 11.3 | 10.6 | ||||||||||||||||||||||
| Price/Earnings (P/E) | ... | ... | ... | ... | ... | ... | ... | ... | ... | ... | ... | ... | ... | ... | ... | 24.8 | 21.9 | 27.3 | 22.3 | 18.3 | ||||||||||||||||||||||
| Price/Cash Earnings (P/CE) | ... | ... | ... | ... | ... | ... | ... | ... | ... | ... | ... | ... | ... | ... | ... | ... | ... | ... | 15.0 | 14.4 | 17.2 | 15.3 | 14.2 | |||||||||||||||||||
| P/FCF | ... | ... | ... | ... | ... | ... | ... | ... | ... | ... | ... | ... | ... | ... | ... | ... | ... | ... | 11.6 | 9.06 | 10.7 | 20.9 | 87.6 | |||||||||||||||||||
| Price/Book Value (P/BV) | ... | ... | ... | ... | ... | ... | ... | ... | ... | ... | ... | ... | ... | ... | ... | 1.26 | 1.32 | 1.39 | 1.41 | 1.43 | ||||||||||||||||||||||
| Dividend Yield | % | ... | ... | ... | ... | ... | ... | ... | ... | ... | ... | ... | ... | ... | ... | ... | 2.71 | 0.577 | 0.543 | 1.26 | 1.23 | |||||||||||||||||||||
| Free Cash Flow Yield | % | ... | ... | ... | ... | ... | ... | ... | ... | ... | ... | ... | ... | ... | ... | ... | 8.61 | 11.1 | 9.41 | 4.74 | 1.16 | |||||||||||||||||||||
| Earnings Per Share (EPS) | EUR | ... | ... | ... | ... | ... | ... | ... | ... | ... | ... | ... | ... | ... | ... | ... | 0.027 | 0.015 | 0.015 | 0.056 | 0.057 | |||||||||||||||||||||
| Cash Earnings Per Share | EUR | ... | ... | ... | ... | ... | ... | ... | ... | ... | ... | ... | ... | ... | ... | ... | 0.050 | 0.023 | 0.023 | 0.068 | 0.068 | |||||||||||||||||||||
| Free Cash Flow Per Share | EUR | ... | ... | ... | ... | ... | ... | ... | ... | ... | ... | ... | ... | ... | ... | ... | 0.060 | 0.045 | 0.044 | -0.029 | -0.030 | |||||||||||||||||||||
| Book Value Per Share | EUR | ... | ... | ... | ... | ... | ... | ... | ... | ... | ... | ... | ... | ... | ... | ... | 1.77 | 1.75 | 1.74 | 1.77 | 1.81 | |||||||||||||||||||||
| Dividend Per Share | EUR | ... | ... | ... | ... | ... | ... | ... | ... | ... | ... | ... | ... | ... | ... | ... | 0.060 | 0.013 | 0.013 | 0.032 | 0.032 | |||||||||||||||||||||
| EV/Sales | ... | ... | ... | ... | ... | ... | ... | ... | ... | ... | ... | ... | ... | ... | ... | 1.54 | 1.58 | 1.55 | 1.58 | 1.75 | ||||||||||||||||||||||
| EV/EBIT | ... | ... | ... | ... | ... | ... | ... | ... | ... | ... | ... | ... | ... | ... | ... | 11.8 | 14.6 | 15.7 | 14.7 | 12.8 | ||||||||||||||||||||||
| EV/Free Cash Flow | ... | ... | ... | ... | ... | ... | ... | ... | ... | ... | ... | ... | ... | ... | ... | 12.4 | 9.61 | 11.2 | 22.6 | 93.5 | ||||||||||||||||||||||
| EV/Capital Employed | ... | ... | ... | ... | ... | ... | ... | ... | ... | ... | ... | ... | ... | ... | ... | 0.869 | 0.911 | 0.945 | 0.957 | 0.957 | ||||||||||||||||||||||
| Earnings Per Share Growth | % | ... | ... | ... | ... | ... | ... | ... | ... | ... | ... | ... | ... | ... | ... | ... | ... | -16.5 | -44.7 | -2.29 | 286 | 0.983 | ||||||||||||||||||||
| Cash Earnings Per Share Growth | % | ... | ... | ... | ... | ... | ... | ... | ... | ... | ... | ... | ... | ... | ... | ... | ... | 14.6 | -53.3 | -2.29 | 196 | 0.983 | ||||||||||||||||||||
| Book Value Per Share Growth | % | ... | ... | ... | ... | ... | ... | ... | ... | ... | ... | ... | ... | ... | ... | ... | ... | 1.99 | -0.911 | -0.900 | 2.05 | 2.03 |
Get all company financials in excel:


By Helgi Library - August 16, 2020
Stock Spirits Group stock traded at EUR 1.94 per share at the end 1Q2020 implying a market capitalization of USD 423 mil. Since the end of 1Q2015, stock has appreciated by -29.9% implying an annual average growth of -6.87% In absolute terms, the value of the com...
By Helgi Library - August 16, 2020
Stock Spirits Group made a net profit of EUR 11.1 mil in 1Q2020, up 285% compared to the previous year. Historically, between 1Q2010 and 1Q2020, the company's net profit reached a high of EUR 16.5 mil in 4Q2012 and a low of EUR -5.39 mil in 2Q2013. The re...
By Helgi Library - October 12, 2020
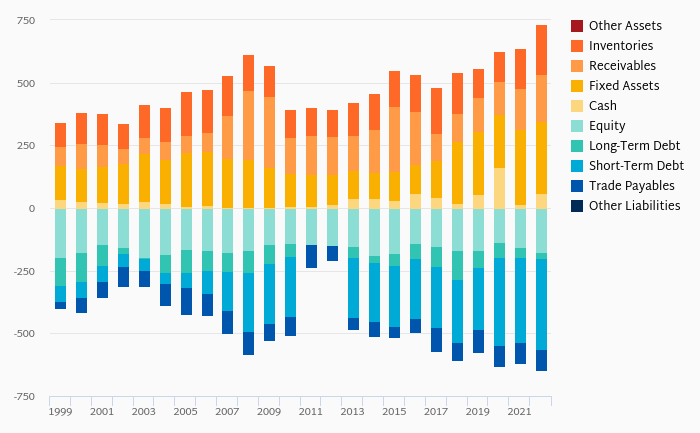
Stock Spirits Group's total assets reached EUR 664 mil at the end of 1Q2020, up 3.28% compared to the previous year. Current assets amounted to EUR 226 mil, or 34.1% of total assets while cash stood at EUR 69.6 mil at the end of 1Q2020. ...
By Helgi Library - August 16, 2020
Stock Spirits Group's operating cash flow stood at EUR 10.4 mil in 1Q2020, down 16.7% when compared to the previous year. Historically, between 1Q2010 - 1Q2020, the firm’s operating cash flow reached a high of EUR 42.7 mil in 4Q2013 and a low of EUR -2...
By Helgi Library - August 16, 2020
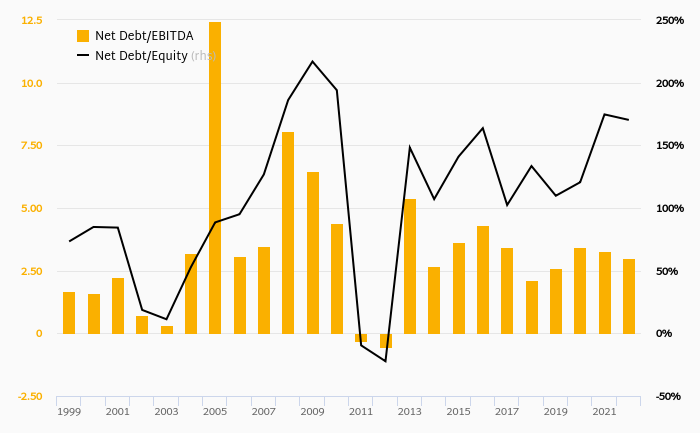
Stock Spirits Group's net debt stood at EUR 44.9 mil and accounted for 12.7% of equity at the end of 1Q2020. The ratio is up 4.74 pp compared to the previous year. Historically, the firm’s net debt to equity reached a high of 472% in 4Q2010 and a...
By Helgi Library - August 16, 2020
Stock Spirits Group invested a total of EUR 2.72 mil in 1Q2020, up 17.1% compared to the previous year. Historically, between 1Q2010 - 1Q2020, the company's investments stood at a high of EUR 5.80 mil in 4Q2013 and a low of EUR 0.649 mil in ...
By Helgi Library - August 16, 2020
Stock Spirits Group stock traded at EUR 1.94 per share at the end 1Q2020 translating into a market capitalization of USD 423 mil. Since the end of 1Q2015, the stock has depreciated by 29.9% representing an annual average growth of -6.87%. At the end of 1...
By Helgi Library - April 2, 2020
Stock Spirits Group stock traded at EUR 2.59 per share at the end 2019 translating into a market capitalization of USD 580 mil. Since the end of 2014, the stock has depreciated by 15.9% representing an annual average growth of -3.41%. At the end of 2019,...
By Helgi Library - April 3, 2020
Stock Spirits Group invested a total of EUR 10.2 mil in 2019, up 257% compared to the previous year. Historically, between 2010 - 2019, the company's investments stood at a high of EUR 20.9 mil in 2013 and a low of EUR 2.85 mil in 2018. ...
By Helgi Library - April 2, 2020
Stock Spirits Group's net debt stood at EUR 42.0 mil and accounted for 11.6% of equity at the end of 2019. The ratio is up 2.76 pp compared to the previous year. Historically, the firm’s net debt to equity reached a high of 472% in 2010 and a low...
Stock Spirits Group Plc is a UK-based company which produces and markets a range of established and drinks brands. The Group was created in 2007 with the backing of Oaktree Capital Management and focuses primarrily on the territories in the Central Europe and the USA. The Company's brands include Stock 84 brandy, Fernet Stock bitter, Keglevich and Wodka Zoladkowa. The Company operates two main production and bottling sites in Lublin, Poland and in Plzen, Czech Republic and a small production unit in Drietoma, Slovakia. The Company also operates a small distillery in Pradlo, Czech Republic, and has an ethanol distillery plant in Rostock, Germany

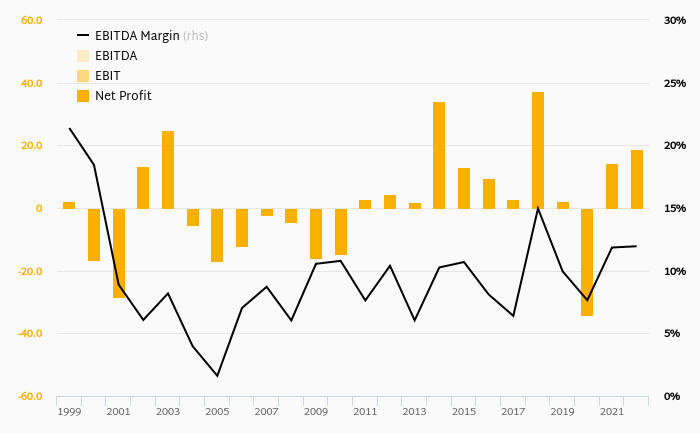
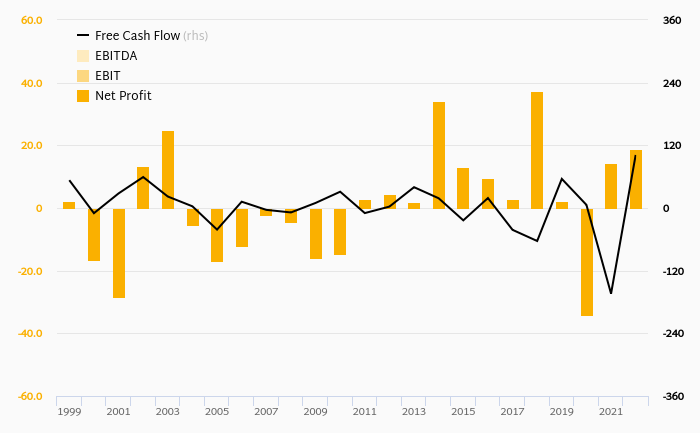
Stock Spirits Group has been growing its sales by 1.31% a year on average in the last 5 years. EBITDA has fallen on average by 4.43% a year during that time to total of EUR 51.5 mil in 2019, or 16.5% of sales. That’s compared to 19.6% average margin seen in last five years.
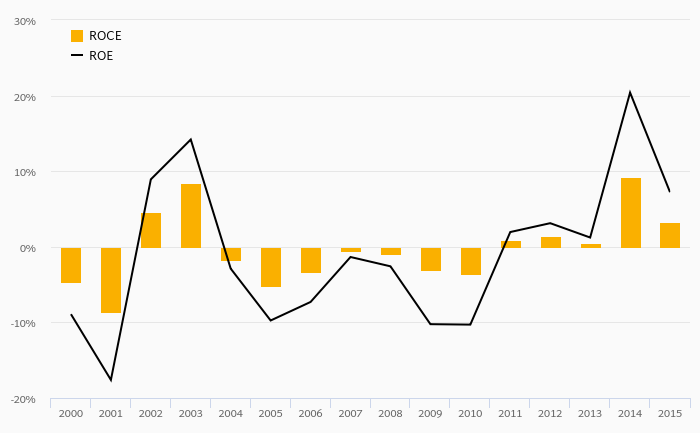
The company netted EUR 28.3 mil in 2019 implying ROE of 7.94% and ROCE of 5.49%. Again, the average figures were 5.70% and 3.69%, respectively when looking at the previous 5 years.
Stock Spirits Group’s net debt amounted to EUR 42.0 mil at the end of 2019, or 11.6% of equity. When compared to EBITDA, net debt was 0.815x, down when compared to average of 0.913x seen in the last 5 years.
Stock Spirits Group stock traded at EUR 2.59 per share at the end of 2019 resulting in a market capitalization of USD 580 mil. Over the previous five years, stock price fell by 15.9% or -3.41% a year on average. The closing price put stock at a 12-month trailing EV/EBITDA of 10.4x and price to earnings (PE) of 18.3x as of 2019.
 Helgi Library