By Helgi Library - April 2, 2020
CD Cargo's total assets reached CZK 14,706 mil at the end of 2015, up 2.62% compared to the previous year. Current...
| Profit Statement | 2013 | 2014 | 2015 | |
| Sales | CZK mil | 12,713 | 12,141 | 11,990 |
| Gross Profit | CZK mil | 5,448 | 5,355 | 5,242 |
| EBITDA | CZK mil | 1,555 | 1,820 | 1,356 |
| EBIT | CZK mil | 563 | 893 | 368 |
| Financing Cost | CZK mil | -38.2 | 168 | 133 |
| Pre-Tax Profit | CZK mil | 601 | 725 | 235 |
| Net Profit | CZK mil | 430 | 535 | 140 |
| Balance Sheet | 2013 | 2014 | 2015 | |
| Total Assets | CZK mil | 14,693 | 14,331 | 14,706 |
| Non-Current Assets | CZK mil | 11,547 | 11,254 | 11,303 |
| Current Assets | CZK mil | 2,673 | 2,565 | 2,954 |
| Working Capital | CZK mil | 202 | -266 | -356 |
| Shareholders' Equity | CZK mil | 6,444 | 6,983 | 7,238 |
| Liabilities | CZK mil | 8,249 | 7,348 | 7,467 |
| Total Debt | CZK mil | 3,345 | 2,158 | 2,158 |
| Net Debt | CZK mil | 2,904 | 1,478 | 1,294 |
| Ratios | 2013 | 2014 | 2015 | |
| ROE | % | 7.34 | 7.97 | 1.96 |
| ROCE | % | 3.26 | 4.70 | 1.27 |
| Gross Margin | % | 42.9 | 44.1 | 43.7 |
| EBITDA Margin | % | 12.2 | 15.0 | 11.3 |
| EBIT Margin | % | 4.43 | 7.35 | 3.07 |
| Net Margin | % | 3.38 | 4.41 | 1.16 |
| Net Debt/EBITDA | 1.87 | 0.812 | 0.954 | |
| Net Debt/Equity | 0.451 | 0.212 | 0.179 | |
| Cost of Financing | % | -0.785 | 6.11 | 6.14 |
| Cash Flow | 2013 | 2014 | 2015 | |
| Total Cash From Operations | CZK mil | 1,309 | 1,515 | 1,220 |
| Total Cash From Investing | CZK mil | -647 | -65.1 | -822 |
| Total Cash From Financing | CZK mil | -380 | -1,207 | -214 |
| Net Change In Cash | CZK mil | 283 | 243 | 184 |
| Cash Conversion Cycle | days | -25.2 | -45.7 | -51.7 |
| Cash Earnings | CZK mil | 1,422 | 1,463 | 1,128 |
| Free Cash Flow | CZK mil | 663 | 1,450 | 398 |
Get all company financials in excel:
| summary | Unit | 2007 | 2008 | 2009 | 2010 | 2011 | 2012 | 2013 | 2014 | 2015 |
| income statement | ||||||||||
| Sales | CZK mil | ... | 13,325 | 14,217 | 14,233 | 14,167 | 12,713 | |||
| Gross Profit | CZK mil | ... | 5,626 | 5,727 | 6,485 | 5,980 | 5,448 | |||
| EBIT | CZK mil | ... | 7.56 | -125 | 334 | -322 | 563 | |||
| Net Profit | CZK mil | ... | -428 | -427 | -38.0 | -788 | 430 | |||
| ROE | % | ... | -5.18 | -5.27 | -0.541 | -13.9 | 7.34 | |||
| EBIT Margin | % | ... | 0.057 | -0.878 | 2.35 | -2.27 | 4.43 | |||
| Net Margin | % | ... | -3.21 | -3.00 | -0.267 | -5.56 | 3.38 | |||
| Employees | ... | 10,378 | 9,573 | 9,207 | 8,910 | 7,998 | ||||
| balance sheet | ||||||||||
| Total Assets | CZK mil | 15,672 | 15,653 | 16,755 | 17,512 | 14,693 | ||||
| Non-Current Assets | CZK mil | 12,424 | 13,045 | 14,203 | 15,120 | 11,547 | ||||
| Current Assets | CZK mil | 2,938 | 2,272 | 2,553 | 2,361 | 2,673 | ||||
| Shareholders' Equity | CZK mil | 8,230 | 7,967 | 6,058 | 5,270 | 6,444 | ||||
| Liabilities | CZK mil | 7,441 | 7,686 | 10,697 | 12,241 | 8,249 | ||||
| Non-Current Liabilities | CZK mil | 2,331 | 1,604 | 5,369 | 5,708 | 2,213 | ||||
| Current Liabilities | CZK mil | 3,990 | 3,496 | 5,329 | 6,533 | 3,769 | ||||
| Net Debt/EBITDA | ... | -0.150 | 2.02 | 2.32 | 3.94 | 1.87 | ||||
| Net Debt/Equity | -0.020 | 0.250 | 0.851 | 1.17 | 0.451 | |||||
| Cost of Financing | % | ... | 76.2 | 26.0 | 8.00 | 4.61 | -0.785 | |||
| cash flow | ||||||||||
| Total Cash From Operations | CZK mil | ... | 559 | 1,333 | 1,821 | 2,063 | 1,309 | |||
| Total Cash From Investing | CZK mil | ... | -842 | -1,960 | -1,514 | -3,040 | -647 | |||
| Total Cash From Financing | CZK mil | ... | 235 | 668 | -407 | 1,051 | -380 | |||
| Net Change In Cash | CZK mil | ... | -48.3 | 40.8 | -101 | 73.5 | 283 |
| income statement | Unit | 2007 | 2008 | 2009 | 2010 | 2011 | 2012 | 2013 | 2014 | 2015 |
| income statement | ||||||||||
| Sales | CZK mil | ... | 13,325 | 14,217 | 14,233 | 14,167 | 12,713 | |||
| Cost of Goods & Services | CZK mil | ... | 7,698 | 8,491 | 7,747 | 8,187 | 7,265 | |||
| Gross Profit | CZK mil | ... | 5,626 | 5,727 | 6,485 | 5,980 | 5,448 | |||
| Staff Cost | CZK mil | ... | 4,956 | 4,707 | 4,456 | 4,414 | 4,206 | |||
| Other Cost | CZK mil | ... | -414 | 34.2 | -191 | 1.84 | -313 | |||
| EBITDA | CZK mil | ... | 1,084 | 986 | 2,221 | 1,564 | 1,555 | |||
| Depreciation | CZK mil | ... | 1,076 | 1,111 | 1,886 | 1,886 | 992 | |||
| EBIT | CZK mil | ... | 7.56 | -125 | 334 | -322 | 563 | |||
| Financing Cost | CZK mil | ... | 395 | 293 | 302 | 270 | -38.2 | |||
| Extraordinary Cost | CZK mil | ... | -9.49 | 0.010 | -24.6 | -0.835 | 0 | |||
| Pre-Tax Profit | CZK mil | ... | -378 | -418 | 57.0 | -591 | 601 | |||
| Tax | CZK mil | ... | -49.3 | -9.02 | 94.9 | 196 | 171 | |||
| Minorities | CZK mil | ... | 0 | 0 | 0 | 0 | 0 | |||
| Net Profit | CZK mil | ... | -428 | -427 | -38.0 | -788 | 430 | |||
| growth rates | ||||||||||
| Total Revenue Growth | % | ... | ... | -28.3 | 6.70 | 0.107 | -0.463 | -10.3 | ||
| Operating Cost Growth | % | ... | ... | -13.0 | 4.37 | -10.0 | 3.55 | -11.8 | ||
| EBITDA Growth | % | ... | ... | -31.2 | -9.03 | 125 | -29.6 | -0.559 | ||
| EBIT Growth | % | ... | ... | -98.6 | -1,752 | -368 | -196 | -275 | ||
| Pre-Tax Profit Growth | % | ... | ... | -193 | 10.5 | -114 | -1,138 | -202 | ||
| Net Profit Growth | % | ... | ... | -241 | -0.141 | -91.1 | 1,975 | -155 | ||
| ratios | ||||||||||
| ROE | % | ... | -5.18 | -5.27 | -0.541 | -13.9 | 7.34 | |||
| ROCE | % | ... | -3.50 | -3.41 | -0.286 | -5.50 | 3.26 | |||
| Gross Margin | % | ... | 42.2 | 40.3 | 45.6 | 42.2 | 42.9 | |||
| EBITDA Margin | % | ... | 8.13 | 6.94 | 15.6 | 11.0 | 12.2 | |||
| EBIT Margin | % | ... | 0.057 | -0.878 | 2.35 | -2.27 | 4.43 | |||
| Net Margin | % | ... | -3.21 | -3.00 | -0.267 | -5.56 | 3.38 | |||
| Cost of Financing | % | ... | 76.2 | 26.0 | 8.00 | 4.61 | -0.785 | |||
| Net Debt/EBITDA | ... | -0.150 | 2.02 | 2.32 | 3.94 | 1.87 |
| balance sheet | Unit | 2007 | 2008 | 2009 | 2010 | 2011 | 2012 | 2013 | 2014 | 2015 |
| balance sheet | ||||||||||
| Non-Current Assets | CZK mil | 12,424 | 13,045 | 14,203 | 15,120 | 11,547 | ||||
| Property, Plant & Equipment | CZK mil | 12,123 | 12,663 | 13,939 | 14,846 | 10,740 | ||||
| Intangible Assets | CZK mil | 235 | 247 | 196 | 237 | 281 | ||||
| Current Assets | CZK mil | 2,938 | 2,272 | 2,553 | 2,361 | 2,673 | ||||
| Inventories | CZK mil | 142 | 119 | 90.0 | 89.3 | 146 | ||||
| Receivables | CZK mil | 2,561 | 1,906 | 1,874 | 1,844 | 1,644 | ||||
| Cash & Cash Equivalents | CZK mil | 196 | 236 | 166 | 239 | 441 | ||||
| Total Assets | CZK mil | 15,672 | 15,653 | 16,755 | 17,512 | 14,693 | ||||
| Shareholders' Equity | CZK mil | 8,230 | 7,967 | 6,058 | 5,270 | 6,444 | ||||
| Of Which Minority Interest | CZK mil | ... | ... | ... | ... | 27.4 | 32.8 | 0 | ||
| Liabilities | CZK mil | 7,441 | 7,686 | 10,697 | 12,241 | 8,249 | ||||
| Non-Current Liabilities | CZK mil | 2,331 | 1,604 | 5,369 | 5,708 | 2,213 | ||||
| Long-Term Debt | CZK mil | 0 | 0 | 4,353 | 4,749 | 1,500 | ||||
| Deferred Tax Liabilities | CZK mil | 303 | 422 | 89.0 | 270 | 544 | ||||
| Current Liabilities | CZK mil | 3,990 | 3,496 | 5,329 | 6,533 | 3,769 | ||||
| Short-Term Debt | CZK mil | 32.8 | 2,225 | 970 | 1,646 | 1,845 | ||||
| Trade Payables | CZK mil | 2,596 | 2,532 | 2,142 | 2,439 | 1,589 | ||||
| Provisions | CZK mil | 41.7 | 294 | 772 | 1,321 | 1,399 | ||||
| Equity And Liabilities | CZK mil | 15,672 | 15,653 | 16,755 | 17,512 | 14,693 | ||||
| growth rates | ||||||||||
| Total Asset Growth | % | ... | -1.98 | -0.122 | 7.04 | 4.52 | -16.1 | |||
| Shareholders' Equity Growth | % | ... | -0.627 | -3.20 | -24.0 | -13.0 | 22.3 | |||
| Net Debt Growth | % | ... | -121 | -1,321 | 159 | 19.4 | -52.8 | |||
| Total Debt Growth | % | ... | -96.7 | 6,688 | 139 | 20.1 | -47.7 | |||
| ratios | ||||||||||
| Total Debt | CZK mil | 32.8 | 2,225 | 5,323 | 6,395 | 3,345 | ||||
| Net Debt | CZK mil | -163 | 1,989 | 5,157 | 6,156 | 2,904 | ||||
| Working Capital | CZK mil | 107 | -508 | -179 | -505 | 202 | ||||
| Capital Employed | CZK mil | 12,531 | 12,537 | 14,024 | 14,615 | 11,749 | ||||
| Net Debt/Equity | -0.020 | 0.250 | 0.851 | 1.17 | 0.451 | |||||
| Cost of Financing | % | ... | 76.2 | 26.0 | 8.00 | 4.61 | -0.785 |
| cash flow | Unit | 2007 | 2008 | 2009 | 2010 | 2011 | 2012 | 2013 | 2014 | 2015 |
| cash flow | ||||||||||
| Net Profit | CZK mil | ... | -428 | -427 | -38.0 | -788 | 430 | |||
| Depreciation | CZK mil | ... | 1,076 | 1,111 | 1,886 | 1,886 | 992 | |||
| Non-Cash Items | CZK mil | ... | 421 | 34.7 | 302 | 638 | 595 | |||
| Change in Working Capital | CZK mil | ... | -511 | 615 | -329 | 327 | -708 | |||
| Total Cash From Operations | CZK mil | ... | 559 | 1,333 | 1,821 | 2,063 | 1,309 | |||
| Capital Expenditures | CZK mil | ... | -2,099 | -2,251 | -1,467 | -2,970 | -1,859 | |||
| Other Investments | CZK mil | ... | 1,257 | 291 | -47.6 | -70.7 | 1,213 | |||
| Total Cash From Investing | CZK mil | ... | -842 | -1,960 | -1,514 | -3,040 | -647 | |||
| Issuance Of Debt | CZK mil | ... | -972 | 2,193 | 3,098 | 1,072 | -3,050 | |||
| Total Cash From Financing | CZK mil | ... | 235 | 668 | -407 | 1,051 | -380 | |||
| Net Change In Cash | CZK mil | ... | -48.3 | 40.8 | -101 | 73.5 | 283 | |||
| ratios | ||||||||||
| Days Sales Outstanding | days | ... | 70.2 | 48.9 | 48.1 | 47.5 | 47.2 | |||
| Days Sales Of Inventory | days | ... | 6.72 | 5.11 | 4.24 | 3.98 | 7.35 | |||
| Days Payable Outstanding | days | ... | 123 | 109 | 101 | 109 | 79.8 | |||
| Cash Conversion Cycle | days | ... | -46.2 | -54.8 | -48.6 | -57.2 | -25.2 | |||
| Cash Earnings | CZK mil | ... | 649 | 684 | 1,848 | 1,098 | 1,422 | |||
| Free Cash Flow | CZK mil | ... | -284 | -627 | 307 | -977 | 663 |
| other data | Unit | 2007 | 2008 | 2009 | 2010 | 2011 | 2012 | 2013 | 2014 | 2015 |
| other data | ||||||||||
| ROA | % | ... | -2.70 | -2.73 | -0.234 | -4.60 | 2.67 | |||
| Gross Margin | % | ... | 42.2 | 40.3 | 45.6 | 42.2 | 42.9 | |||
| Employees | ... | 10,378 | 9,573 | 9,207 | 8,910 | 7,998 | ||||
| Cost Per Employee | USD per month | ... | 2,088 | 2,144 | 2,280 | 2,111 | 2,240 | |||
| Cost Per Employee (Local Currency) | CZK per month | ... | 39,797 | 40,971 | 40,332 | 41,287 | 43,826 | |||
| Staff Cost (As % Of Total Cost) | % | ... | 37.2 | 32.8 | 32.1 | 30.5 | 34.6 | |||
| Effective Tax Rate | % | ... | 13.0 | 2.16 | 167 | -33.2 | 28.5 | |||
| Capital Expenditures (As % of Sales) | % | ... | 15.8 | 15.8 | 10.3 | 21.0 | 14.6 | |||
| Revenues From Abroad | CZK mil | ... | 6,479 | 6,903 | 7,151 | 8,209 | 7,577 | |||
| Revenues From Abroad (As % Of Total) | % | ... | 48.6 | 48.6 | 50.2 | 57.9 | 59.6 |
Get all company financials in excel:
ČD Cargo is a state-owned Czech railway operator involved in freight transport. ČD Cargo has been established in 2007 as a spun off from České Dráhy (Czech Railways) with net assets worth more than CZK 9 bil being transferred into the new company. The Company offers transportation of a wide range of goods, from raw materials to products with high added value, as well as the transportation of containers, non-standard consignments, the leasing of railway wagons, shuttle transport, and other transport services, both domestically and internationally. With an annual volume of around 86 million tonnes of transported freight, ČD Cargo is one of the five largest railway transporters amongst the member state of the EU. ČD Cargo has more than 900 locomotives and 26,000 wagons of various kinds at its disposal
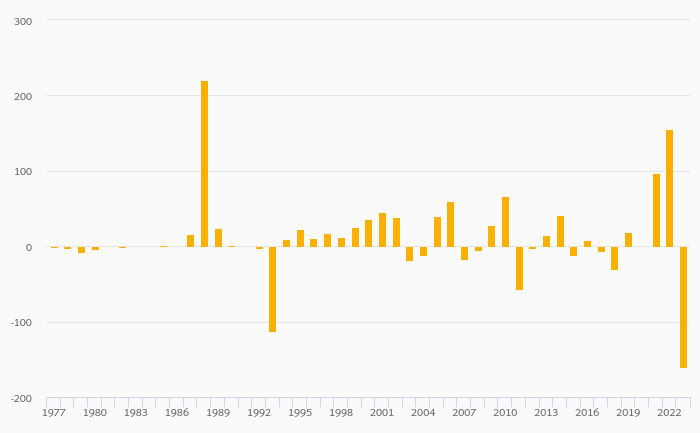
CD Cargo has been growing its sales by a year on average in the last 5 years. EBITDA has grown on average by 6.58% a year during that time to total of CZK 1,356 mil in 2015, or 11.3% of sales. That’s compared to 13.0% average margin seen in last five years.
The company netted CZK 140 mil in 2015 implying ROE of 1.96% and ROCE of 1.27%. Again, the average figures were 0.564% and 0.690%, respectively when looking at the previous 5 years.
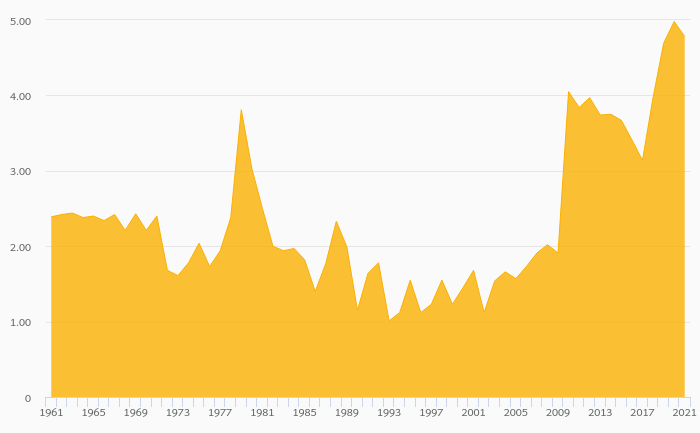
CD Cargo’s net debt amounted to CZK 1,294 mil at the end of 2015, or 0.179 of equity. When compared to EBITDA, net debt was 0.954x, down when compared to average of 1.98x seen in the last 5 years.
 Helgi Library