By Helgi Library - June 9, 2018
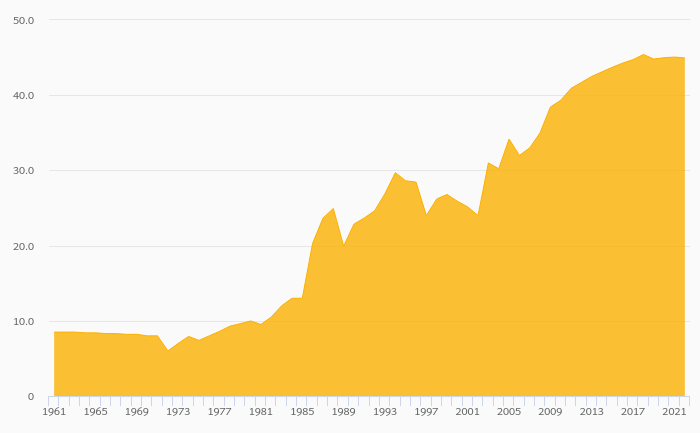
Erste Bank Core Austria's non-performing loans reached 1.99% of total loans at the end of 2017, down from 2.52% compared to the p...
By Helgi Library - June 9, 2018
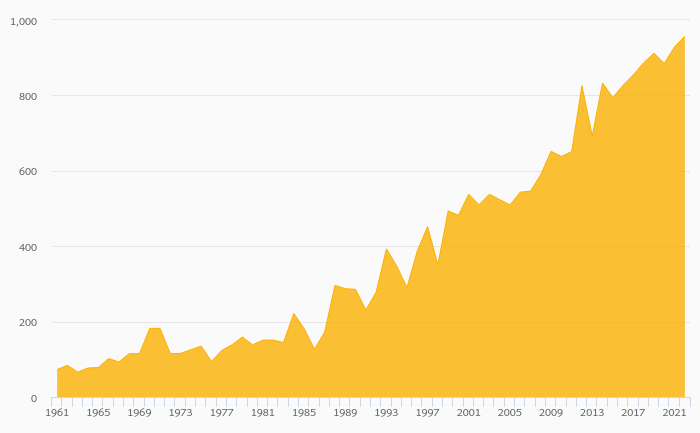
Erste Bank Core Austria made a net profit of EUR 253 mil in 2017, up 10.9% compared to the previous year. This implies a return ...
By Helgi Library - September 23, 2018
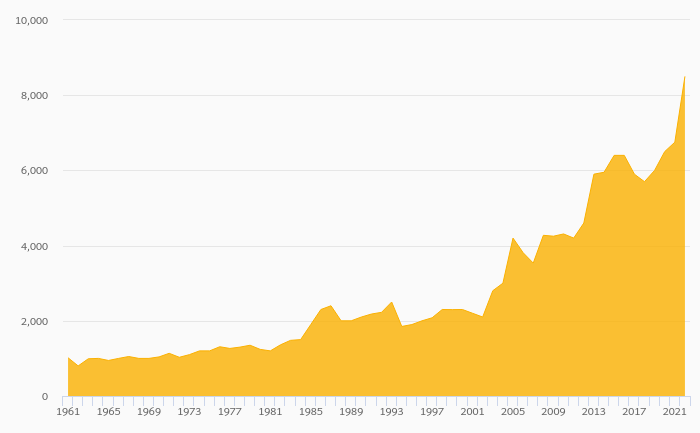
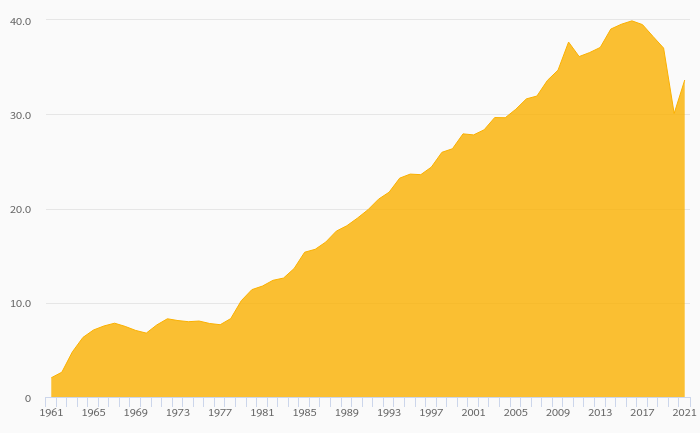
Erste Bank Core Austria's customer loans reached EUR 31,427 mil in 2017, up 2.76% compared to the previous year. Austrian banki...
| Profit Statement | 2015 | 2016 | 2017 | |
| Net Interest Income | EUR mil | 640 | 660 | 631 |
| Net Fee Income | EUR mil | 371 | 335 | 354 |
| Other Income | EUR mil | 29.7 | 62.4 | 68.7 |
| Total Revenues | EUR mil | 1,040 | 1,057 | 1,054 |
| Operating Profit | EUR mil | 400 | 391 | 374 |
| Provisions | EUR mil | 59.0 | 29.3 | -26.1 |
| Net Profit | EUR mil | 231 | 228 | 253 |
| Balance Sheet | 2015 | 2016 | 2017 | |
| Customer Loans | EUR mil | 29,543 | 30,583 | 31,427 |
| Total Assets | EUR mil | 40,560 | 41,484 | 43,141 |
| Shareholders' Equity | EUR mil | 1,259 | 1,326 | 1,356 |
| Customer Deposits | EUR mil | 34,022 | 35,889 | 38,250 |
| Ratios | 2015 | 2016 | 2017 | |
| ROE | % | 19.8 | 17.7 | 18.9 |
| ROA | % | 0.552 | 0.557 | 0.598 |
| Costs (As % Of Assets) | % | 1.53 | 1.63 | 1.61 |
| Costs (As % Of Income) | % | 61.6 | 63.1 | 64.5 |
| Net Interest Margin | % | 1.53 | 1.61 | 1.49 |
| Loans (As % Of Deposits) | % | 86.8 | 85.2 | 82.2 |
| NPLs (As % Of Loans) | % | 2.86 | 2.52 | 1.99 |
| Provisions (As % Of NPLs) | % | 62.6 | 59.3 | 57.1 |
| Growth Rates | 2015 | 2016 | 2017 | |
| Total Revenue Growth | % | 1.93 | 1.68 | -0.357 |
| Operating Cost Growth | % | 1.52 | 4.16 | 1.91 |
| Operating Profit Growth | % | 2.60 | -2.28 | -4.23 |
| Net Profit Growth | % | 7.73 | -1.19 | 10.9 |
| Customer Loan Growth | % | 1.87 | 3.52 | 2.76 |
| Total Asset Growth | % | -5.91 | 2.28 | 3.99 |
| Customer Deposit Growth | % | 1.06 | 5.49 | 6.58 |
| Shareholders' Equity Growth | % | 17.0 | 5.30 | 2.26 |
Get all company financials in excel:
| summary | Unit | 2007 | 2008 | 2009 | 2010 | 2011 | 2012 | 2013 | 2014 | 2015 | 2016 | 2017 |
| income statement | ||||||||||||
| Net Interest Income | EUR mil | 666 | 618 | 560 | 613 | 640 | ||||||
| Total Revenues | EUR mil | 1,007 | 953 | 943 | 1,020 | 1,040 | ||||||
| Operating Profit | EUR mil | 397 | 338 | 336 | 390 | 400 | ||||||
| Net Profit | EUR mil | 178 | 192 | 160 | 215 | 231 | ||||||
| balance sheet | ||||||||||||
| Customer Loans | EUR mil | 28,199 | 28,052 | 28,500 | 29,000 | 29,543 | ||||||
| Total Assets | EUR mil | 42,726 | 42,503 | 42,162 | 43,106 | 40,560 | ||||||
| Shareholders' Equity | EUR mil | 1,088 | 1,284 | 1,068 | 1,076 | 1,259 | ||||||
| Customer Deposits | EUR mil | 28,774 | 29,960 | 33,974 | 33,667 | 34,022 | ||||||
| ratios | ||||||||||||
| ROE | % | 15.9 | 16.2 | 13.6 | 20.0 | 19.8 | ||||||
| ROA | % | 0.421 | 0.451 | 0.379 | 0.503 | 0.552 | ||||||
| Costs (As % Of Assets) | % | 1.45 | 1.44 | 1.43 | 1.48 | 1.53 | ||||||
| Costs (As % Of Income) | % | 60.5 | 64.5 | 64.3 | 61.8 | 61.6 | ||||||
| Net Interest Margin | % | 1.58 | 1.45 | 1.32 | 1.44 | 1.53 | ||||||
| Interest Income (As % Of Revenues) | % | 66.1 | 64.9 | 59.3 | 60.1 | 61.5 | ||||||
| Fee Income (As % Of Revenues) | % | 31.8 | 35.6 | 35.2 | 34.8 | 35.6 | ||||||
| Equity (As % Of Assets) | % | 2.55 | 3.02 | 2.53 | 2.50 | 3.11 | ||||||
| Loans (As % Of Deposits) | % | 98.0 | 93.6 | 83.9 | 86.1 | 86.8 | ||||||
| Loans (As % Assets) | % | 66.0 | 66.0 | 67.6 | 67.3 | 72.8 | ||||||
| NPLs (As % Of Loans) | % | ... | ... | 3.73 | 3.77 | 3.82 | 3.49 | 2.86 | ||||
| Provisions (As % Of NPLs) | % | ... | ... | 65.4 | 65.7 | 63.7 | 68.9 | 62.6 | ||||
| valuation | ||||||||||||
| Book Value Per Share Growth | % | ... | 3.35 | -7.22 | -9.41 | 9.62 | 4.25 |
| income statement | Unit | 2007 | 2008 | 2009 | 2010 | 2011 | 2012 | 2013 | 2014 | 2015 | 2016 | 2017 |
| income statement | ||||||||||||
| Net Interest Income | EUR mil | 666 | 618 | 560 | 613 | 640 | ||||||
| Net Fee Income | EUR mil | 321 | 339 | 332 | 355 | 371 | ||||||
| Other Income | EUR mil | 20.2 | -4.20 | 51.4 | 51.9 | 29.7 | ||||||
| Total Revenues | EUR mil | 1,007 | 953 | 943 | 1,020 | 1,040 | ||||||
| Operating Cost | EUR mil | 609 | 615 | 607 | 631 | 640 | ||||||
| Operating Profit | EUR mil | 397 | 338 | 336 | 390 | 400 | ||||||
| Provisions | EUR mil | 101 | 96.2 | 77.5 | 104 | 59.0 | ||||||
| Extra and Other Cost | EUR mil | 63.7 | -13.4 | 34.4 | -6.25 | 25.6 | ||||||
| Pre-Tax Profit | EUR mil | 232 | 255 | 224 | 291 | 315 | ||||||
| Tax | EUR mil | 50.3 | 55.8 | 59.1 | 65.1 | 73.8 | ||||||
| Minorities | EUR mil | 4.30 | 6.90 | 4.83 | 11.8 | 10.1 | ||||||
| Net Profit | EUR mil | 178 | 192 | 160 | 215 | 231 | ||||||
| growth rates | ||||||||||||
| Net Interest Income Growth | % | ... | 3.35 | -7.22 | -9.41 | 9.62 | 4.25 | |||||
| Net Fee Income Growth | % | ... | -7.12 | 5.74 | -2.01 | 6.82 | 4.48 | |||||
| Total Revenue Growth | % | ... | 0.567 | -5.37 | -0.987 | 8.17 | 1.93 | |||||
| Operating Cost Growth | % | ... | 0.435 | 0.870 | -1.26 | 3.91 | 1.52 | |||||
| Operating Profit Growth | % | ... | 0.770 | -15.0 | -0.486 | 15.9 | 2.60 | |||||
| Pre-Tax Profit Growth | % | ... | 5.44 | 9.86 | -12.0 | 29.9 | 8.14 | |||||
| Net Profit Growth | % | ... | 6.40 | 8.33 | -16.6 | 33.7 | 7.73 | |||||
| market share | ||||||||||||
| Market Share in Revenues | % | 5.23 | 4.98 | 4.98 | 5.12 | 5.00 | ||||||
| Market Share in Net Profit | % | 14.9 | 5.99 | -17.2 | -3.21 | 6.21 |
| balance sheet | Unit | 2007 | 2008 | 2009 | 2010 | 2011 | 2012 | 2013 | 2014 | 2015 | 2016 | 2017 |
| balance sheet | ||||||||||||
| Customer Loans | EUR mil | 28,199 | 28,052 | 28,500 | 29,000 | 29,543 | ||||||
| Total Assets | EUR mil | 42,726 | 42,503 | 42,162 | 43,106 | 40,560 | ||||||
| Shareholders' Equity | EUR mil | 1,088 | 1,284 | 1,068 | 1,076 | 1,259 | ||||||
| Liabilities | EUR mil | 41,638 | 41,218 | 41,094 | 42,030 | 39,301 | ||||||
| Customer Deposits | EUR mil | 28,774 | 29,960 | 33,974 | 33,667 | 34,022 | ||||||
| asset quality | ||||||||||||
| Non-Performing Loans | EUR mil | ... | ... | 1,051 | 1,058 | 1,070 | 1,012 | 861 | ||||
| Gross Loans | EUR mil | ... | ... | 28,199 | 28,052 | 28,049 | 28,963 | 30,082 | ||||
| Total Provisions | EUR mil | ... | ... | 688 | 696 | 682 | 697 | 539 | ||||
| growth rates | ||||||||||||
| Customer Loan Growth | % | ... | 2.78 | -0.523 | 1.60 | 1.75 | 1.87 | |||||
| Total Asset Growth | % | ... | 2.78 | -0.523 | -0.802 | 2.24 | -5.91 | |||||
| Shareholders' Equity Growth | % | ... | -4.79 | 18.0 | -16.8 | 0.739 | 17.0 | |||||
| Customer Deposit Growth | % | ... | 3.52 | 4.12 | 13.4 | -0.904 | 1.06 | |||||
| market share | ||||||||||||
| Market Share in Customer Loans | % | 6.32 | 6.36 | 6.58 | 6.81 | 6.87 | ||||||
| Market Share in Total Assets | % | 4.21 | 4.33 | 4.55 | 4.81 | 4.72 | ||||||
| Market Share in Customer Deposits | % | 8.26 | 8.46 | 9.37 | 9.00 | 8.83 |
| ratios | Unit | 2007 | 2008 | 2009 | 2010 | 2011 | 2012 | 2013 | 2014 | 2015 | 2016 | 2017 |
| ratios | ||||||||||||
| ROE | % | 15.9 | 16.2 | 13.6 | 20.0 | 19.8 | ||||||
| ROA | % | 0.421 | 0.451 | 0.379 | 0.503 | 0.552 | ||||||
| Costs (As % Of Assets) | % | 1.45 | 1.44 | 1.43 | 1.48 | 1.53 | ||||||
| Costs (As % Of Income) | % | 60.5 | 64.5 | 64.3 | 61.8 | 61.6 | ||||||
| Net Interest Margin | % | 1.58 | 1.45 | 1.32 | 1.44 | 1.53 | ||||||
| Asset Yield | % | ... | 1.58 | 1.45 | 1.32 | 1.44 | 1.53 | |||||
| Interest Income (As % Of Revenues) | % | 66.1 | 64.9 | 59.3 | 60.1 | 61.5 | ||||||
| Fee Income (As % Of Revenues) | % | 31.8 | 35.6 | 35.2 | 34.8 | 35.6 | ||||||
| Other Income (As % Of Revenues) | % | 2.01 | -0.441 | 5.45 | 5.09 | 2.86 | ||||||
| Equity (As % Of Assets) | % | 2.55 | 3.02 | 2.53 | 2.50 | 3.11 | ||||||
| Loans (As % Of Deposits) | % | 98.0 | 93.6 | 83.9 | 86.1 | 86.8 | ||||||
| Loans (As % Assets) | % | 66.0 | 66.0 | 67.6 | 67.3 | 72.8 | ||||||
| NPLs (As % Of Loans) | % | ... | ... | 3.73 | 3.77 | 3.82 | 3.49 | 2.86 | ||||
| Provisions (As % Of NPLs) | % | ... | ... | 65.4 | 65.7 | 63.7 | 68.9 | 62.6 | ||||
| Provisions (As % Of Loans) | % | ... | ... | 2.44 | 2.48 | 2.39 | 2.40 | 1.82 | ||||
| Cost of Provisions (As % Of Loans) | % | 0.365 | 0.342 | 0.274 | 0.363 | 0.202 |
| other data | Unit | 2007 | 2008 | 2009 | 2010 | 2011 | 2012 | 2013 | 2014 | 2015 | 2016 | 2017 |
| other data | ||||||||||||
| Risk-Weighted Assets | EUR mil | 13,708 | 13,045 | 11,342 | 12,589 | 12,483 |
Get all company financials in excel:

By Helgi Library - September 23, 2018
Erste Bank Core Austria's customer deposits reached EUR 38,250 mil in 2017, up 6.58% compared to the previous year. Austrian banking sector accepted customer deposits of EUR 405 bil in 2017, up 2.53% when compared to the last year. Erste Bank Core Austria...
By Helgi Library - September 23, 2018
Erste Bank Core Austria generated total banking revenues of EUR 1,054 mil in 2017, down 0.357% compared to the previous year. Austrian banking sector banking sector generated total revenues of EUR 19,521 mil in 2017, up 2.83% when compared to the last...
By Helgi Library - June 9, 2018
Erste Bank Core Austria generated total banking revenues of EUR 1,054 mil in 2017, down 0.357% compared to the previous year. Historically, the bank’s revenues containing of interest, fee and other non-interest income reached an all time high of EUR 1,057 mil i...
By Helgi Library - June 9, 2018
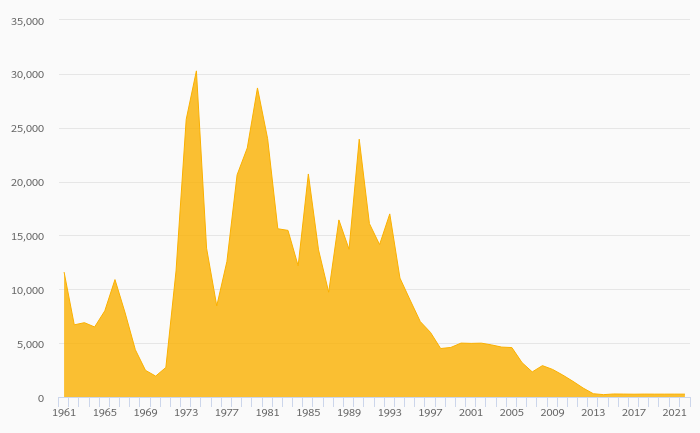
Erste Bank Core Austria's customer loan growth reached 2.76% in 2017, down from 3.52% compared to the previous year. Historically, the bank’s loans growth reached an all time high of 12.7% in 2009 and an all time low of -0.523% in 2012. In the last decade...

Erste Bank Core Austria has been growing its revenues and asset by 2.04% and 0.298% a year on average in the last 5 years. Its loans and deposits have grown by 2.30% and 5.01% a year during that time and loans to deposits ratio reached 82.2% at the end of 2017. The company achieved an average return on equity of 18.0% in the last five years with net profit growing 5.65% a year on average. In terms of operating efficiency, its cost to income ratio reached 64.5% in 2017, compared to 63.1% average in the last five years.
Equity represented 3.14% of total assets or 4.32% of loans at the end of 2017. Erste Bank Core Austria's non-performing loans were 1.99% of total loans while provisions covered some 57.1% of NPLs at the end of 2017.
 Helgi Library