By Helgi Library - September 28, 2018
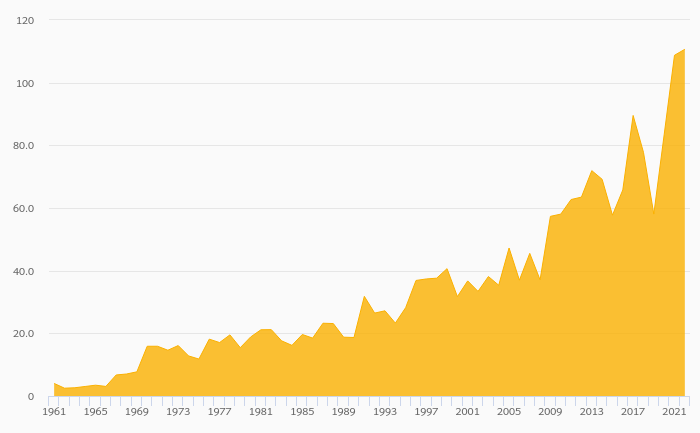
Raiffeisenverband Salzburg's customer deposits reached EUR 2,866 mil in 2017, up 7.01% compared to the previous year. Austrian ...
By Helgi Library - September 28, 2018
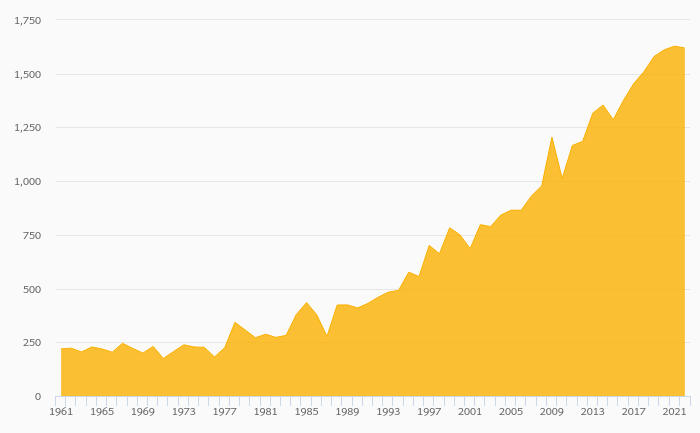
Raiffeisenverband Salzburg's customer loans reached EUR 3,283 mil in 2017, up 2.83% compared to the previous year. Austrian ban...
By Helgi Library - June 12, 2018
Raiffeisenverband Salzburg made a net profit of EUR 23.5 mil in 2017, up 58.4% compared to the previous year. This implies a ret...
| Profit Statement | 2015 | 2016 | 2017 | |
| Net Interest Income | EUR mil | 55.7 | 58.0 | 53.9 |
| Net Fee Income | EUR mil | 35.4 | 35.2 | 35.9 |
| Other Income | EUR mil | 89.1 | 92.1 | 99.8 |
| Total Revenues | EUR mil | 180 | 185 | 189 |
| Staff Cost | EUR mil | 95.6 | 96.4 | 96.8 |
| Operating Profit | EUR mil | 37.1 | 42.6 | 44.2 |
| Provisions | EUR mil | 18.0 | 15.7 | 17.5 |
| Net Profit | EUR mil | 9.59 | 14.8 | 23.5 |
| Balance Sheet | 2015 | 2016 | 2017 | |
| Interbank Loans | EUR mil | 1,679 | 2,184 | 2,381 |
| Customer Loans | EUR mil | 3,023 | 3,193 | 3,283 |
| Total Assets | EUR mil | 6,286 | 7,016 | 7,410 |
| Shareholders' Equity | EUR mil | 528 | 542 | 580 |
| Interbank Borrowing | EUR mil | 2,260 | 2,630 | 2,552 |
| Customer Deposits | EUR mil | 2,331 | 2,679 | 2,866 |
| Issued Debt Securities | EUR mil | 1,024 | 998 | 1,257 |
| Ratios | 2015 | 2016 | 2017 | |
| ROE | % | 1.83 | 2.77 | 4.19 |
| ROA | % | 0.154 | 0.223 | 0.326 |
| Costs (As % Of Assets) | % | 2.29 | 2.14 | 2.02 |
| Costs (As % Of Income) | % | 79.4 | 77.0 | 76.7 |
| Capital Adequacy Ratio | % | 14.7 | 14.2 | 14.7 |
| Net Interest Margin | % | 0.893 | 0.872 | 0.747 |
| Loans (As % Of Deposits) | % | 130 | 119 | 115 |
| Growth Rates | 2015 | 2016 | 2017 | |
| Total Revenue Growth | % | -7.32 | 2.81 | 2.30 |
| Operating Cost Growth | % | -0.442 | -0.315 | 1.92 |
| Operating Profit Growth | % | -26.8 | 14.9 | 3.56 |
| Net Profit Growth | % | 40.8 | 54.7 | 58.4 |
| Customer Loan Growth | % | 4.26 | 5.61 | 2.83 |
| Total Asset Growth | % | 1.54 | 11.6 | 5.62 |
| Customer Deposit Growth | % | 8.46 | 14.9 | 7.01 |
| Shareholders' Equity Growth | % | 2.11 | 2.55 | 7.05 |
| Employees | 1,651 | 1,622 | 1,658 | |
Get all company financials in excel:
| summary | Unit | 2008 | 2009 | 2010 | 2011 | 2012 | 2013 | 2014 | 2015 | 2016 | 2017 |
| income statement | |||||||||||
| Net Interest Income | EUR mil | 58.8 | 57.9 | 58.8 | 55.5 | 55.7 | |||||
| Total Revenues | EUR mil | 196 | 208 | 209 | 194 | 180 | |||||
| Operating Profit | EUR mil | 54.0 | 53.4 | 57.6 | 50.7 | 37.1 | |||||
| Net Profit | EUR mil | 24.4 | 24.4 | 34.1 | 6.81 | 9.59 | |||||
| balance sheet | |||||||||||
| Interbank Loans | EUR mil | 2,096 | 1,987 | 1,705 | 1,613 | 1,679 | |||||
| Customer Loans | EUR mil | 3,285 | 3,259 | 3,238 | 2,900 | 3,023 | |||||
| Debt Securities | EUR mil | 1,870 | 1,641 | 1,093 | 972 | 868 | |||||
| Total Assets | EUR mil | 7,976 | 7,608 | 6,715 | 6,191 | 6,286 | |||||
| Shareholders' Equity | EUR mil | 473 | 422 | 453 | 517 | 528 | |||||
| Interbank Borrowing | EUR mil | 3,236 | 3,206 | 2,423 | 2,291 | 2,260 | |||||
| Customer Deposits | EUR mil | 3,103 | 2,782 | 2,482 | 2,149 | 2,331 | |||||
| Issued Debt Securities | EUR mil | 1,023 | 980 | 1,142 | 1,071 | 1,024 | |||||
| ratios | |||||||||||
| ROE | % | 5.75 | 5.44 | 7.79 | 1.40 | 1.83 | |||||
| ROA | % | 0.306 | 0.313 | 0.476 | 0.106 | 0.154 | |||||
| Costs (As % Of Assets) | % | 1.77 | 1.99 | 2.12 | 2.23 | 2.29 | |||||
| Costs (As % Of Income) | % | 72.4 | 74.4 | 72.5 | 73.9 | 79.4 | |||||
| Capital Adequacy Ratio | % | ... | ... | 12.8 | 13.7 | 15.0 | 15.4 | 14.7 | |||
| Net Interest Margin | % | 0.735 | 0.743 | 0.821 | 0.861 | 0.893 | |||||
| Interest Income (As % Of Revenues) | % | 30.0 | 27.8 | 28.1 | 28.6 | 30.9 | |||||
| Fee Income (As % Of Revenues) | % | 21.3 | 20.0 | 18.9 | 18.1 | 19.7 | |||||
| Staff Cost (As % Of Total Cost) | % | 64.4 | 66.2 | 65.7 | 67.5 | 66.9 | |||||
| Equity (As % Of Assets) | % | 5.93 | 5.55 | 6.75 | 8.36 | 8.40 | |||||
| Loans (As % Of Deposits) | % | 106 | 117 | 130 | 135 | 130 | |||||
| Loans (As % Assets) | % | 41.2 | 42.8 | 48.2 | 46.8 | 48.1 | |||||
| valuation | |||||||||||
| Book Value Per Share Growth | % | ... | 7.29 | -1.47 | 1.55 | -5.57 | 0.297 |
| income statement | Unit | 2008 | 2009 | 2010 | 2011 | 2012 | 2013 | 2014 | 2015 | 2016 | 2017 |
| income statement | |||||||||||
| Interest Income | EUR mil | 167 | 152 | 125 | 111 | 99.5 | |||||
| Interest Cost | EUR mil | 108 | 94.6 | 65.9 | 55.6 | 43.8 | |||||
| Net Interest Income | EUR mil | 58.8 | 57.9 | 58.8 | 55.5 | 55.7 | |||||
| Net Fee Income | EUR mil | 41.8 | 41.8 | 39.6 | 35.1 | 35.4 | |||||
| Other Income | EUR mil | 95.2 | 109 | 111 | 104 | 89.1 | |||||
| Total Revenues | EUR mil | 196 | 208 | 209 | 194 | 180 | |||||
| Staff Cost | EUR mil | 91.3 | 103 | 99.6 | 96.9 | 95.6 | |||||
| Depreciation | EUR mil | 10.0 | 10.7 | 10.8 | 11.0 | 11.1 | |||||
| Other Cost | EUR mil | 40.5 | 41.7 | 41.3 | 35.8 | 36.3 | |||||
| Operating Cost | EUR mil | 142 | 155 | 152 | 144 | 143 | |||||
| Operating Profit | EUR mil | 54.0 | 53.4 | 57.6 | 50.7 | 37.1 | |||||
| Provisions | EUR mil | 24.6 | 24.1 | 17.5 | 38.5 | 18.0 | |||||
| Extra and Other Cost | EUR mil | 0 | -0.505 | 0.001 | -0.001 | -0.011 | |||||
| Pre-Tax Profit | EUR mil | 29.4 | 29.9 | 40.1 | 12.2 | 19.2 | |||||
| Tax | EUR mil | 4.91 | 5.50 | 6.01 | 5.41 | 9.57 | |||||
| Minorities | EUR mil | 0 | 0 | 0 | 0 | 0 | |||||
| Net Profit | EUR mil | 24.4 | 24.4 | 34.1 | 6.81 | 9.59 | |||||
| growth rates | |||||||||||
| Net Interest Income Growth | % | ... | 7.29 | -1.47 | 1.55 | -5.57 | 0.297 | ||||
| Net Fee Income Growth | % | ... | -4.56 | 0.012 | -5.25 | -11.3 | 0.900 | ||||
| Total Revenue Growth | % | ... | 1.91 | 6.49 | 0.401 | -7.10 | -7.32 | ||||
| Operating Cost Growth | % | ... | 2.80 | 9.33 | -2.15 | -5.26 | -0.442 | ||||
| Operating Profit Growth | % | ... | -0.375 | -0.988 | 7.82 | -11.9 | -26.8 | ||||
| Pre-Tax Profit Growth | % | ... | 32.3 | 1.76 | 34.3 | -69.5 | 56.8 | ||||
| Net Profit Growth | % | ... | 18.7 | -0.299 | 39.9 | -80.0 | 40.8 | ||||
| market share | |||||||||||
| Market Share in Revenues | % | 1.02 | 1.09 | 1.10 | 0.975 | 0.866 | |||||
| Market Share in Net Profit | % | 2.05 | 0.758 | -3.65 | -0.102 | 0.258 | |||||
| Market Share in Employees | % | 2.23 | 2.29 | 2.32 | 2.27 | 2.25 |
| balance sheet | Unit | 2008 | 2009 | 2010 | 2011 | 2012 | 2013 | 2014 | 2015 | 2016 | 2017 |
| balance sheet | |||||||||||
| Cash | EUR mil | 18.7 | 21.3 | 22.6 | 17.8 | 47.7 | |||||
| Interbank Loans | EUR mil | 2,096 | 1,987 | 1,705 | 1,613 | 1,679 | |||||
| Customer Loans | EUR mil | 3,285 | 3,259 | 3,238 | 2,900 | 3,023 | |||||
| Debt Securities | EUR mil | 1,870 | 1,641 | 1,093 | 972 | 868 | |||||
| Fixed Assets | EUR mil | 172 | 175 | 174 | 198 | 204 | |||||
| Total Assets | EUR mil | 7,976 | 7,608 | 6,715 | 6,191 | 6,286 | |||||
| Shareholders' Equity | EUR mil | 473 | 422 | 453 | 517 | 528 | |||||
| Of Which Minority Interest | EUR mil | 0 | 0 | 0 | 0.073 | 0.073 | |||||
| Liabilities | EUR mil | 7,503 | 7,185 | 6,262 | 5,674 | 5,758 | |||||
| Interbank Borrowing | EUR mil | 3,236 | 3,206 | 2,423 | 2,291 | 2,260 | |||||
| Customer Deposits | EUR mil | 3,103 | 2,782 | 2,482 | 2,149 | 2,331 | |||||
| Issued Debt Securities | EUR mil | 1,023 | 980 | 1,142 | 1,071 | 1,024 | |||||
| Other Liabilities | EUR mil | 141 | 218 | 214 | 163 | 142 | |||||
| growth rates | |||||||||||
| Customer Loan Growth | % | ... | 5.70 | -0.765 | -0.649 | -10.5 | 4.26 | ||||
| Total Asset Growth | % | ... | -0.592 | -4.62 | -11.7 | -7.80 | 1.54 | ||||
| Shareholders' Equity Growth | % | ... | 25.2 | -10.7 | 7.24 | 14.2 | 2.11 | ||||
| Customer Deposit Growth | % | ... | 25.7 | -10.3 | -10.8 | -13.4 | 8.46 | ||||
| market share | |||||||||||
| Market Share in Customer Loans | % | 0.736 | 0.739 | 0.747 | 0.681 | 0.703 | |||||
| Market Share in Total Assets | % | 0.786 | 0.775 | 0.724 | 0.691 | 0.732 | |||||
| Market Share in Customer Deposits | % | 0.891 | 0.786 | 0.684 | 0.575 | 0.605 |
| ratios | Unit | 2008 | 2009 | 2010 | 2011 | 2012 | 2013 | 2014 | 2015 | 2016 | 2017 |
| ratios | |||||||||||
| ROE | % | 5.75 | 5.44 | 7.79 | 1.40 | 1.83 | |||||
| ROA | % | 0.306 | 0.313 | 0.476 | 0.106 | 0.154 | |||||
| Costs (As % Of Assets) | % | 1.77 | 1.99 | 2.12 | 2.23 | 2.29 | |||||
| Costs (As % Of Income) | % | 72.4 | 74.4 | 72.5 | 73.9 | 79.4 | |||||
| Capital Adequacy Ratio | % | ... | ... | 12.8 | 13.7 | 15.0 | 15.4 | 14.7 | |||
| Tier 1 Ratio | % | ... | ... | 8.60 | 9.30 | 10.2 | 11.4 | 11.4 | |||
| Net Interest Margin | % | 0.735 | 0.743 | 0.821 | 0.861 | 0.893 | |||||
| Interest Spread | % | ... | 0.659 | 0.669 | 0.761 | 0.791 | 0.829 | ||||
| Asset Yield | % | 2.08 | 1.96 | 1.74 | 1.72 | 1.60 | |||||
| Cost Of Liabilities | % | ... | 1.42 | 1.29 | 0.980 | 0.932 | 0.767 | ||||
| Interest Income (As % Of Revenues) | % | 30.0 | 27.8 | 28.1 | 28.6 | 30.9 | |||||
| Fee Income (As % Of Revenues) | % | 21.3 | 20.0 | 18.9 | 18.1 | 19.7 | |||||
| Other Income (As % Of Revenues) | % | 48.6 | 52.2 | 53.0 | 53.4 | 49.4 | |||||
| Cost Per Employee | USD per month | 6,063 | 6,185 | 6,245 | 6,183 | 5,533 | |||||
| Cost Per Employee (Local Currency) | EUR per month | 4,360 | 4,817 | 4,704 | 4,797 | 4,827 | |||||
| Staff Cost (As % Of Total Cost) | % | 64.4 | 66.2 | 65.7 | 67.5 | 66.9 | |||||
| Equity (As % Of Assets) | % | 5.93 | 5.55 | 6.75 | 8.36 | 8.40 | |||||
| Loans (As % Of Deposits) | % | 106 | 117 | 130 | 135 | 130 | |||||
| Loans (As % Assets) | % | 41.2 | 42.8 | 48.2 | 46.8 | 48.1 | |||||
| Cost of Provisions (As % Of Loans) | % | 0.770 | 0.735 | 0.538 | 1.25 | 0.620 |
| other data | Unit | 2008 | 2009 | 2010 | 2011 | 2012 | 2013 | 2014 | 2015 | 2016 | 2017 |
| other data | |||||||||||
| Employees | 1,744 | 1,774 | 1,764 | 1,684 | 1,651 |
Get all company financials in excel:

By Helgi Library - September 28, 2018
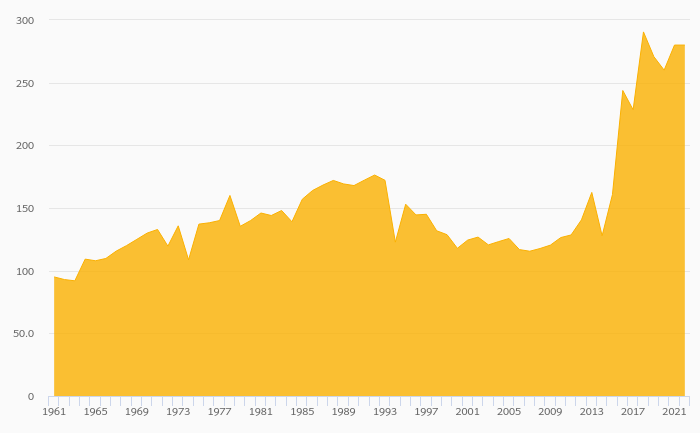
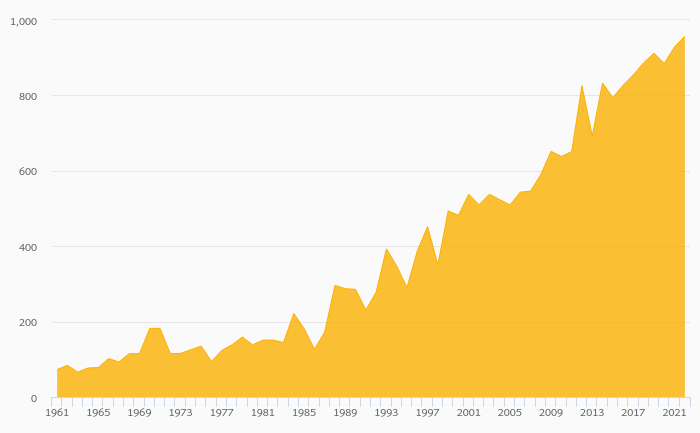
Raiffeisenverband Salzburg generated total banking revenues of EUR 189 mil in 2017, up 2.30% compared to the previous year. Austrian banking sector banking sector generated total revenues of EUR 19,521 mil in 2017, up 2.83% when compared to the last y...
By Helgi Library - June 12, 2018
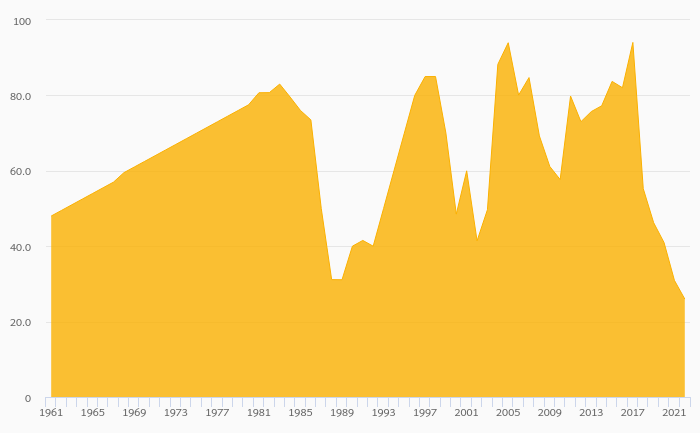
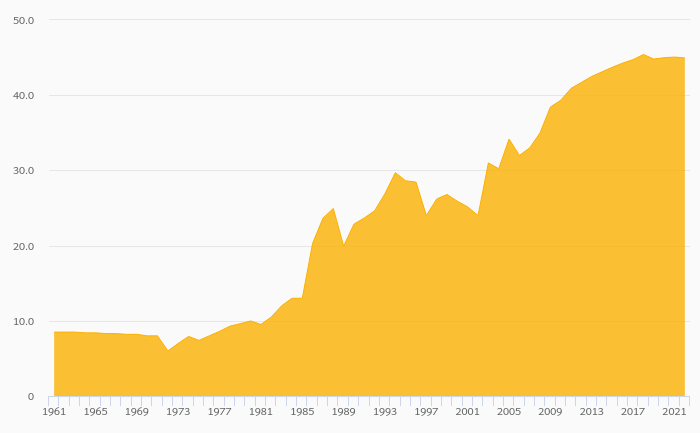
Raiffeisenverband Salzburg's net interest margin amounted to 0.747% in 2017, down from 0.872% compared to the previous year. Historically, the bank’s net interest margin reached an all time high of 0.893% in 2015 and an all time low of 0.690% in 2010. T...
By Helgi Library - June 12, 2018
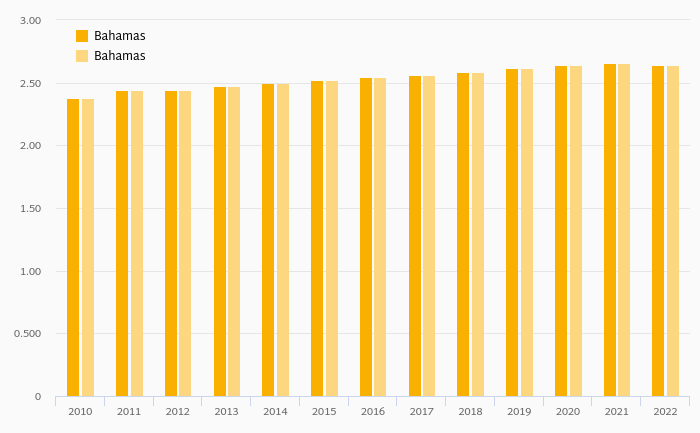
Raiffeisenverband Salzburg's capital adequacy ratio reached 14.7% at the end of 2017, up from 14.2% compared to the previous year. Historically, the bank’s capital ratio hit an all time high of 15.4% in 2014 and an all time low of 12.2% in 2010. The Tier 1 ra...
By Helgi Library - June 12, 2018
Raiffeisenverband Salzburg generated total banking revenues of EUR 189 mil in 2017, up 2.3% compared to the previous year. Historically, the bank’s revenues containing of interest, fee and other non-interest income reached an all time high of EUR 209 mil in 201...
By Helgi Library - June 12, 2018
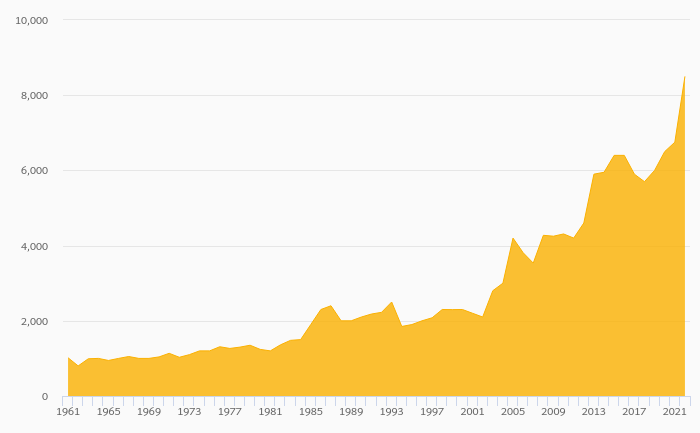
Raiffeisenverband Salzburg's customer loan growth reached 2.83% in 2017, down from 5.61% compared to the previous year. Historically, the bank’s loans growth reached an all time high of 7.80% in 2010 and an all time low of -10.5% in 2014. In the last deca...

Raiffeisenverband Salzburg has been growing its revenues and asset by -0.849% and 6.17% a year on average in the last 3 years. Its loans and deposits have grown by 4.23% and 10.1% a year during that time and loans to deposits ratio reached 115% at the end of 2017. The company achieved an average return on equity of 2.93% in the last three years with net profit growing 51.1% a year on average. In terms of operating efficiency, its cost to income ratio reached 76.7% in 2017, compared to 77.7% average in the last three years.
Equity represented 7.83% of total assets or 17.7% of loans at the end of 2017. Raiffeisenverband Salzburg's non-performing loans were of total loans while provisions covered some of NPLs at the end of 2017.
 Helgi Library