By Helgi Library - June 13, 2018
Sparkasse Oberosterreich made a net profit of EUR 60.3 mil in 2017, up 167% compared to the previous year. This implies a return...
By Helgi Library - September 30, 2018
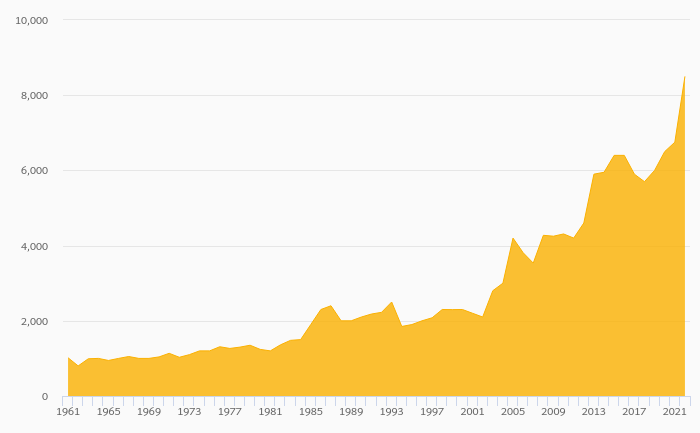
Sparkasse Oberosterreich's customer loans reached EUR 8,169 mil in 2017, up 2.08% compared to the previous year. Austrian banki...
By Helgi Library - September 30, 2018
Sparkasse Oberosterreich's customer deposits reached EUR 7,834 mil in 2017, up 0.305% compared to the previous year. Austrian b...
| Profit Statement | 2015 | 2016 | 2017 | |
| Net Interest Income | EUR mil | 187 | 185 | 185 |
| Net Fee Income | EUR mil | 96.0 | 96.3 | 105 |
| Other Income | EUR mil | 4.00 | 6.90 | 8.80 |
| Total Revenues | EUR mil | 287 | 289 | 299 |
| Staff Cost | EUR mil | 103 | 106 | 110 |
| Operating Profit | EUR mil | 119 | 108 | 107 |
| Provisions | EUR mil | 21.6 | 44.8 | 30.0 |
| Net Profit | EUR mil | 64.2 | 22.6 | 60.3 |
| Balance Sheet | 2015 | 2016 | 2017 | |
| Interbank Loans | EUR mil | 24.7 | 43.2 | 1,230 |
| Customer Loans | EUR mil | 7,765 | 8,002 | 8,169 |
| Total Assets | EUR mil | 12,131 | 12,133 | 12,013 |
| Shareholders' Equity | EUR mil | 859 | 863 | 926 |
| Interbank Borrowing | EUR mil | 1,742 | 1,266 | 1,251 |
| Customer Deposits | EUR mil | 7,313 | 7,810 | 7,834 |
| Issued Debt Securities | EUR mil | 1,689 | 1,650 | 1,632 |
| Ratios | 2015 | 2016 | 2017 | |
| ROE | % | 7.87 | 2.62 | 6.74 |
| ROA | % | 0.526 | 0.186 | 0.499 |
| Costs (As % Of Assets) | % | 1.37 | 1.49 | 1.59 |
| Costs (As % Of Income) | % | 58.4 | 62.7 | 64.3 |
| Capital Adequacy Ratio | % | 17.1 | 18.9 | 19.4 |
| Net Interest Margin | % | 1.53 | 1.53 | 1.53 |
| Loans (As % Of Deposits) | % | 106 | 102 | 104 |
| NPLs (As % Of Loans) | % | 4.51 | 3.72 | 3.54 |
| Provisions (As % Of NPLs) | % | 69.9 | 77.6 | 81.9 |
| Growth Rates | 2015 | 2016 | 2017 | |
| Total Revenue Growth | % | 2.36 | 0.628 | 3.54 |
| Operating Cost Growth | % | 3.52 | 8.00 | 6.14 |
| Operating Profit Growth | % | 0.761 | -9.73 | -0.836 |
| Net Profit Growth | % | 228 | -64.8 | 167 |
| Customer Loan Growth | % | 1.61 | 3.05 | 2.08 |
| Total Asset Growth | % | -1.21 | 0.015 | -0.982 |
| Customer Deposit Growth | % | 4.65 | 6.80 | 0.305 |
| Shareholders' Equity Growth | % | 11.3 | 0.489 | 7.26 |
| Employees | 1,347 | 1,664 | 1,685 | |
Get all company financials in excel:
| summary | Unit | 2006 | 2007 | 2008 | 2009 | 2010 | 2011 | 2012 | 2013 | 2014 | 2015 | 2016 | 2017 |
| income statement | |||||||||||||
| Net Interest Income | EUR mil | 168 | 156 | 178 | 181 | 187 | |||||||
| Total Revenues | EUR mil | 239 | 247 | 270 | 280 | 287 | |||||||
| Operating Profit | EUR mil | 98.8 | 104 | 107 | 118 | 119 | |||||||
| Net Profit | EUR mil | 30.5 | 45.8 | 36.6 | 19.6 | 64.2 | |||||||
| balance sheet | |||||||||||||
| Interbank Loans | EUR mil | 1,314 | 1,297 | 1,325 | 133 | 24.7 | |||||||
| Customer Loans | EUR mil | 7,048 | 7,126 | 7,553 | 7,642 | 7,765 | |||||||
| Debt Securities | EUR mil | 2,635 | 2,938 | 2,888 | 2,719 | 2,539 | |||||||
| Total Assets | EUR mil | 11,805 | 12,108 | 12,437 | 12,279 | 12,131 | |||||||
| Shareholders' Equity | EUR mil | 634 | 759 | 758 | 772 | 859 | |||||||
| Interbank Borrowing | EUR mil | 2,946 | 2,852 | 2,579 | 2,141 | 1,742 | |||||||
| Customer Deposits | EUR mil | 6,107 | 6,297 | 6,912 | 6,988 | 7,313 | |||||||
| Issued Debt Securities | EUR mil | 1,491 | 1,670 | 1,729 | 1,828 | 1,689 | |||||||
| ratios | |||||||||||||
| ROE | % | 5.23 | 6.58 | 4.83 | 2.56 | 7.87 | |||||||
| ROA | % | 0.263 | 0.383 | 0.298 | 0.159 | 0.526 | |||||||
| Costs (As % Of Assets) | % | 1.21 | 1.20 | 1.33 | 1.31 | 1.37 | |||||||
| Costs (As % Of Income) | % | 58.6 | 58.0 | 60.3 | 57.8 | 58.4 | |||||||
| Capital Adequacy Ratio | % | 15.3 | 15.9 | 17.0 | 15.9 | 17.1 | |||||||
| Net Interest Margin | % | 1.45 | 1.30 | 1.45 | 1.47 | 1.53 | |||||||
| Interest Income (As % Of Revenues) | % | 70.2 | 63.2 | 65.9 | 64.8 | 65.1 | |||||||
| Fee Income (As % Of Revenues) | % | 31.7 | 31.4 | 31.8 | 31.3 | 33.5 | |||||||
| Staff Cost (As % Of Total Cost) | % | 65.1 | 73.2 | 70.2 | 63.1 | 61.3 | |||||||
| Equity (As % Of Assets) | % | 5.37 | 6.27 | 6.09 | 6.29 | 7.08 | |||||||
| Loans (As % Of Deposits) | % | 115 | 113 | 109 | 109 | 106 | |||||||
| Loans (As % Assets) | % | 59.7 | 58.9 | 60.7 | 62.2 | 64.0 | |||||||
| NPLs (As % Of Loans) | % | ... | ... | 4.76 | 5.11 | 5.35 | 5.33 | 4.51 | |||||
| Provisions (As % Of NPLs) | % | ... | ... | 67.6 | 67.4 | 65.4 | 73.6 | 69.9 | |||||
| valuation | |||||||||||||
| Book Value Per Share Growth | % | ... | 7.50 | -7.16 | 14.5 | 1.80 | 2.92 |
| income statement | Unit | 2006 | 2007 | 2008 | 2009 | 2010 | 2011 | 2012 | 2013 | 2014 | 2015 | 2016 | 2017 |
| income statement | |||||||||||||
| Interest Income | EUR mil | 327 | 306 | 304 | ... | ... | ... | ... | |||||
| Interest Cost | EUR mil | 160 | 151 | 126 | ... | ... | ... | ... | |||||
| Net Interest Income | EUR mil | 168 | 156 | 178 | 181 | 187 | |||||||
| Net Fee Income | EUR mil | 75.8 | 77.5 | 85.9 | 87.6 | 96.0 | |||||||
| Other Income | EUR mil | -4.60 | 13.3 | 6.30 | 11.1 | 4.00 | |||||||
| Total Revenues | EUR mil | 239 | 247 | 270 | 280 | 287 | |||||||
| Staff Cost | EUR mil | 91.2 | 105 | 114 | 102 | 103 | |||||||
| Depreciation | EUR mil | 8.40 | 6.30 | 22.8 | 10.8 | 10.4 | |||||||
| Other Cost | EUR mil | 40.5 | 32.1 | 25.9 | 48.9 | 54.5 | |||||||
| Operating Cost | EUR mil | 140 | 143 | 163 | 162 | 168 | |||||||
| Operating Profit | EUR mil | 98.8 | 104 | 107 | 118 | 119 | |||||||
| Provisions | EUR mil | 53.3 | 51.5 | 51.6 | 83.6 | 21.6 | |||||||
| Extra and Other Cost | EUR mil | 6.10 | -9.00 | 1.90 | 10.3 | 15.1 | |||||||
| Pre-Tax Profit | EUR mil | 39.4 | 61.1 | 53.8 | 24.4 | 82.5 | |||||||
| Tax | EUR mil | 8.60 | 15.0 | 17.0 | 3.40 | 18.1 | |||||||
| Minorities | EUR mil | 0.300 | 0.300 | 0.200 | 1.40 | 0.200 | |||||||
| Net Profit | EUR mil | 30.5 | 45.8 | 36.6 | 19.6 | 64.2 | |||||||
| growth rates | |||||||||||||
| Net Interest Income Growth | % | ... | 7.50 | -7.16 | 14.5 | 1.80 | 2.92 | ||||||
| Net Fee Income Growth | % | ... | -8.01 | 2.24 | 10.8 | 1.98 | 9.59 | ||||||
| Total Revenue Growth | % | ... | 1.83 | 3.18 | 9.70 | 3.59 | 2.36 | ||||||
| Operating Cost Growth | % | ... | -3.78 | 2.00 | 14.1 | -0.797 | 3.52 | ||||||
| Operating Profit Growth | % | ... | 11.0 | 4.86 | 3.57 | 10.3 | 0.761 | ||||||
| Pre-Tax Profit Growth | % | ... | -11.3 | 55.1 | -11.9 | -54.6 | 238 | ||||||
| Net Profit Growth | % | ... | -2.24 | 50.2 | -20.1 | -46.4 | 228 | ||||||
| market share | |||||||||||||
| Market Share in Revenues | % | 1.24 | 1.29 | 1.43 | 1.40 | 1.38 | |||||||
| Market Share in Net Profit | % | 2.55 | 1.43 | -3.91 | -0.293 | 1.73 | |||||||
| Market Share in Employees | % | ... | 1.55 | 1.58 | 1.76 | 1.78 | 1.84 | ||||||
| Market Share in Branches | % | ... | ... | ... | ... | ... | ... | ... | ... | ... | ... |
| balance sheet | Unit | 2006 | 2007 | 2008 | 2009 | 2010 | 2011 | 2012 | 2013 | 2014 | 2015 | 2016 | 2017 |
| balance sheet | |||||||||||||
| Cash | EUR mil | 265 | 205 | 291 | 1,245 | 1,301 | |||||||
| Interbank Loans | EUR mil | 1,314 | 1,297 | 1,325 | 133 | 24.7 | |||||||
| Customer Loans | EUR mil | 7,048 | 7,126 | 7,553 | 7,642 | 7,765 | |||||||
| Debt Securities | EUR mil | 2,635 | 2,938 | 2,888 | 2,719 | 2,539 | |||||||
| Fixed Assets | EUR mil | 75.0 | 72.6 | 77.4 | 75.8 | 74.1 | |||||||
| Total Assets | EUR mil | 11,805 | 12,108 | 12,437 | 12,279 | 12,131 | |||||||
| Shareholders' Equity | EUR mil | 634 | 759 | 758 | 772 | 859 | |||||||
| Of Which Minority Interest | EUR mil | 0.700 | 0.700 | 0.600 | -0.500 | 1.00 | |||||||
| Liabilities | EUR mil | 11,171 | 11,350 | 11,679 | 11,507 | 11,272 | |||||||
| Interbank Borrowing | EUR mil | 2,946 | 2,852 | 2,579 | 2,141 | 1,742 | |||||||
| Customer Deposits | EUR mil | 6,107 | 6,297 | 6,912 | 6,988 | 7,313 | |||||||
| Issued Debt Securities | EUR mil | 1,491 | 1,670 | 1,729 | 1,828 | 1,689 | |||||||
| Other Liabilities | EUR mil | 628 | 530 | 459 | 550 | 529 | |||||||
| asset quality | |||||||||||||
| Non-Performing Loans | EUR mil | ... | ... | 347 | 377 | 419 | 424 | 361 | |||||
| Gross Loans | EUR mil | 7,283 | 7,380 | 7,827 | 7,954 | 8,018 | |||||||
| Total Provisions | EUR mil | 235 | 254 | 274 | 312 | 253 | |||||||
| growth rates | |||||||||||||
| Customer Loan Growth | % | ... | -0.163 | 1.11 | 5.99 | 1.18 | 1.61 | ||||||
| Total Asset Growth | % | ... | 3.63 | 2.57 | 2.71 | -1.27 | -1.21 | ||||||
| Shareholders' Equity Growth | % | ... | 18.8 | 19.7 | -0.132 | 1.90 | 11.3 | ||||||
| Customer Deposit Growth | % | ... | 1.37 | 3.11 | 9.77 | 1.09 | 4.65 | ||||||
| market share | |||||||||||||
| Market Share in Customer Loans | % | 1.58 | 1.62 | 1.74 | 1.79 | 1.80 | |||||||
| Market Share in Total Assets | % | 1.16 | 1.23 | 1.34 | 1.37 | 1.41 | |||||||
| Market Share in Customer Deposits | % | 1.75 | 1.78 | 1.91 | 1.87 | 1.90 |
| ratios | Unit | 2006 | 2007 | 2008 | 2009 | 2010 | 2011 | 2012 | 2013 | 2014 | 2015 | 2016 | 2017 |
| ratios | |||||||||||||
| ROE | % | 5.23 | 6.58 | 4.83 | 2.56 | 7.87 | |||||||
| ROA | % | 0.263 | 0.383 | 0.298 | 0.159 | 0.526 | |||||||
| Costs (As % Of Assets) | % | 1.21 | 1.20 | 1.33 | 1.31 | 1.37 | |||||||
| Costs (As % Of Income) | % | 58.6 | 58.0 | 60.3 | 57.8 | 58.4 | |||||||
| Capital Adequacy Ratio | % | 15.3 | 15.9 | 17.0 | 15.9 | 17.1 | |||||||
| Tier 1 Ratio | % | 11.0 | 11.8 | 12.9 | 11.5 | 12.6 | |||||||
| Net Interest Margin | % | 1.45 | 1.30 | 1.45 | 1.47 | 1.53 | |||||||
| Interest Spread | % | ... | 1.37 | 1.22 | 1.38 | ... | ... | ... | ... | ||||
| Asset Yield | % | 2.82 | 2.56 | 2.48 | 1.47 | 1.53 | |||||||
| Cost Of Liabilities | % | ... | 1.45 | 1.34 | 1.09 | ... | ... | ... | ... | ||||
| Interest Income (As % Of Revenues) | % | 70.2 | 63.2 | 65.9 | 64.8 | 65.1 | |||||||
| Fee Income (As % Of Revenues) | % | 31.7 | 31.4 | 31.8 | 31.3 | 33.5 | |||||||
| Other Income (As % Of Revenues) | % | -1.93 | 5.40 | 2.33 | 3.96 | 1.40 | |||||||
| Cost Per Employee | USD per month | ... | 8,704 | 9,116 | 9,489 | 8,308 | 7,276 | ||||||
| Cost Per Employee (Local Currency) | EUR per month | ... | 6,260 | 7,100 | 7,148 | 6,446 | 6,347 | ||||||
| Staff Cost (As % Of Total Cost) | % | 65.1 | 73.2 | 70.2 | 63.1 | 61.3 | |||||||
| Equity (As % Of Assets) | % | 5.37 | 6.27 | 6.09 | 6.29 | 7.08 | |||||||
| Loans (As % Of Deposits) | % | 115 | 113 | 109 | 109 | 106 | |||||||
| Loans (As % Assets) | % | 59.7 | 58.9 | 60.7 | 62.2 | 64.0 | |||||||
| NPLs (As % Of Loans) | % | ... | ... | 4.76 | 5.11 | 5.35 | 5.33 | 4.51 | |||||
| Provisions (As % Of NPLs) | % | ... | ... | 67.6 | 67.4 | 65.4 | 73.6 | 69.9 | |||||
| Provisions (As % Of Loans) | % | 3.33 | 3.56 | 3.63 | 4.08 | 3.25 | |||||||
| Cost of Provisions (As % Of Loans) | % | 0.756 | 0.727 | 0.703 | 1.10 | 0.283 |
Get all company financials in excel:


By Helgi Library - September 30, 2018
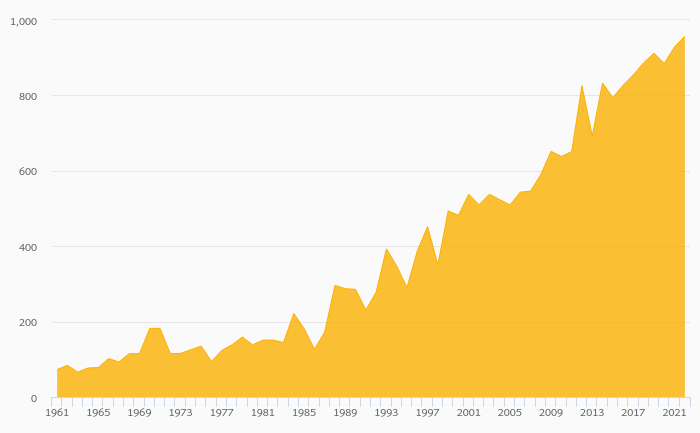
Sparkasse Oberosterreich generated total banking revenues of EUR 299 mil in 2017, up 3.54% compared to the previous year. Austrian banking sector banking sector generated total revenues of EUR 19,521 mil in 2017, up 2.83% when compared to the last yea...
By Helgi Library - June 13, 2018
Sparkasse Oberosterreich's capital adequacy ratio reached 19.4% at the end of 2017, up from 18.9% compared to the previous year. Historically, the bank’s capital ratio hit an all time high of 19.4% in 2017 and an all time low of 12.0% in 2008. The Tier 1 rati...
By Helgi Library - June 13, 2018
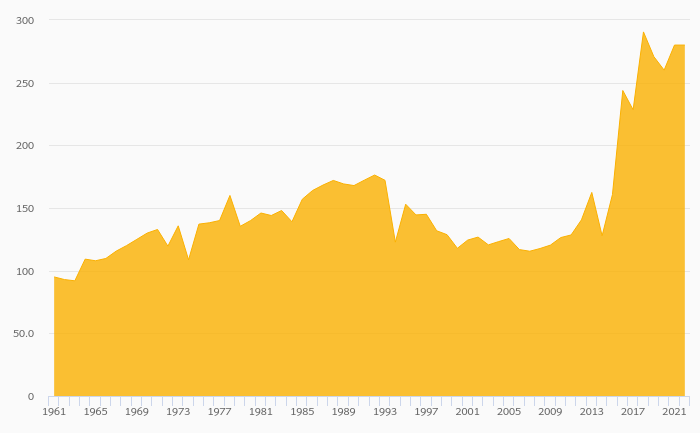
Sparkasse Oberosterreich's non-performing loans reached 3.54% of total loans at the end of 2017, down from 3.72% compared to the previous year. Historically, the NPL ratio hit an all time high of 5.35% in 2013 and an all time low of 2.74% in 2008. Provision...
By Helgi Library - June 13, 2018
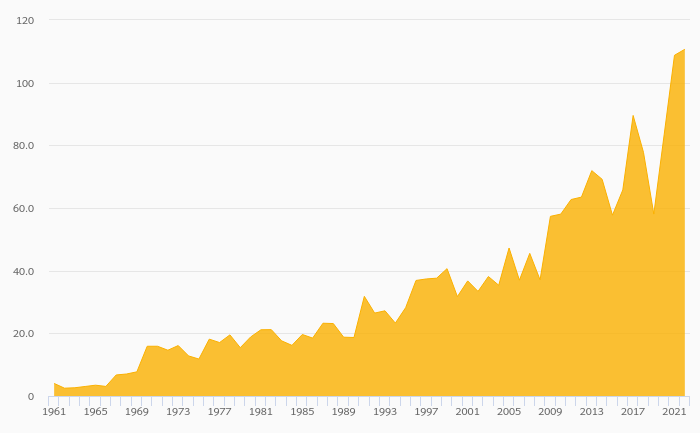
Sparkasse Oberosterreich generated total banking revenues of EUR 299 mil in 2017, up 3.54% compared to the previous year. Historically, the bank’s revenues containing of interest, fee and other non-interest income reached an all time high of EUR 299 mil in 2017...
By Helgi Library - June 13, 2018
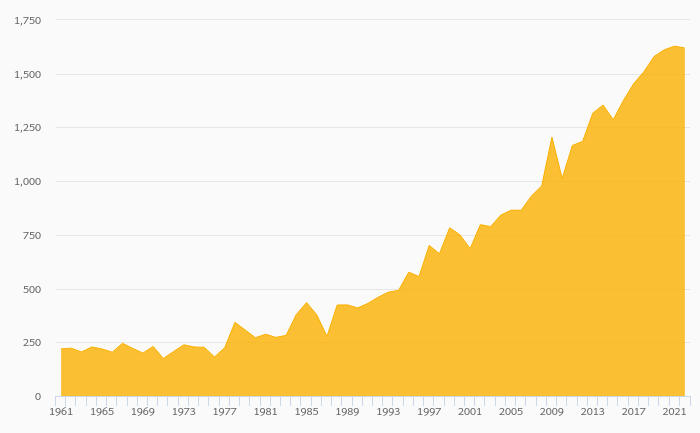
Sparkasse Oberosterreich's customer loan growth reached 2.08% in 2017, down from 3.05% compared to the previous year. Historically, the bank’s loans growth reached an all time high of 15.5% in 2008 and an all time low of -0.163% in 2011. In the last decad...
By Helgi Library - June 13, 2018
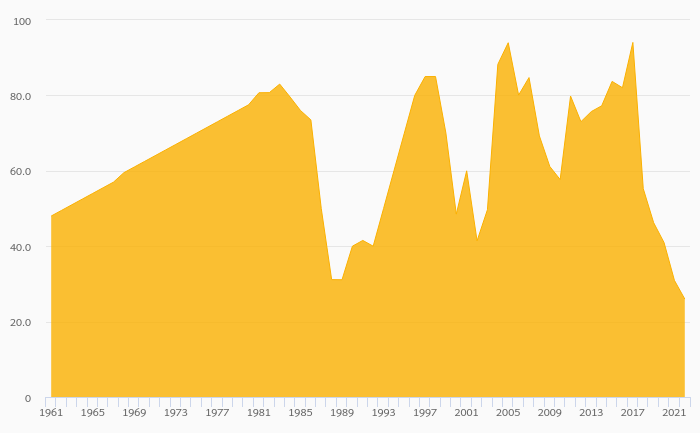
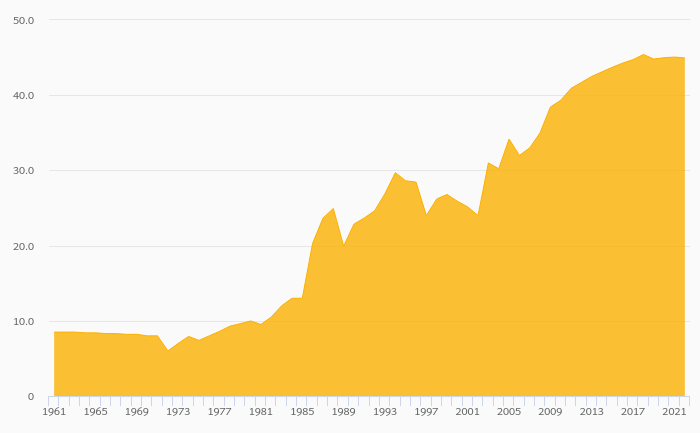
Sparkasse Oberosterreich's net interest margin amounted to 1.45% in 2013, up from 1.30% compared to the previous year. Historically, the bank’s net interest margin reached an all time high of 1.62% in 2007 and an all time low of 1.30% in 2012. The avera...

Sparkasse Oberosterreich has been growing its revenues and asset by 1.98% and 2.12% a year on average in the last 10 years. Its loans and deposits have grown by 3.22% and 2.94% a year during that time and loans to deposits ratio reached 104% at the end of 2017. The company achieved an average return on equity of 6.32% in the last decade with net profit growing 0.494% a year on average. In terms of operating efficiency, its cost to income ratio reached 64.3% in 2017, compared to 59.0% average in the last decade.
Equity represented 7.71% of total assets or 11.3% of loans at the end of 2017. Sparkasse Oberosterreich's non-performing loans were 3.54% of total loans while provisions covered some 81.9% of NPLs at the end of 2017.
 Helgi Library