By Helgi Library - September 26, 2018
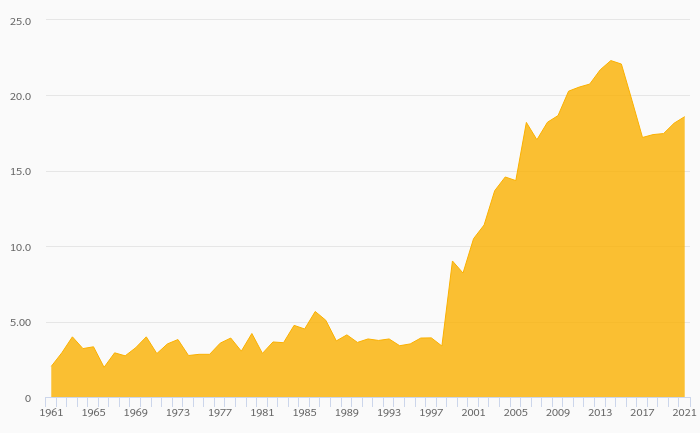
Kärntner Sparkasse's customer deposits reached EUR 3,383 mil in 2017, up 9.61% compared to the previous year. Austrian banking...
By Helgi Library - September 26, 2018
Kärntner Sparkasse generated total banking revenues of EUR 136 mil in 2017, up 4.29% compared to the previous year. Austr...
By Helgi Library - June 15, 2018
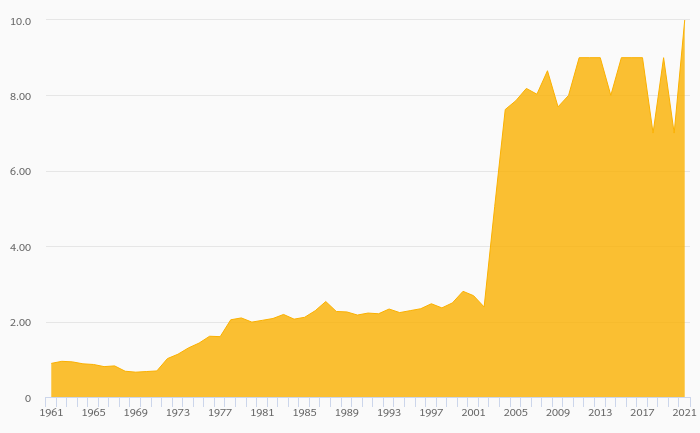
Kärntner Sparkasse's capital adequacy ratio reached 15.2% at the end of 2017, up from 14.4% compared to the previous year. H...
| Profit Statement | 2015 | 2016 | 2017 | |
| Net Interest Income | EUR mil | 82.9 | 86.9 | 90.6 |
| Net Fee Income | EUR mil | 40.6 | 40.3 | 41.7 |
| Other Income | EUR mil | 4.23 | 2.74 | 3.20 |
| Total Revenues | EUR mil | 128 | 130 | 136 |
| Staff Cost | EUR mil | ... | 54.4 | 54.9 |
| Operating Profit | EUR mil | 37.4 | 39.7 | 53.8 |
| Provisions | EUR mil | 3.55 | 5.22 | 5.15 |
| Net Profit | EUR mil | 21.2 | 21.6 | 22.0 |
| Balance Sheet | 2015 | 2016 | 2017 | |
| Interbank Loans | EUR mil | 418 | 33.3 | 11.9 |
| Customer Loans | EUR mil | 3,464 | 3,570 | 3,703 |
| Total Assets | EUR mil | 4,610 | 4,865 | 5,057 |
| Shareholders' Equity | EUR mil | 296 | 359 | 394 |
| Interbank Borrowing | EUR mil | 1,078 | 1,098 | 1,015 |
| Customer Deposits | EUR mil | 2,817 | 3,086 | 3,383 |
| Issued Debt Securities | EUR mil | 290 | 255 | 208 |
| Ratios | 2015 | 2016 | 2017 | |
| ROE | % | 7.11 | 6.59 | 5.85 |
| ROA | % | 0.464 | 0.455 | 0.443 |
| Costs (As % Of Assets) | % | 1.98 | 1.91 | 1.65 |
| Costs (As % Of Income) | % | 70.7 | 69.5 | 60.3 |
| Capital Adequacy Ratio | % | 14.4 | 14.4 | 15.2 |
| Net Interest Margin | % | 1.81 | 1.84 | 1.83 |
| Loans (As % Of Deposits) | % | 123 | 116 | 109 |
| Growth Rates | 2015 | 2016 | 2017 | |
| Total Revenue Growth | % | 0.396 | 1.83 | 4.29 |
| Operating Cost Growth | % | 3.07 | 0.075 | -9.44 |
| Operating Profit Growth | % | -5.50 | 6.05 | 35.5 |
| Net Profit Growth | % | 258 | 1.81 | 1.96 |
| Customer Loan Growth | % | 1.50 | 3.06 | 3.73 |
| Total Asset Growth | % | 1.85 | 5.52 | 3.96 |
| Customer Deposit Growth | % | 8.04 | 9.58 | 9.61 |
| Shareholders' Equity Growth | % | -1.33 | 21.2 | 9.82 |
Get all company financials in excel:
| summary | Unit | 2009 | 2010 | 2011 | 2012 | 2013 | 2014 | 2015 | 2016 | 2017 |
| income statement | ||||||||||
| Net Interest Income | EUR mil | ... | 92.4 | 76.2 | 73.1 | 80.8 | 82.9 | |||
| Total Revenues | EUR mil | ... | 119 | 117 | 119 | 127 | 128 | |||
| Operating Profit | EUR mil | ... | 32.4 | 35.6 | 37.4 | 39.6 | 37.4 | |||
| Net Profit | EUR mil | ... | 10.2 | 0.384 | 4.52 | 5.92 | 21.2 | |||
| balance sheet | ||||||||||
| Interbank Loans | EUR mil | ... | 390 | 447 | 436 | 423 | 418 | |||
| Customer Loans | EUR mil | ... | 3,794 | 3,513 | 3,354 | 3,413 | 3,464 | |||
| Debt Securities | EUR mil | ... | 509 | 402 | 454 | 460 | 496 | |||
| Total Assets | EUR mil | ... | 4,708 | 4,631 | 4,517 | 4,526 | 4,610 | |||
| Shareholders' Equity | EUR mil | ... | 279 | 289 | 291 | 300 | 296 | |||
| Interbank Borrowing | EUR mil | ... | 1,431 | 1,458 | 1,136 | 1,182 | 1,078 | |||
| Customer Deposits | EUR mil | ... | 2,401 | 2,426 | 2,638 | 2,607 | 2,817 | |||
| Issued Debt Securities | EUR mil | ... | 456 | 338 | 340 | 334 | 290 | |||
| ratios | ||||||||||
| ROE | % | ... | 3.56 | 0.135 | 1.56 | 2.00 | 7.11 | |||
| ROA | % | ... | 0.215 | 0.008 | 0.099 | 0.131 | 0.464 | |||
| Costs (As % Of Assets) | % | ... | 1.83 | 1.73 | 1.78 | 1.94 | 1.98 | |||
| Costs (As % Of Income) | % | ... | 72.9 | 69.4 | 68.5 | 68.9 | 70.7 | |||
| Capital Adequacy Ratio | % | 13.6 | 12.9 | 13.3 | 13.9 | 14.4 | ||||
| Net Interest Margin | % | ... | 1.95 | 1.63 | 1.60 | 1.79 | 1.81 | |||
| Interest Income (As % Of Revenues) | % | ... | 77.5 | 65.4 | 61.6 | 63.6 | 64.9 | |||
| Fee Income (As % Of Revenues) | % | ... | 26.9 | 28.3 | 30.0 | 30.8 | 31.8 | |||
| Staff Cost (As % Of Total Cost) | % | ... | ... | ... | ... | ... | ... | ... | ||
| Equity (As % Of Assets) | % | ... | 5.94 | 6.24 | 6.44 | 6.63 | 6.42 | |||
| Loans (As % Of Deposits) | % | ... | 158 | 145 | 127 | 131 | 123 | |||
| Loans (As % Assets) | % | ... | 80.6 | 75.9 | 74.3 | 75.4 | 75.1 | |||
| valuation | ||||||||||
| Book Value Per Share Growth | % | ... | ... | 4.44 | -17.5 | -4.18 | 10.6 | 2.54 |
| income statement | Unit | 2009 | 2010 | 2011 | 2012 | 2013 | 2014 | 2015 | 2016 | 2017 |
| income statement | ||||||||||
| Interest Income | EUR mil | ... | 157 | 129 | 112 | 110 | 102 | |||
| Interest Cost | EUR mil | ... | 64.8 | 53.0 | 38.9 | 29.3 | 19.1 | |||
| Net Interest Income | EUR mil | ... | 92.4 | 76.2 | 73.1 | 80.8 | 82.9 | |||
| Net Fee Income | EUR mil | ... | 32.0 | 33.0 | 35.7 | 39.1 | 40.6 | |||
| Other Income | EUR mil | ... | -5.19 | 7.33 | 9.96 | 7.23 | 4.23 | |||
| Total Revenues | EUR mil | ... | 119 | 117 | 119 | 127 | 128 | |||
| Staff Cost | EUR mil | ... | ... | ... | ... | ... | ... | ... | ||
| Depreciation | EUR mil | ... | ... | ... | 6.70 | 6.69 | 5.84 | 5.90 | ||
| Other Cost | EUR mil | ... | ... | ... | ... | ... | ... | ... | ||
| Operating Cost | EUR mil | ... | 86.9 | 80.9 | 81.3 | 87.6 | 90.2 | |||
| Operating Profit | EUR mil | ... | 32.4 | 35.6 | 37.4 | 39.6 | 37.4 | |||
| Provisions | EUR mil | ... | 29.7 | 46.6 | 34.7 | 28.9 | 3.55 | |||
| Extra and Other Cost | EUR mil | ... | -8.87 | -0.001 | -0.001 | -0.006 | -0.001 | |||
| Pre-Tax Profit | EUR mil | ... | 11.5 | -11.0 | 2.73 | 10.7 | 33.9 | |||
| Tax | EUR mil | ... | 1.43 | 0.111 | 2.20 | 5.92 | 10.6 | |||
| Minorities | EUR mil | ... | 0.133 | 2.83 | 3.98 | -1.17 | 2.08 | |||
| Net Profit | EUR mil | ... | 10.2 | 0.384 | 4.52 | 5.92 | 21.2 | |||
| growth rates | ||||||||||
| Net Interest Income Growth | % | ... | ... | 4.44 | -17.5 | -4.18 | 10.6 | 2.54 | ||
| Net Fee Income Growth | % | ... | ... | 5.57 | 2.93 | 8.14 | 9.69 | 3.71 | ||
| Total Revenue Growth | % | ... | ... | -0.769 | -2.26 | 1.83 | 7.15 | 0.396 | ||
| Operating Cost Growth | % | ... | ... | -0.537 | -6.83 | 0.440 | 7.70 | 3.07 | ||
| Operating Profit Growth | % | ... | ... | -1.39 | 10.0 | 4.99 | 5.95 | -5.50 | ||
| Pre-Tax Profit Growth | % | ... | ... | 183 | -196 | -125 | 290 | 218 | ||
| Net Profit Growth | % | ... | ... | 92.2 | -96.2 | 1,077 | 31.0 | 258 | ||
| market share | ||||||||||
| Market Share in Revenues | % | ... | 0.620 | 0.610 | 0.626 | 0.638 | 0.613 | |||
| Market Share in Net Profit | % | ... | 0.854 | 0.012 | -0.483 | -0.088 | 0.570 |
| balance sheet | Unit | 2009 | 2010 | 2011 | 2012 | 2013 | 2014 | 2015 | 2016 | 2017 |
| balance sheet | ||||||||||
| Cash | EUR mil | ... | 38.4 | 48.4 | 65.8 | 39.6 | 41.5 | |||
| Interbank Loans | EUR mil | ... | 390 | 447 | 436 | 423 | 418 | |||
| Customer Loans | EUR mil | ... | 3,794 | 3,513 | 3,354 | 3,413 | 3,464 | |||
| Debt Securities | EUR mil | ... | 509 | 402 | 454 | 460 | 496 | |||
| Fixed Assets | EUR mil | ... | 72.6 | 69.9 | 69.4 | 70.0 | 75.2 | |||
| Total Assets | EUR mil | ... | 4,708 | 4,631 | 4,517 | 4,526 | 4,610 | |||
| Shareholders' Equity | EUR mil | ... | 279 | 289 | 291 | 300 | 296 | |||
| Of Which Minority Interest | EUR mil | ... | 27.5 | 24.6 | 22.9 | 21.7 | 27.7 | |||
| Liabilities | EUR mil | ... | 4,428 | 4,341 | 4,226 | 4,226 | 4,314 | |||
| Interbank Borrowing | EUR mil | ... | 1,431 | 1,458 | 1,136 | 1,182 | 1,078 | |||
| Customer Deposits | EUR mil | ... | 2,401 | 2,426 | 2,638 | 2,607 | 2,817 | |||
| Issued Debt Securities | EUR mil | ... | 456 | 338 | 340 | 334 | 290 | |||
| Other Liabilities | EUR mil | ... | 140 | 119 | 112 | 103 | 129 | |||
| growth rates | ||||||||||
| Customer Loan Growth | % | ... | ... | 0.983 | -7.42 | -4.52 | 1.77 | 1.50 | ||
| Total Asset Growth | % | ... | ... | -1.17 | -1.64 | -2.46 | 0.207 | 1.85 | ||
| Shareholders' Equity Growth | % | ... | ... | -4.84 | 3.45 | 0.671 | 3.03 | -1.33 | ||
| Customer Deposit Growth | % | ... | ... | -2.66 | 1.05 | 8.72 | -1.17 | 8.04 | ||
| market share | ||||||||||
| Market Share in Customer Loans | % | ... | 0.850 | 0.797 | 0.774 | 0.801 | 0.805 | |||
| Market Share in Total Assets | % | ... | 0.464 | 0.471 | 0.487 | 0.505 | 0.537 | |||
| Market Share in Customer Deposits | % | ... | 0.689 | 0.686 | 0.727 | 0.697 | 0.731 |
| ratios | Unit | 2009 | 2010 | 2011 | 2012 | 2013 | 2014 | 2015 | 2016 | 2017 |
| ratios | ||||||||||
| ROE | % | ... | 3.56 | 0.135 | 1.56 | 2.00 | 7.11 | |||
| ROA | % | ... | 0.215 | 0.008 | 0.099 | 0.131 | 0.464 | |||
| Costs (As % Of Assets) | % | ... | 1.83 | 1.73 | 1.78 | 1.94 | 1.98 | |||
| Costs (As % Of Income) | % | ... | 72.9 | 69.4 | 68.5 | 68.9 | 70.7 | |||
| Capital Adequacy Ratio | % | 13.6 | 12.9 | 13.3 | 13.9 | 14.4 | ||||
| Tier 1 Ratio | % | 13.4 | 11.7 | 12.0 | 12.6 | 13.2 | ||||
| Net Interest Margin | % | ... | 1.95 | 1.63 | 1.60 | 1.79 | 1.81 | |||
| Interest Spread | % | ... | ... | 1.86 | 1.56 | 1.54 | 1.74 | 1.79 | ||
| Asset Yield | % | ... | 3.32 | 2.77 | 2.45 | 2.44 | 2.23 | |||
| Cost Of Liabilities | % | ... | ... | 1.46 | 1.21 | 0.907 | 0.693 | 0.447 | ||
| Interest Income (As % Of Revenues) | % | ... | 77.5 | 65.4 | 61.6 | 63.6 | 64.9 | |||
| Fee Income (As % Of Revenues) | % | ... | 26.9 | 28.3 | 30.0 | 30.8 | 31.8 | |||
| Other Income (As % Of Revenues) | % | ... | -4.35 | 6.29 | 8.40 | 5.68 | 3.31 | |||
| Staff Cost (As % Of Total Cost) | % | ... | ... | ... | ... | ... | ... | ... | ||
| Equity (As % Of Assets) | % | ... | 5.94 | 6.24 | 6.44 | 6.63 | 6.42 | |||
| Loans (As % Of Deposits) | % | ... | 158 | 145 | 127 | 131 | 123 | |||
| Loans (As % Assets) | % | ... | 80.6 | 75.9 | 74.3 | 75.4 | 75.1 | |||
| Cost of Provisions (As % Of Loans) | % | ... | 0.788 | 1.28 | 1.01 | 0.856 | 0.104 |
Get all company financials in excel:

By Helgi Library - June 15, 2018
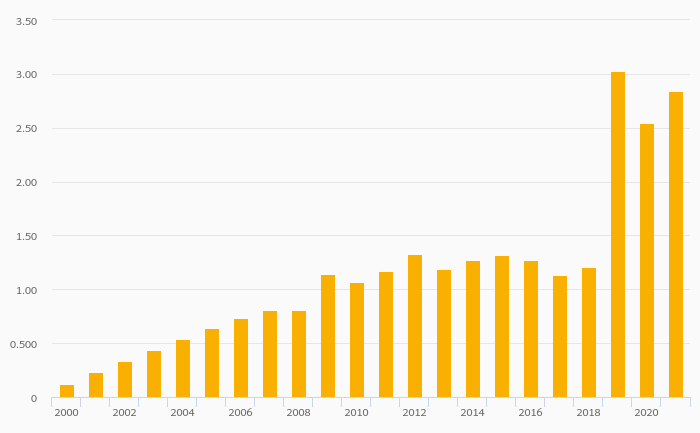
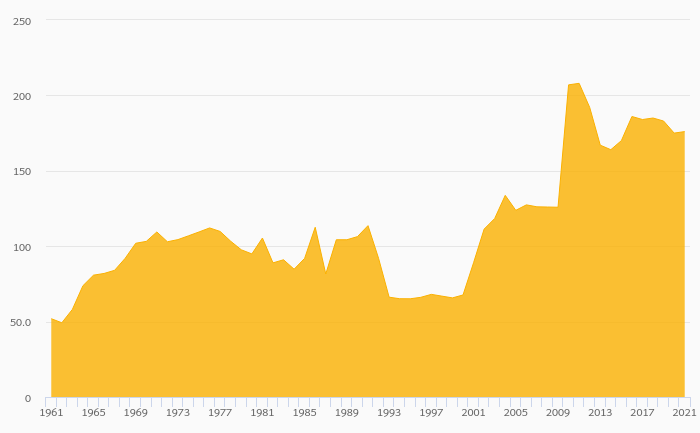
Kärntner Sparkasse made a net profit of EUR 22.0 mil in 2017, up 1.96% compared to the previous year. This implies a return on equity of 5.85%. Historically, the bank’s net profit reached an all time high of EUR 22.0 mil in 2017 and an all time low of EUR ...
By Helgi Library - September 26, 2018
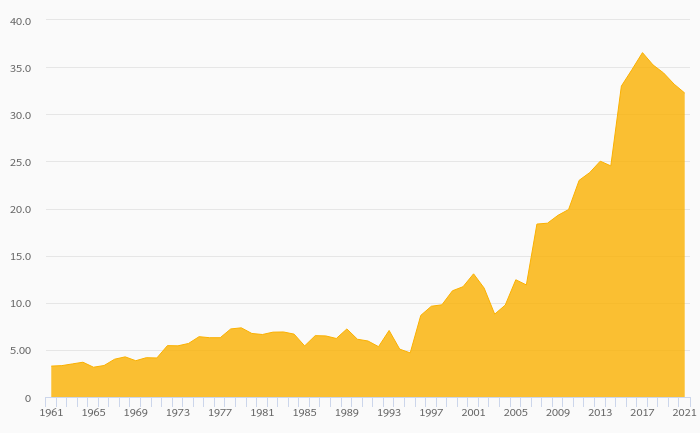
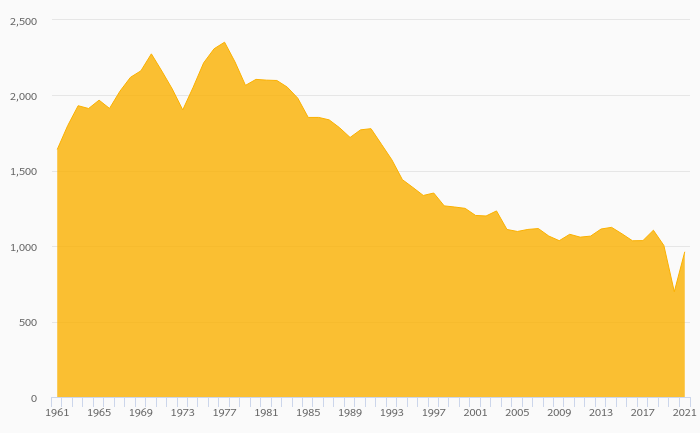
Kärntner Sparkasse's customer loans reached EUR 3,703 mil in 2017, up 3.73% compared to the previous year. Austrian banking sector provided customer loans of EUR 435 bil in 2017, down 0% when compared to the last year. Kärntner Sparkasse accounted for 0...
By Helgi Library - June 15, 2018
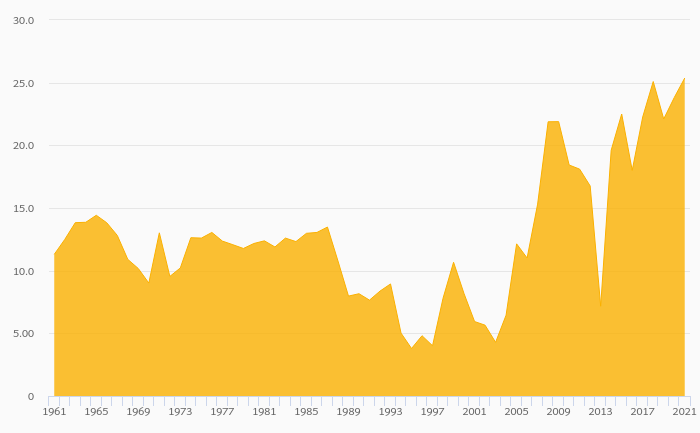
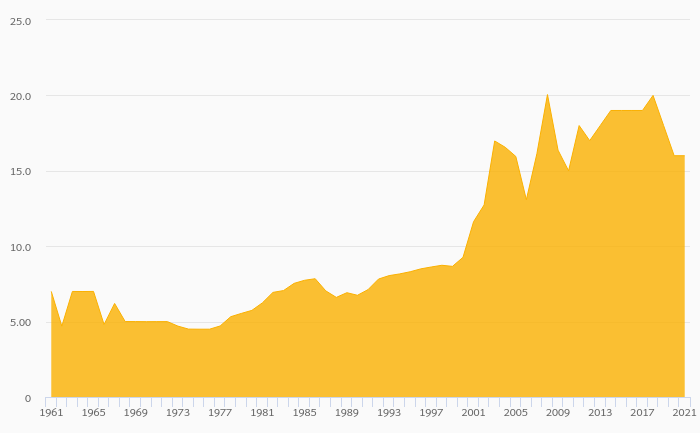
Kärntner Sparkasse's net interest margin amounted to 1.83% in 2017, down from 1.84% compared to the previous year. Historically, the bank’s net interest margin reached an all time high of 1.95% in 2011 and an all time low of 1.60% in 2013. The average ...
By Helgi Library - June 15, 2018
Kärntner Sparkasse generated total banking revenues of EUR 136 mil in 2017, up 4.29% compared to the previous year. Historically, the bank’s revenues containing of interest, fee and other non-interest income reached an all time high of EUR 136 mil in 2017 and ...
By Helgi Library - June 15, 2018
Kärntner Sparkasse's customer loan growth reached 3.73% in 2017, up from 3.06% compared to the previous year. Historically, the bank’s loans growth reached an all time high of 3.73% in 2017 and an all time low of -7.42% in 2012. In the last decade, the a...

Kärntner Sparkasse has been growing its revenues and asset by 2.16% and 3.77% a year on average in the last 3 years. Its loans and deposits have grown by 2.76% and 9.07% a year during that time and loans to deposits ratio reached 109% at the end of 2017. The company achieved an average return on equity of 6.52% in the last three years with net profit growing 54.9% a year on average. In terms of operating efficiency, its cost to income ratio reached 60.3% in 2017, compared to 66.8% average in the last three years.
Equity represented 7.79% of total assets or 10.6% of loans at the end of 2017. Kärntner Sparkasse's non-performing loans were of total loans while provisions covered some of NPLs at the end of 2017.
 Helgi Library