By Helgi Library - September 29, 2018
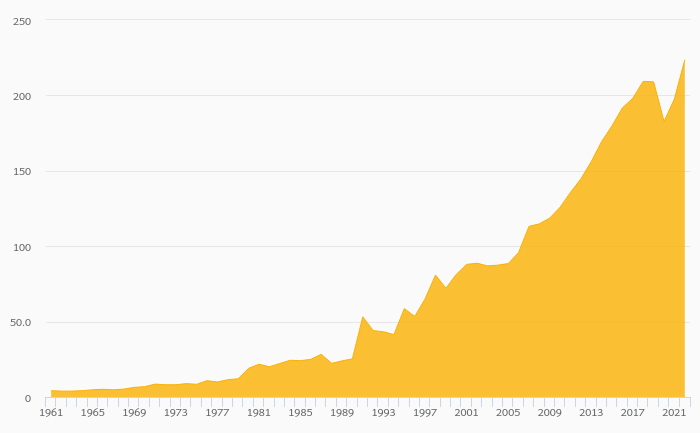
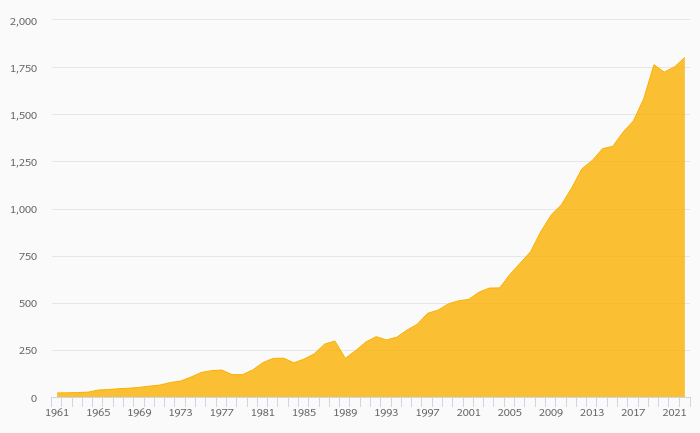
Raiffeisenlandesbank Tirol's customer loans reached EUR 2,611 mil in 2017, up 8.52% compared to the previous year. Austrian ban...
By Helgi Library - September 29, 2018
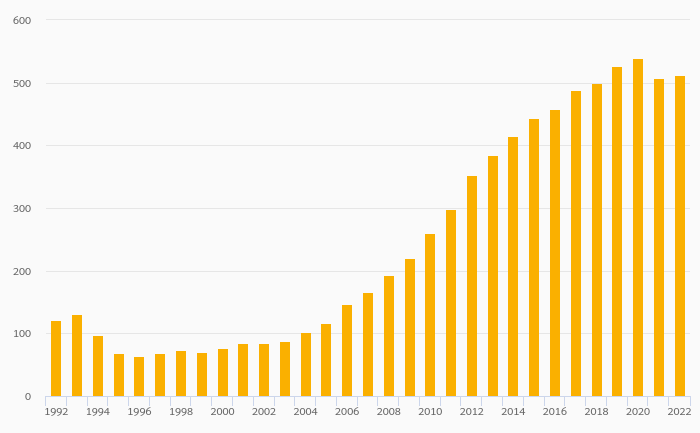
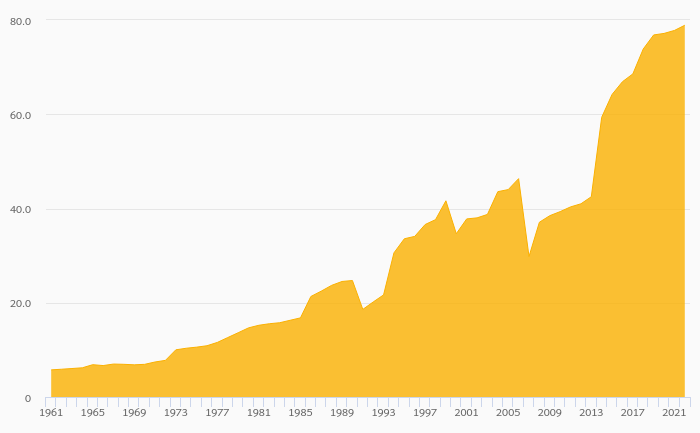
Raiffeisenlandesbank Tirol generated total banking revenues of EUR 78.2 mil in 2017, down 14.2% compared to the previous year. ...
By Helgi Library - June 12, 2018
Raiffeisenlandesbank Tirol's net interest margin amounted to 0.635% in 2017, down from 0.706% compared to the previous year. ...
| Profit Statement | 2015 | 2016 | 2017 | |
| Net Interest Income | EUR mil | 50.9 | 51.9 | 46.7 |
| Net Fee Income | EUR mil | 22.6 | 20.7 | 20.6 |
| Other Income | EUR mil | 21.0 | 18.6 | 10.9 |
| Total Revenues | EUR mil | 94.5 | 91.2 | 78.2 |
| Staff Cost | EUR mil | 31.8 | 30.5 | 33.2 |
| Operating Profit | EUR mil | 30.3 | 28.4 | 12.6 |
| Provisions | EUR mil | 9.70 | 5.70 | 1.40 |
| Net Profit | EUR mil | 12.4 | 19.7 | 14.1 |
| Balance Sheet | 2015 | 2016 | 2017 | |
| Interbank Loans | EUR mil | 2,786 | 2,785 | 2,477 |
| Customer Loans | EUR mil | 2,413 | 2,406 | 2,611 |
| Total Assets | EUR mil | 7,423 | 7,295 | 7,427 |
| Shareholders' Equity | EUR mil | 395 | 457 | 481 |
| Interbank Borrowing | EUR mil | 3,681 | 3,556 | 3,762 |
| Customer Deposits | EUR mil | 1,818 | 1,874 | 1,858 |
| Issued Debt Securities | EUR mil | 1,368 | 1,312 | 1,240 |
| Ratios | 2015 | 2016 | 2017 | |
| ROE | % | 3.18 | 4.62 | 3.01 |
| ROA | % | 0.171 | 0.268 | 0.192 |
| Costs (As % Of Assets) | % | 0.885 | 0.853 | 0.891 |
| Costs (As % Of Income) | % | 67.9 | 68.8 | 83.8 |
| Capital Adequacy Ratio | % | 14.2 | 15.1 | 16.4 |
| Net Interest Margin | % | 0.702 | 0.706 | 0.635 |
| Loans (As % Of Deposits) | % | 133 | 128 | 141 |
| NPLs (As % Of Loans) | % | 6.26 | 5.69 | 4.52 |
| Growth Rates | 2015 | 2016 | 2017 | |
| Total Revenue Growth | % | -12.2 | -3.43 | -14.2 |
| Operating Cost Growth | % | -1.83 | -2.18 | 4.46 |
| Operating Profit Growth | % | -28.3 | -6.09 | -55.6 |
| Net Profit Growth | % | -41.0 | 58.9 | -28.4 |
| Customer Loan Growth | % | 2.55 | -0.290 | 8.52 |
| Total Asset Growth | % | 4.86 | -1.72 | 1.81 |
| Customer Deposit Growth | % | 7.07 | 3.08 | -0.854 |
| Shareholders' Equity Growth | % | 2.60 | 15.8 | 5.18 |
| Employees | 342 | 336 | 348 | |
Get all company financials in excel:
| summary | Unit | 2008 | 2009 | 2010 | 2011 | 2012 | 2013 | 2014 | 2015 | 2016 | 2017 |
| income statement | |||||||||||
| Net Interest Income | EUR mil | ... | ... | 57.0 | 57.7 | 56.2 | 54.9 | 50.9 | |||
| Total Revenues | EUR mil | ... | ... | 111 | 110 | 111 | 108 | 94.5 | |||
| Operating Profit | EUR mil | ... | ... | 44.4 | 43.1 | 40.7 | 42.3 | 30.3 | |||
| Net Profit | EUR mil | ... | ... | 17.8 | 11.2 | 17.9 | 21.0 | 12.4 | |||
| balance sheet | |||||||||||
| Interbank Loans | EUR mil | ... | ... | 2,831 | 2,826 | 2,756 | 2,595 | 2,786 | |||
| Customer Loans | EUR mil | ... | ... | 2,519 | 2,405 | 2,353 | 2,353 | 2,413 | |||
| Debt Securities | EUR mil | ... | ... | 1,663 | 1,503 | 1,833 | 1,783 | 1,914 | |||
| Total Assets | EUR mil | 7,356 | 7,070 | 7,299 | 7,079 | 7,423 | |||||
| Shareholders' Equity | EUR mil | ... | ... | 360 | 363 | 372 | 385 | 395 | |||
| Interbank Borrowing | EUR mil | ... | ... | 3,952 | 3,506 | 3,697 | 3,535 | 3,681 | |||
| Customer Deposits | EUR mil | ... | ... | 1,458 | 1,615 | 1,621 | 1,698 | 1,818 | |||
| Issued Debt Securities | EUR mil | ... | ... | 1,379 | 1,388 | 1,441 | 1,313 | 1,368 | |||
| ratios | |||||||||||
| ROE | % | ... | ... | 5.00 | 3.10 | 4.87 | 5.55 | 3.18 | |||
| ROA | % | ... | ... | 0.244 | 0.155 | 0.249 | 0.292 | 0.171 | |||
| Costs (As % Of Assets) | % | ... | ... | 0.910 | 0.932 | 0.976 | 0.910 | 0.885 | |||
| Costs (As % Of Income) | % | ... | ... | 59.8 | 60.9 | 63.3 | 60.8 | 67.9 | |||
| Capital Adequacy Ratio | % | ... | 11.1 | 11.8 | 12.7 | 13.5 | 14.2 | ||||
| Net Interest Margin | % | ... | ... | 0.785 | 0.800 | 0.782 | 0.763 | 0.702 | |||
| Interest Income (As % Of Revenues) | % | ... | ... | 51.6 | 52.3 | 50.7 | 51.0 | 53.9 | |||
| Fee Income (As % Of Revenues) | % | ... | ... | 21.3 | 20.0 | 20.2 | 20.5 | 23.9 | |||
| Staff Cost (As % Of Total Cost) | % | ... | ... | 55.4 | 57.9 | 55.5 | 51.8 | 49.5 | |||
| Equity (As % Of Assets) | % | ... | ... | 4.90 | 5.13 | 5.10 | 5.44 | 5.32 | |||
| Loans (As % Of Deposits) | % | ... | ... | 173 | 149 | 145 | 139 | 133 | |||
| Loans (As % Assets) | % | ... | ... | 34.2 | 34.0 | 32.2 | 33.2 | 32.5 | |||
| NPLs (As % Of Loans) | % | ... | ... | ... | 6.81 | 6.86 | 6.97 | 6.50 | 6.26 | ||
| valuation | |||||||||||
| Book Value Per Share Growth | % | ... | ... | ... | 2.52 | 1.22 | -2.68 | -2.36 | -7.23 |
| income statement | Unit | 2008 | 2009 | 2010 | 2011 | 2012 | 2013 | 2014 | 2015 | 2016 | 2017 |
| income statement | |||||||||||
| Interest Income | EUR mil | ... | ... | 176 | 158 | 235 | 219 | 182 | |||
| Interest Cost | EUR mil | ... | ... | 119 | 99.8 | 179 | 164 | 131 | |||
| Net Interest Income | EUR mil | ... | ... | 57.0 | 57.7 | 56.2 | 54.9 | 50.9 | |||
| Net Fee Income | EUR mil | ... | ... | 23.6 | 22.1 | 22.4 | 22.1 | 22.6 | |||
| Other Income | EUR mil | ... | ... | 30.0 | 30.5 | 32.2 | 30.7 | 21.0 | |||
| Total Revenues | EUR mil | ... | ... | 111 | 110 | 111 | 108 | 94.5 | |||
| Staff Cost | EUR mil | ... | ... | 36.7 | 38.9 | 38.9 | 33.9 | 31.8 | |||
| Depreciation | EUR mil | ... | ... | 3.05 | 2.80 | 2.60 | 2.40 | 2.40 | |||
| Other Cost | EUR mil | ... | ... | 26.5 | 25.5 | 28.6 | 29.1 | 30.0 | |||
| Operating Cost | EUR mil | ... | ... | 66.2 | 67.2 | 70.1 | 65.4 | 64.2 | |||
| Operating Profit | EUR mil | ... | ... | 44.4 | 43.1 | 40.7 | 42.3 | 30.3 | |||
| Provisions | EUR mil | ... | ... | 20.2 | 18.3 | 15.2 | 15.8 | 9.70 | |||
| Extra and Other Cost | EUR mil | ... | ... | 0.001 | 0.029 | -0.120 | -0.048 | -0.015 | |||
| Pre-Tax Profit | EUR mil | ... | ... | 24.2 | 24.8 | 25.6 | 26.5 | 20.6 | |||
| Tax | EUR mil | ... | ... | 6.44 | 13.6 | 7.70 | 5.50 | 8.20 | |||
| Minorities | EUR mil | ... | ... | 0 | 0 | 0 | 0 | 0 | |||
| Net Profit | EUR mil | ... | ... | 17.8 | 11.2 | 17.9 | 21.0 | 12.4 | |||
| growth rates | |||||||||||
| Net Interest Income Growth | % | ... | ... | ... | 2.52 | 1.22 | -2.68 | -2.36 | -7.23 | ||
| Net Fee Income Growth | % | ... | ... | ... | -2.52 | -6.16 | 1.36 | -1.34 | 2.26 | ||
| Total Revenue Growth | % | ... | ... | ... | 1.48 | -0.228 | 0.409 | -2.82 | -12.2 | ||
| Operating Cost Growth | % | ... | ... | ... | -0.616 | 1.56 | 4.32 | -6.70 | -1.83 | ||
| Operating Profit Growth | % | ... | ... | ... | 4.78 | -2.89 | -5.68 | 3.86 | -28.3 | ||
| Pre-Tax Profit Growth | % | ... | ... | ... | 37.3 | 2.44 | 3.23 | 3.52 | -22.3 | ||
| Net Profit Growth | % | ... | ... | ... | 18.8 | -37.0 | 59.8 | 17.3 | -41.0 | ||
| market share | |||||||||||
| Market Share in Revenues | % | ... | ... | 0.575 | 0.577 | 0.585 | 0.540 | 0.454 | |||
| Market Share in Net Profit | % | ... | ... | 1.49 | 0.348 | -1.91 | -0.314 | 0.333 | |||
| Market Share in Employees | % | ... | ... | 0.585 | 0.585 | 0.557 | 0.504 | 0.466 | |||
| Market Share in Branches | % | ... | ... | ... | ... | ... | ... | ... | 6.01 | ... | ... |
| balance sheet | Unit | 2008 | 2009 | 2010 | 2011 | 2012 | 2013 | 2014 | 2015 | 2016 | 2017 |
| balance sheet | |||||||||||
| Cash | EUR mil | ... | ... | 18.5 | 20.7 | 25.6 | 16.9 | 17.9 | |||
| Interbank Loans | EUR mil | ... | ... | 2,831 | 2,826 | 2,756 | 2,595 | 2,786 | |||
| Customer Loans | EUR mil | ... | ... | 2,519 | 2,405 | 2,353 | 2,353 | 2,413 | |||
| Debt Securities | EUR mil | ... | ... | 1,663 | 1,503 | 1,833 | 1,783 | 1,914 | |||
| Fixed Assets | EUR mil | ... | ... | 45.7 | 44.9 | 41.9 | 40.4 | 38.3 | |||
| Total Assets | EUR mil | 7,356 | 7,070 | 7,299 | 7,079 | 7,423 | |||||
| Shareholders' Equity | EUR mil | ... | ... | 360 | 363 | 372 | 385 | 395 | |||
| Of Which Minority Interest | EUR mil | ... | ... | 0 | 0 | 0 | 0 | 0 | |||
| Liabilities | EUR mil | ... | ... | 6,996 | 6,707 | 6,927 | 6,694 | 7,028 | |||
| Interbank Borrowing | EUR mil | ... | ... | 3,952 | 3,506 | 3,697 | 3,535 | 3,681 | |||
| Customer Deposits | EUR mil | ... | ... | 1,458 | 1,615 | 1,621 | 1,698 | 1,818 | |||
| Issued Debt Securities | EUR mil | ... | ... | 1,379 | 1,388 | 1,441 | 1,313 | 1,368 | |||
| Other Liabilities | EUR mil | ... | ... | 206 | 198 | 168 | 148 | 161 | |||
| growth rates | |||||||||||
| Customer Loan Growth | % | ... | ... | ... | -2.30 | -4.51 | -2.16 | 0 | 2.55 | ||
| Total Asset Growth | % | ... | 2.42 | -3.89 | 3.24 | -3.01 | 4.86 | ||||
| Shareholders' Equity Growth | % | ... | ... | ... | 2.64 | 0.800 | 2.48 | 3.49 | 2.60 | ||
| Customer Deposit Growth | % | ... | ... | ... | 3.86 | 10.8 | 0.372 | 4.75 | 7.07 | ||
| market share | |||||||||||
| Market Share in Customer Loans | % | ... | ... | 0.564 | 0.545 | 0.543 | 0.552 | 0.561 | |||
| Market Share in Total Assets | % | 0.725 | 0.720 | 0.787 | 0.790 | 0.864 | |||||
| Market Share in Customer Deposits | % | ... | ... | 0.419 | 0.456 | 0.447 | 0.454 | 0.472 |
| ratios | Unit | 2008 | 2009 | 2010 | 2011 | 2012 | 2013 | 2014 | 2015 | 2016 | 2017 |
| ratios | |||||||||||
| ROE | % | ... | ... | 5.00 | 3.10 | 4.87 | 5.55 | 3.18 | |||
| ROA | % | ... | ... | 0.244 | 0.155 | 0.249 | 0.292 | 0.171 | |||
| Costs (As % Of Assets) | % | ... | ... | 0.910 | 0.932 | 0.976 | 0.910 | 0.885 | |||
| Costs (As % Of Income) | % | ... | ... | 59.8 | 60.9 | 63.3 | 60.8 | 67.9 | |||
| Capital Adequacy Ratio | % | ... | 11.1 | 11.8 | 12.7 | 13.5 | 14.2 | ||||
| Tier 1 Ratio | % | ... | ... | ... | ... | ... | ... | 12.5 | 13.1 | ... | ... |
| Net Interest Margin | % | ... | ... | 0.785 | 0.800 | 0.782 | 0.763 | 0.702 | |||
| Interest Spread | % | ... | ... | ... | 0.700 | 0.727 | 0.648 | 0.636 | 0.599 | ||
| Asset Yield | % | ... | ... | 2.43 | 2.18 | 3.27 | 3.04 | 2.51 | |||
| Cost Of Liabilities | % | ... | ... | ... | 1.73 | 1.46 | 2.62 | 2.40 | 1.92 | ||
| Interest Income (As % Of Revenues) | % | ... | ... | 51.6 | 52.3 | 50.7 | 51.0 | 53.9 | |||
| Fee Income (As % Of Revenues) | % | ... | ... | 21.3 | 20.0 | 20.2 | 20.5 | 23.9 | |||
| Other Income (As % Of Revenues) | % | ... | ... | 27.1 | 27.6 | 29.1 | 28.5 | 22.2 | |||
| Cost Per Employee | USD per month | ... | ... | 9,305 | 9,196 | 10,164 | 9,742 | 8,893 | |||
| Cost Per Employee (Local Currency) | EUR per month | ... | ... | 6,693 | 7,162 | 7,656 | 7,558 | 7,758 | |||
| Staff Cost (As % Of Total Cost) | % | ... | ... | 55.4 | 57.9 | 55.5 | 51.8 | 49.5 | |||
| Equity (As % Of Assets) | % | ... | ... | 4.90 | 5.13 | 5.10 | 5.44 | 5.32 | |||
| Loans (As % Of Deposits) | % | ... | ... | 173 | 149 | 145 | 139 | 133 | |||
| Loans (As % Assets) | % | ... | ... | 34.2 | 34.0 | 32.2 | 33.2 | 32.5 | |||
| NPLs (As % Of Loans) | % | ... | ... | ... | 6.81 | 6.86 | 6.97 | 6.50 | 6.26 | ||
| Cost of Provisions (As % Of Loans) | % | ... | ... | 0.793 | 0.743 | 0.639 | 0.671 | 0.412 |
Get all company financials in excel:

By Helgi Library - September 29, 2018
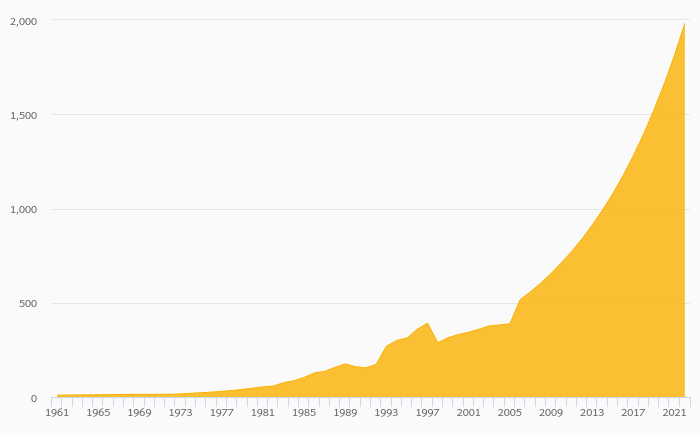
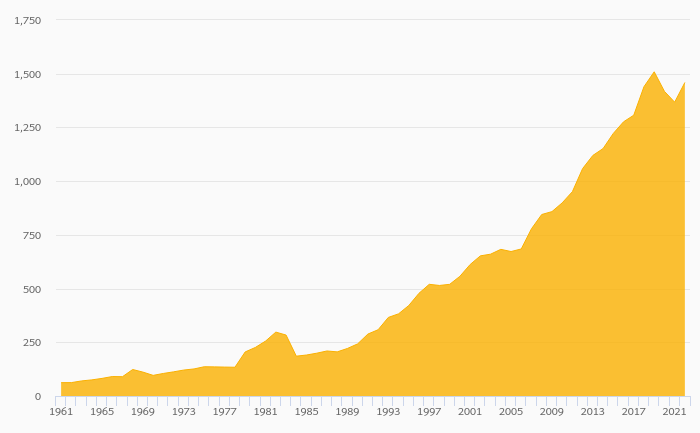
Raiffeisenlandesbank Tirol's customer deposits reached EUR 1,858 mil in 2017, down 0.854% compared to the previous year. Austrian banking sector accepted customer deposits of EUR 405 bil in 2017, up 2.53% when compared to the last year. Raiffeisenlandesba...
By Helgi Library - June 12, 2018
Raiffeisenlandesbank Tirol generated total banking revenues of EUR 78.2 mil in 2017, down 14.2% compared to the previous year. Historically, the bank’s revenues containing of interest, fee and other non-interest income reached an all time high of EUR 111 mil in...
By Helgi Library - June 12, 2018
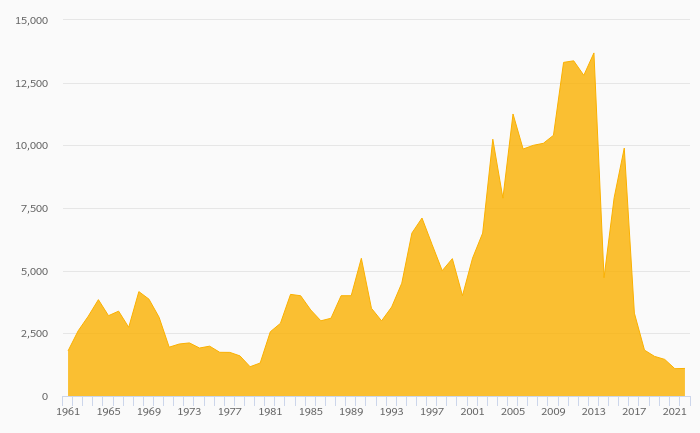
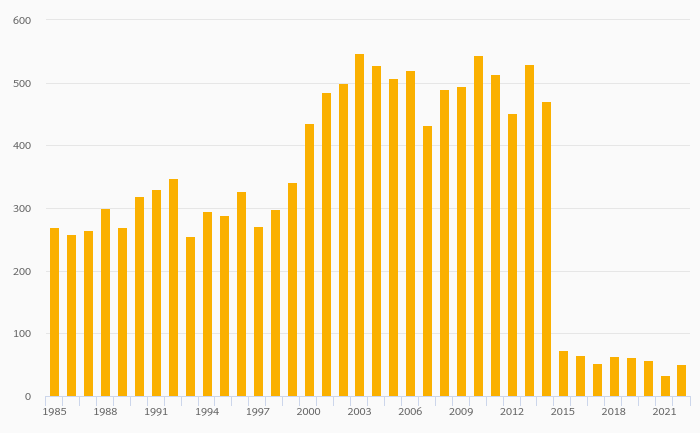
Raiffeisenlandesbank Tirol made a net profit of EUR 14.1 mil in 2017, down 28.4% compared to the previous year. This implies a return on equity of 3.01%. Historically, the bank’s net profit reached an all time high of EUR 21.0 mil in 2014 and an all time low of...
By Helgi Library - June 12, 2018
Raiffeisenlandesbank Tirol's customer loan growth reached 8.52% in 2017, up from -0.290% compared to the previous year. Historically, the bank’s loans growth reached an all time high of 8.52% in 2017 and an all time low of -4.51% in 2012. In the last deca...

Raiffeisenlandesbank Tirol has been growing its revenues and asset by -10.1% and 1.61% a year on average in the last 3 years. Its loans and deposits have grown by 3.53% and 3.05% a year during that time and loans to deposits ratio reached 141% at the end of 2017. The company achieved an average return on equity of 3.60% in the last three years with net profit growing -12.4% a year on average. In terms of operating efficiency, its cost to income ratio reached 83.8% in 2017, compared to 73.5% average in the last three years.
Equity represented 6.48% of total assets or 18.4% of loans at the end of 2017. Raiffeisenlandesbank Tirol's non-performing loans were 4.52% of total loans while provisions covered some of NPLs at the end of 2017.
 Helgi Library