By Helgi Library - December 12, 2019
Isbank's customer loans reached TRY 274,682 mil in 2017, up 19.4% compared to the previous year. Turkish banking sector provide...
By Helgi Library - December 12, 2019
Isbank's customer deposits reached TRY 198,875 mil in 2017, up 17.7% compared to the previous year. Turkish banking sector acce...
By Helgi Library - June 18, 2018
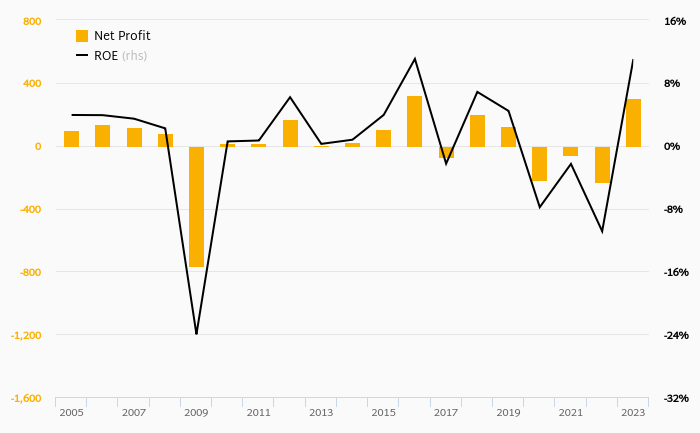
Isbank made a net profit of TRY 5,749 mil under revenues of TRY 23,321 mil in 2017, up 5.51% and 14.3% respectively compared to the p...
| Profit Statement | 2015 | 2016 | 2017 | |
| Net Interest Income | TRY mil | 10,196 | 12,308 | 14,871 |
| Net Fee Income | TRY mil | 1,808 | 2,137 | 2,723 |
| Other Income | TRY mil | 6,141 | 5,955 | 5,727 |
| Total Revenues | TRY mil | 18,145 | 20,400 | 23,321 |
| Staff Cost | TRY mil | 3,139 | 4,182 | 4,430 |
| Operating Profit | TRY mil | 6,880 | 10,045 | 10,559 |
| Provisions | TRY mil | 2,290 | 1,737 | 1,517 |
| Net Profit | TRY mil | 3,331 | 5,449 | 5,749 |
| Balance Sheet | 2015 | 2016 | 2017 | |
| Interbank Loans | TRY mil | 7,684 | 9,971 | 11,816 |
| Customer Loans | TRY mil | 191,046 | 230,003 | 274,682 |
| Total Assets | TRY mil | 325,499 | 371,318 | 432,758 |
| Shareholders' Equity | TRY mil | 36,684 | 50,156 | 56,437 |
| Interbank Borrowing | TRY mil | 28,121 | 7,051 | 5,978 |
| Customer Deposits | TRY mil | 150,705 | 169,038 | 198,875 |
| Issued Debt Securities | TRY mil | 74,947 | 91,245 | 111,177 |
| Ratios | 2015 | 2016 | 2017 | |
| ROE | % | 9.56 | 12.5 | 10.8 |
| ROA | % | 1.11 | 1.56 | 1.43 |
| Costs (As % Of Assets) | % | 3.74 | 2.97 | 3.17 |
| Costs (As % Of Income) | % | 62.1 | 50.8 | 54.7 |
| Capital Adequacy Ratio | % | 15.1 | 14.3 | 15.2 |
| Net Interest Margin | % | 3.38 | 3.53 | 3.70 |
| Loans (As % Of Deposits) | % | 127 | 136 | 138 |
| NPLs (As % Of Loans) | % | 2.02 | 2.34 | 2.16 |
| Provisions (As % Of NPLs) | % | 73.8 | 94.1 | 104 |
| Valuation | 2015 | 2016 | 2017 | |
| Price/Earnings (P/E) | 15.5 | 10.7 | 13.6 | |
| Price/Book Value (P/BV) | 1.41 | 1.16 | 1.39 | |
| Dividend Yield | % | 2.36 | 3.13 | ... |
| Earnings Per Share (EPS) | TRY | 0.296 | 0.484 | 0.511 |
| Book Value Per Share | TRY | 3.26 | 4.46 | 5.02 |
| Dividend Per Share | 0.108 | 0.162 | ... | |
Get all company financials in excel:
| summary | Unit | 1958 | 1959 | 1960 | 1961 | 1962 | 1963 | 1964 | 1965 | 1966 | 1967 | 1968 | 1969 | 1970 | 1971 | 1972 | 1973 | 1974 | 1975 | 1976 | 1977 | 1978 | 1979 | 1980 | 1981 | 1982 | 1983 | 1984 | 1985 | 1986 | 1987 | 1988 | 1989 | 1990 | 1991 | 1992 | 1993 | 1994 | 1995 | 1996 | 1997 | 1998 | 1999 | 2000 | 2001 | 2002 | 2003 | 2004 | 2005 | 2006 | 2007 | 2008 | 2009 | 2010 | 2011 | 2012 | 2013 | 2014 | 2015 | 2016 | 2017 |
| income statement | |||||||||||||||||||||||||||||||||||||||||||||||||||||||||||||
| Net Interest Income | TRY mil | ... | ... | ... | ... | ... | ... | ... | ... | ... | ... | ... | ... | ... | ... | ... | ... | ... | ... | ... | ... | ... | ... | ... | ... | ... | ... | ... | ... | ... | ... | ... | ... | ... | ... | ... | ... | ... | ... | ... | ... | ... | ... | ... | 4,562 | 5,943 | 6,650 | 8,470 | 10,196 | ||||||||||||
| Total Revenues | TRY mil | ... | ... | ... | ... | ... | ... | ... | ... | ... | ... | ... | ... | ... | ... | ... | ... | ... | ... | ... | ... | ... | ... | ... | ... | ... | ... | ... | ... | ... | ... | ... | ... | ... | ... | ... | ... | ... | ... | ... | ... | ... | ... | ... | 8,163 | 9,517 | 9,939 | 16,057 | 18,145 | ||||||||||||
| Operating Profit | TRY mil | ... | ... | ... | ... | ... | ... | ... | ... | ... | ... | ... | ... | ... | ... | ... | ... | ... | ... | ... | ... | ... | ... | ... | ... | ... | ... | ... | ... | ... | ... | ... | ... | ... | ... | ... | ... | ... | ... | ... | ... | ... | ... | ... | 4,682 | 4,433 | 4,579 | 6,557 | 6,880 | ||||||||||||
| Net Profit | TRY mil | ... | ... | ... | ... | ... | ... | ... | ... | ... | ... | ... | ... | ... | ... | ... | ... | ... | ... | ... | ... | ... | ... | ... | ... | ... | ... | ... | ... | ... | ... | ... | ... | ... | ... | ... | ... | ... | ... | ... | ... | ... | ... | ... | 2,667 | 3,632 | 3,566 | 3,524 | 3,331 | ||||||||||||
| balance sheet | |||||||||||||||||||||||||||||||||||||||||||||||||||||||||||||
| Interbank Loans | TRY mil | ... | ... | ... | ... | ... | ... | ... | ... | ... | ... | ... | ... | ... | ... | ... | ... | ... | ... | ... | ... | ... | ... | ... | ... | ... | ... | ... | ... | ... | ... | ... | ... | ... | ... | ... | ... | ... | ... | ... | ... | ... | ... | ... | ... | ... | 2,297 | 15,634 | 22,335 | 6,270 | 7,684 | ||||||||||
| Customer Loans | TRY mil | 91,621 | 106,081 | 134,163 | 166,323 | 191,046 | |||||||||||||||||||||||||||||||||||||||||||||||||||||||
| Debt Securities | TRY mil | ... | ... | ... | ... | ... | ... | ... | ... | ... | ... | ... | ... | ... | ... | ... | ... | ... | ... | ... | ... | ... | ... | ... | ... | ... | ... | ... | ... | ... | ... | ... | ... | ... | ... | ... | ... | ... | ... | ... | ... | ... | ... | ... | 50,029 | 47,177 | 46,667 | 49,329 | 54,010 | ||||||||||||
| Total Assets | TRY mil | 161,668 | 173,841 | 209,047 | 277,073 | 325,499 | |||||||||||||||||||||||||||||||||||||||||||||||||||||||
| Shareholders' Equity | TRY mil | 17,921 | 23,787 | 25,049 | 33,005 | 36,684 | |||||||||||||||||||||||||||||||||||||||||||||||||||||||
| Interbank Borrowing | TRY mil | ... | ... | ... | ... | ... | ... | ... | ... | ... | ... | ... | ... | ... | ... | ... | ... | ... | ... | ... | ... | ... | ... | ... | ... | ... | ... | ... | ... | ... | ... | ... | ... | ... | ... | ... | ... | ... | ... | ... | ... | ... | ... | ... | 3,706 | 3,046 | 3,979 | 25,504 | 28,121 | ||||||||||||
| Customer Deposits | TRY mil | 94,608 | 102,337 | 116,995 | 131,302 | 150,705 | |||||||||||||||||||||||||||||||||||||||||||||||||||||||
| Issued Debt Securities | TRY mil | ... | ... | ... | ... | ... | ... | ... | ... | ... | ... | ... | ... | ... | ... | ... | ... | ... | ... | ... | ... | ... | ... | ... | ... | ... | ... | ... | ... | ... | ... | ... | ... | ... | ... | ... | ... | ... | ... | ... | ... | ... | ... | ... | ... | 14,930 | 18,897 | 28,974 | 56,792 | 74,947 | |||||||||||
| ratios | |||||||||||||||||||||||||||||||||||||||||||||||||||||||||||||
| ROE | % | ... | ... | ... | ... | ... | ... | ... | ... | ... | ... | ... | ... | ... | ... | ... | ... | ... | ... | ... | ... | ... | ... | ... | ... | ... | ... | ... | ... | ... | ... | ... | ... | ... | ... | ... | ... | ... | ... | ... | ... | ... | ... | ... | 15.3 | 17.4 | 14.6 | 12.1 | 9.56 | ||||||||||||
| ROA | % | ... | ... | ... | ... | ... | ... | ... | ... | ... | ... | ... | ... | ... | ... | ... | ... | ... | ... | ... | ... | ... | ... | ... | ... | ... | ... | ... | ... | ... | ... | ... | ... | ... | ... | ... | ... | ... | ... | ... | ... | ... | ... | ... | 1.82 | 2.16 | 1.86 | 1.45 | 1.11 | ||||||||||||
| Costs (As % Of Assets) | % | ... | ... | ... | ... | ... | ... | ... | ... | ... | ... | ... | ... | ... | ... | ... | ... | ... | ... | ... | ... | ... | ... | ... | ... | ... | ... | ... | ... | ... | ... | ... | ... | ... | ... | ... | ... | ... | ... | ... | ... | ... | ... | ... | 2.37 | 3.03 | 2.80 | 3.91 | 3.74 | ||||||||||||
| Costs (As % Of Income) | % | ... | ... | ... | ... | ... | ... | ... | ... | ... | ... | ... | ... | ... | ... | ... | ... | ... | ... | ... | ... | ... | ... | ... | ... | ... | ... | ... | ... | ... | ... | ... | ... | ... | ... | ... | ... | ... | ... | ... | ... | ... | ... | ... | 42.6 | 53.4 | 53.9 | 59.2 | 62.1 | ||||||||||||
| Capital Adequacy Ratio | % | ... | ... | ... | ... | ... | ... | ... | ... | ... | ... | ... | ... | ... | ... | ... | ... | ... | ... | ... | ... | ... | ... | ... | ... | ... | ... | ... | ... | ... | ... | ... | ... | ... | ... | ... | ... | ... | ... | ... | ... | ... | ... | ... | ... | 14.1 | 16.3 | 14.4 | 16.0 | 15.1 | |||||||||||
| Net Interest Margin | % | ... | ... | ... | ... | ... | ... | ... | ... | ... | ... | ... | ... | ... | ... | ... | ... | ... | ... | ... | ... | ... | ... | ... | ... | ... | ... | ... | ... | ... | ... | ... | ... | ... | ... | ... | ... | ... | ... | ... | ... | ... | ... | ... | 3.11 | 3.54 | 3.47 | 3.48 | 3.38 | ||||||||||||
| Interest Income (As % Of Revenues) | % | ... | ... | ... | ... | ... | ... | ... | ... | ... | ... | ... | ... | ... | ... | ... | ... | ... | ... | ... | ... | ... | ... | ... | ... | ... | ... | ... | ... | ... | ... | ... | ... | ... | ... | ... | ... | ... | ... | ... | ... | ... | ... | ... | 55.9 | 62.5 | 66.9 | 52.8 | 56.2 | ||||||||||||
| Fee Income (As % Of Revenues) | % | ... | ... | ... | ... | ... | ... | ... | ... | ... | ... | ... | ... | ... | ... | ... | ... | ... | ... | ... | ... | ... | ... | ... | ... | ... | ... | ... | ... | ... | ... | ... | ... | ... | ... | ... | ... | ... | ... | ... | ... | ... | ... | ... | 17.5 | 18.0 | 19.4 | 9.37 | 9.96 | ||||||||||||
| Staff Cost (As % Of Total Cost) | % | ... | ... | ... | ... | ... | ... | ... | ... | ... | ... | ... | ... | ... | ... | ... | ... | ... | ... | ... | ... | ... | ... | ... | ... | ... | ... | ... | ... | ... | ... | ... | ... | ... | ... | ... | ... | ... | ... | ... | ... | ... | ... | ... | 52.3 | 35.8 | 42.4 | 31.1 | 27.9 | ||||||||||||
| Equity (As % Of Assets) | % | 11.1 | 13.7 | 12.0 | 11.9 | 11.3 | |||||||||||||||||||||||||||||||||||||||||||||||||||||||
| Loans (As % Of Deposits) | % | 96.8 | 104 | 115 | 127 | 127 | |||||||||||||||||||||||||||||||||||||||||||||||||||||||
| Loans (As % Assets) | % | 56.7 | 61.0 | 64.2 | 60.0 | 58.7 | |||||||||||||||||||||||||||||||||||||||||||||||||||||||
| NPLs (As % Of Loans) | % | ... | ... | ... | ... | ... | ... | ... | ... | ... | ... | ... | ... | ... | ... | ... | ... | ... | ... | ... | ... | ... | ... | ... | ... | ... | ... | ... | ... | ... | ... | ... | ... | ... | ... | ... | ... | ... | ... | ... | ... | ... | ... | ... | ... | 2.12 | 1.88 | 1.65 | 1.60 | 2.02 | |||||||||||
| Provisions (As % Of NPLs) | % | ... | ... | ... | ... | ... | ... | ... | ... | ... | ... | ... | ... | ... | ... | ... | ... | ... | ... | ... | ... | ... | ... | ... | ... | ... | ... | ... | ... | ... | ... | ... | ... | ... | ... | ... | ... | ... | ... | ... | ... | ... | ... | ... | ... | 100 | 78.9 | 80.4 | 74.3 | 73.8 | |||||||||||
| valuation | |||||||||||||||||||||||||||||||||||||||||||||||||||||||||||||
| Market Capitalisation (End Of Period) | USD mil | ... | ... | ... | ... | ... | ... | ... | ... | ... | ... | ... | ... | ... | ... | ... | ... | ... | ... | ... | ... | ... | ... | ... | ... | ... | ... | ... | ... | ... | ... | ... | ... | ... | ... | ... | ... | ... | ... | ... | ... | ... | ... | ... | ... | ... | ... | ... | ... | ... | ... | ... | ... | ... | ... | 39,222 | 23,599 | 30,621 | 17,783 | ||
| Number Of Shares (Average) | mil | ... | ... | ... | ... | ... | ... | ... | ... | ... | ... | ... | ... | ... | ... | ... | ... | ... | ... | ... | ... | ... | ... | ... | ... | ... | ... | ... | ... | ... | ... | ... | ... | ... | ... | ... | ... | ... | ... | ... | ... | ... | ... | ... | ... | ... | ... | ... | ... | ... | ... | ... | ... | ... | ... | 112,502 | 112,502 | 112,502 | 112,502 | ||
| Share Price (End Of Period) | TRY | ... | ... | ... | ... | ... | ... | ... | ... | ... | ... | ... | ... | ... | ... | ... | ... | ... | ... | ... | ... | ... | ... | ... | ... | ... | ... | ... | ... | ... | ... | ... | ... | ... | ... | ... | ... | ... | ... | ... | ... | ... | ... | ... | ... | ... | ... | ... | ... | ... | ... | ... | ... | 3.34 | 6.22 | 4.51 | 6.36 | 4.60 | |||
| Earnings Per Share (EPS) | TRY | ... | ... | ... | ... | ... | ... | ... | ... | ... | ... | ... | ... | ... | ... | ... | ... | ... | ... | ... | ... | ... | ... | ... | ... | ... | ... | ... | ... | ... | ... | ... | ... | ... | ... | ... | ... | ... | ... | ... | ... | ... | ... | ... | ... | ... | ... | ... | ... | ... | ... | ... | ... | ... | ... | 0.323 | 0.317 | 0.313 | 0.296 | ||
| Book Value Per Share | TRY | ... | ... | ... | ... | ... | ... | ... | ... | ... | ... | ... | ... | ... | ... | ... | ... | ... | ... | ... | ... | ... | ... | ... | ... | ... | ... | ... | ... | ... | ... | ... | ... | ... | ... | ... | ... | ... | ... | ... | ... | ... | ... | ... | ... | ... | ... | ... | ... | ... | ... | ... | ... | ... | ... | 2.11 | 2.23 | 2.93 | 3.26 | ||
| Dividend Per Share | ... | ... | ... | ... | ... | ... | ... | ... | ... | ... | ... | ... | ... | ... | ... | ... | ... | ... | ... | ... | ... | ... | ... | ... | ... | ... | ... | ... | ... | ... | ... | ... | ... | ... | ... | ... | ... | ... | ... | ... | ... | ... | ... | ... | ... | ... | ... | ... | ... | ... | ... | ... | ... | ... | ... | ... | 0.067 | 0.108 | ... | ||
| Price/Earnings (P/E) | ... | ... | ... | ... | ... | ... | ... | ... | ... | ... | ... | ... | ... | ... | ... | ... | ... | ... | ... | ... | ... | ... | ... | ... | ... | ... | ... | ... | ... | ... | ... | ... | ... | ... | ... | ... | ... | ... | ... | ... | ... | ... | ... | ... | ... | ... | ... | ... | ... | ... | ... | ... | ... | ... | 19.3 | 14.2 | 20.3 | 15.5 | |||
| Price/Book Value (P/BV) | ... | ... | ... | ... | ... | ... | ... | ... | ... | ... | ... | ... | ... | ... | ... | ... | ... | ... | ... | ... | ... | ... | ... | ... | ... | ... | ... | ... | ... | ... | ... | ... | ... | ... | ... | ... | ... | ... | ... | ... | ... | ... | ... | ... | ... | ... | ... | ... | ... | ... | ... | ... | ... | ... | 2.94 | 2.03 | 2.17 | 1.41 | |||
| Dividend Yield | % | ... | ... | ... | ... | ... | ... | ... | ... | ... | ... | ... | ... | ... | ... | ... | ... | ... | ... | ... | ... | ... | ... | ... | ... | ... | ... | ... | ... | ... | ... | ... | ... | ... | ... | ... | ... | ... | ... | ... | ... | ... | ... | ... | ... | ... | ... | ... | ... | ... | ... | ... | ... | ... | ... | ... | ... | 1.05 | 2.36 | ... | |
| Earnings Per Share Growth | % | ... | ... | ... | ... | ... | ... | ... | ... | ... | ... | ... | ... | ... | ... | ... | ... | ... | ... | ... | ... | ... | ... | ... | ... | ... | ... | ... | ... | ... | ... | ... | ... | ... | ... | ... | ... | ... | ... | ... | ... | ... | ... | ... | ... | ... | ... | ... | ... | ... | ... | ... | ... | ... | ... | ... | -1.82 | -1.18 | -5.48 | ||
| Book Value Per Share Growth | % | ... | ... | ... | ... | ... | ... | ... | ... | ... | ... | ... | ... | ... | ... | ... | ... | ... | ... | ... | ... | ... | ... | ... | ... | ... | ... | ... | ... | ... | ... | ... | ... | ... | ... | ... | ... | ... | ... | ... | ... | ... | ... | ... | ... | -0.438 | 30.3 | 5.31 | 31.8 | 11.1 |
| income statement | Unit | 1958 | 1959 | 1960 | 1961 | 1962 | 1963 | 1964 | 1965 | 1966 | 1967 | 1968 | 1969 | 1970 | 1971 | 1972 | 1973 | 1974 | 1975 | 1976 | 1977 | 1978 | 1979 | 1980 | 1981 | 1982 | 1983 | 1984 | 1985 | 1986 | 1987 | 1988 | 1989 | 1990 | 1991 | 1992 | 1993 | 1994 | 1995 | 1996 | 1997 | 1998 | 1999 | 2000 | 2001 | 2002 | 2003 | 2004 | 2005 | 2006 | 2007 | 2008 | 2009 | 2010 | 2011 | 2012 | 2013 | 2014 | 2015 | 2016 | 2017 |
| income statement | |||||||||||||||||||||||||||||||||||||||||||||||||||||||||||||
| Interest Income | TRY mil | ... | ... | ... | ... | ... | ... | ... | ... | ... | ... | ... | ... | ... | ... | ... | ... | ... | ... | ... | ... | ... | ... | ... | ... | ... | ... | ... | ... | ... | ... | ... | ... | ... | ... | ... | ... | ... | ... | ... | ... | ... | ... | ... | 10,898 | 13,406 | 13,455 | 17,753 | 21,407 | ||||||||||||
| Interest Cost | TRY mil | ... | ... | ... | ... | ... | ... | ... | ... | ... | ... | ... | ... | ... | ... | ... | ... | ... | ... | ... | ... | ... | ... | ... | ... | ... | ... | ... | ... | ... | ... | ... | ... | ... | ... | ... | ... | ... | ... | ... | ... | ... | ... | ... | 6,337 | 7,463 | 6,805 | 9,282 | 11,211 | ||||||||||||
| Net Interest Income | TRY mil | ... | ... | ... | ... | ... | ... | ... | ... | ... | ... | ... | ... | ... | ... | ... | ... | ... | ... | ... | ... | ... | ... | ... | ... | ... | ... | ... | ... | ... | ... | ... | ... | ... | ... | ... | ... | ... | ... | ... | ... | ... | ... | ... | 4,562 | 5,943 | 6,650 | 8,470 | 10,196 | ||||||||||||
| Net Fee Income | TRY mil | ... | ... | ... | ... | ... | ... | ... | ... | ... | ... | ... | ... | ... | ... | ... | ... | ... | ... | ... | ... | ... | ... | ... | ... | ... | ... | ... | ... | ... | ... | ... | ... | ... | ... | ... | ... | ... | ... | ... | ... | ... | ... | ... | 1,429 | 1,718 | 1,930 | 1,505 | 1,808 | ||||||||||||
| Other Income | TRY mil | ... | ... | ... | ... | ... | ... | ... | ... | ... | ... | ... | ... | ... | ... | ... | ... | ... | ... | ... | ... | ... | ... | ... | ... | ... | ... | ... | ... | ... | ... | ... | ... | ... | ... | ... | ... | ... | ... | ... | ... | ... | ... | ... | 2,173 | 1,856 | 1,359 | 6,081 | 6,141 | ||||||||||||
| Total Revenues | TRY mil | ... | ... | ... | ... | ... | ... | ... | ... | ... | ... | ... | ... | ... | ... | ... | ... | ... | ... | ... | ... | ... | ... | ... | ... | ... | ... | ... | ... | ... | ... | ... | ... | ... | ... | ... | ... | ... | ... | ... | ... | ... | ... | ... | 8,163 | 9,517 | 9,939 | 16,057 | 18,145 | ||||||||||||
| Staff Cost | TRY mil | ... | ... | ... | ... | ... | ... | ... | ... | ... | ... | ... | ... | ... | ... | ... | ... | ... | ... | ... | ... | ... | ... | ... | ... | ... | ... | ... | ... | ... | ... | ... | ... | ... | ... | ... | ... | ... | ... | ... | ... | ... | ... | ... | 1,819 | 1,821 | 2,276 | 2,953 | 3,139 | ||||||||||||
| Depreciation | TRY mil | ... | ... | ... | ... | ... | ... | ... | ... | ... | ... | ... | ... | ... | ... | ... | ... | ... | ... | ... | ... | ... | ... | ... | ... | ... | ... | ... | ... | ... | ... | ... | ... | ... | ... | ... | ... | ... | ... | ... | ... | ... | ... | ... | 165 | 178 | 202 | 389 | 454 | ||||||||||||
| Other Cost | TRY mil | ... | ... | ... | ... | ... | ... | ... | ... | ... | ... | ... | ... | ... | ... | ... | ... | ... | ... | ... | ... | ... | ... | ... | ... | ... | ... | ... | ... | ... | ... | ... | ... | ... | ... | ... | ... | ... | ... | ... | ... | ... | ... | ... | 1,496 | 3,084 | 2,883 | 6,157 | 7,672 | ||||||||||||
| Operating Cost | TRY mil | ... | ... | ... | ... | ... | ... | ... | ... | ... | ... | ... | ... | ... | ... | ... | ... | ... | ... | ... | ... | ... | ... | ... | ... | ... | ... | ... | ... | ... | ... | ... | ... | ... | ... | ... | ... | ... | ... | ... | ... | ... | ... | ... | 3,481 | 5,083 | 5,361 | 9,499 | 11,266 | ||||||||||||
| Operating Profit | TRY mil | ... | ... | ... | ... | ... | ... | ... | ... | ... | ... | ... | ... | ... | ... | ... | ... | ... | ... | ... | ... | ... | ... | ... | ... | ... | ... | ... | ... | ... | ... | ... | ... | ... | ... | ... | ... | ... | ... | ... | ... | ... | ... | ... | 4,682 | 4,433 | 4,579 | 6,557 | 6,880 | ||||||||||||
| Provisions | TRY mil | ... | ... | ... | ... | ... | ... | ... | ... | ... | ... | ... | ... | ... | ... | ... | ... | ... | ... | ... | ... | ... | ... | ... | ... | ... | ... | ... | ... | ... | ... | ... | ... | ... | ... | ... | ... | ... | ... | ... | ... | ... | ... | ... | 1,384 | -19.5 | 309 | 1,530 | 2,290 | ||||||||||||
| Extra and Other Cost | TRY mil | ... | ... | ... | ... | ... | ... | ... | ... | ... | ... | ... | ... | ... | ... | ... | ... | ... | ... | ... | ... | ... | ... | ... | ... | ... | ... | ... | ... | ... | ... | ... | ... | ... | ... | ... | ... | ... | ... | ... | ... | ... | ... | ... | 0 | 0 | 0 | 0 | 0 | ||||||||||||
| Pre-Tax Profit | TRY mil | ... | ... | ... | ... | ... | ... | ... | ... | ... | ... | ... | ... | ... | ... | ... | ... | ... | ... | ... | ... | ... | ... | ... | ... | ... | ... | ... | ... | ... | ... | ... | ... | ... | ... | ... | ... | ... | ... | ... | ... | ... | ... | ... | 3,298 | 4,453 | 4,270 | 5,027 | 4,590 | ||||||||||||
| Tax | TRY mil | ... | ... | ... | ... | ... | ... | ... | ... | ... | ... | ... | ... | ... | ... | ... | ... | ... | ... | ... | ... | ... | ... | ... | ... | ... | ... | ... | ... | ... | ... | ... | ... | ... | ... | ... | ... | ... | ... | ... | ... | ... | ... | ... | 631 | 821 | 704 | 1,007 | 850 | ||||||||||||
| Minorities | TRY mil | ... | ... | ... | ... | ... | ... | ... | ... | ... | ... | ... | ... | ... | ... | ... | ... | ... | ... | ... | ... | ... | ... | ... | ... | ... | ... | ... | ... | ... | ... | ... | ... | ... | ... | ... | ... | ... | ... | ... | ... | ... | ... | ... | 0 | 0 | 0 | 497 | 409 | ||||||||||||
| Net Profit | TRY mil | ... | ... | ... | ... | ... | ... | ... | ... | ... | ... | ... | ... | ... | ... | ... | ... | ... | ... | ... | ... | ... | ... | ... | ... | ... | ... | ... | ... | ... | ... | ... | ... | ... | ... | ... | ... | ... | ... | ... | ... | ... | ... | ... | 2,667 | 3,632 | 3,566 | 3,524 | 3,331 | ||||||||||||
| Dividends | TRY mil | ... | ... | ... | ... | ... | ... | ... | ... | ... | ... | ... | ... | ... | ... | ... | ... | ... | ... | ... | ... | ... | ... | ... | ... | ... | ... | ... | ... | ... | ... | ... | ... | ... | ... | ... | ... | ... | ... | ... | ... | ... | ... | ... | ... | ... | ... | ... | ... | ... | ... | ... | ... | ... | ... | ... | ... | 751 | 1,219 | ... | |
| growth rates | |||||||||||||||||||||||||||||||||||||||||||||||||||||||||||||
| Net Interest Income Growth | % | ... | ... | ... | ... | ... | ... | ... | ... | ... | ... | ... | ... | ... | ... | ... | ... | ... | ... | ... | ... | ... | ... | ... | ... | ... | ... | ... | ... | ... | ... | ... | ... | ... | ... | ... | ... | ... | ... | ... | ... | ... | ... | ... | ... | -0.438 | 30.3 | 11.9 | 27.4 | 20.4 | |||||||||||
| Net Fee Income Growth | % | ... | ... | ... | ... | ... | ... | ... | ... | ... | ... | ... | ... | ... | ... | ... | ... | ... | ... | ... | ... | ... | ... | ... | ... | ... | ... | ... | ... | ... | ... | ... | ... | ... | ... | ... | ... | ... | ... | ... | ... | ... | ... | ... | ... | 15.5 | 20.2 | 12.3 | -22.0 | 20.1 | |||||||||||
| Total Revenue Growth | % | ... | ... | ... | ... | ... | ... | ... | ... | ... | ... | ... | ... | ... | ... | ... | ... | ... | ... | ... | ... | ... | ... | ... | ... | ... | ... | ... | ... | ... | ... | ... | ... | ... | ... | ... | ... | ... | ... | ... | ... | ... | ... | ... | ... | 3.44 | 16.6 | 4.44 | 61.5 | 13.0 | |||||||||||
| Operating Cost Growth | % | ... | ... | ... | ... | ... | ... | ... | ... | ... | ... | ... | ... | ... | ... | ... | ... | ... | ... | ... | ... | ... | ... | ... | ... | ... | ... | ... | ... | ... | ... | ... | ... | ... | ... | ... | ... | ... | ... | ... | ... | ... | ... | ... | ... | 8.68 | 46.0 | 5.46 | 77.2 | 18.6 | |||||||||||
| Operating Profit Growth | % | ... | ... | ... | ... | ... | ... | ... | ... | ... | ... | ... | ... | ... | ... | ... | ... | ... | ... | ... | ... | ... | ... | ... | ... | ... | ... | ... | ... | ... | ... | ... | ... | ... | ... | ... | ... | ... | ... | ... | ... | ... | ... | ... | ... | -0.133 | -5.31 | 3.27 | 43.2 | 4.92 | |||||||||||
| Pre-Tax Profit Growth | % | ... | ... | ... | ... | ... | ... | ... | ... | ... | ... | ... | ... | ... | ... | ... | ... | ... | ... | ... | ... | ... | ... | ... | ... | ... | ... | ... | ... | ... | ... | ... | ... | ... | ... | ... | ... | ... | ... | ... | ... | ... | ... | ... | ... | -7.17 | 35.0 | -4.11 | 17.7 | -8.70 | |||||||||||
| Net Profit Growth | % | ... | ... | ... | ... | ... | ... | ... | ... | ... | ... | ... | ... | ... | ... | ... | ... | ... | ... | ... | ... | ... | ... | ... | ... | ... | ... | ... | ... | ... | ... | ... | ... | ... | ... | ... | ... | ... | ... | ... | ... | ... | ... | ... | ... | -10.6 | 36.1 | -1.82 | -1.18 | -5.48 | |||||||||||
| market share | |||||||||||||||||||||||||||||||||||||||||||||||||||||||||||||
| Market Share in Revenues | % | ... | ... | ... | ... | ... | ... | ... | ... | ... | ... | ... | ... | ... | ... | ... | ... | ... | ... | ... | ... | ... | ... | ... | ... | ... | ... | ... | ... | ... | ... | ... | ... | ... | ... | ... | ... | ... | ... | ... | ... | ... | ... | ... | 13.9 | 13.1 | 12.3 | 18.0 | 18.3 | ... | |||||||||||
| Market Share in Net Profit | % | ... | ... | ... | ... | ... | ... | ... | ... | ... | ... | ... | ... | ... | ... | ... | ... | ... | ... | ... | ... | ... | ... | ... | ... | ... | ... | ... | ... | ... | ... | ... | ... | ... | ... | ... | ... | ... | ... | ... | ... | ... | ... | ... | ... | 14.0 | 16.1 | 15.1 | 14.4 | 13.0 | ... | ||||||||||
| Market Share in Employees | % | ... | ... | ... | 13.7 | 13.1 | 12.2 | 12.5 | 12.5 | ||||||||||||||||||||||||||||||||||||||||||||||||||||
| Market Share in Bank Cards | % | ... | ... | ... | ... | ... | ... | ... | ... | ... | ... | ... | ... | ... | ... | ... | ... | ... | ... | ... | ... | ... | ... | ... | ... | ... | ... | ... | ... | ... | ... | ... | ... | ... | ... | ... | ... | ... | ... | ... | ... | ... | ... | ... | ... | ... | ... | ... | ... | ... | ... | ... | ... | ... | ... | ... | ... | ... | 9.62 | ... | |
| Market Share in Debit Cards | % | ... | ... | ... | ... | ... | ... | ... | ... | ... | ... | ... | ... | ... | ... | ... | ... | ... | ... | ... | ... | ... | ... | ... | ... | ... | ... | ... | ... | ... | ... | ... | ... | ... | ... | ... | ... | ... | ... | ... | ... | ... | ... | ... | ... | ... | ... | ... | ... | ... | ... | ... | ... | ... | ... | ... | ... | ... | 8.57 | ... | |
| Market Share in Credit Cards | % | ... | ... | ... | ... | ... | ... | ... | ... | ... | ... | ... | ... | ... | ... | ... | ... | ... | ... | ... | ... | ... | ... | ... | ... | ... | ... | ... | ... | ... | ... | ... | ... | ... | ... | ... | ... | ... | ... | ... | ... | ... | ... | ... | ... | ... | ... | ... | ... | ... | ... | ... | ... | ... | ... | ... | 10.5 | 11.5 | 11.6 | ... | |
| Market Share in Branches | % | ... | ... | ... | 12.2 | 12.2 | 11.9 | 11.9 | 12.3 |
| balance sheet | Unit | 1958 | 1959 | 1960 | 1961 | 1962 | 1963 | 1964 | 1965 | 1966 | 1967 | 1968 | 1969 | 1970 | 1971 | 1972 | 1973 | 1974 | 1975 | 1976 | 1977 | 1978 | 1979 | 1980 | 1981 | 1982 | 1983 | 1984 | 1985 | 1986 | 1987 | 1988 | 1989 | 1990 | 1991 | 1992 | 1993 | 1994 | 1995 | 1996 | 1997 | 1998 | 1999 | 2000 | 2001 | 2002 | 2003 | 2004 | 2005 | 2006 | 2007 | 2008 | 2009 | 2010 | 2011 | 2012 | 2013 | 2014 | 2015 | 2016 | 2017 |
| balance sheet | |||||||||||||||||||||||||||||||||||||||||||||||||||||||||||||
| Cash | TRY mil | ... | ... | ... | ... | ... | ... | ... | ... | ... | ... | ... | ... | ... | ... | ... | ... | ... | ... | ... | ... | ... | ... | ... | ... | ... | ... | ... | ... | ... | ... | ... | ... | ... | ... | ... | ... | ... | ... | ... | ... | ... | ... | ... | 13,737 | 1,658 | 2,152 | 25,144 | 32,490 | ||||||||||||
| Interbank Loans | TRY mil | ... | ... | ... | ... | ... | ... | ... | ... | ... | ... | ... | ... | ... | ... | ... | ... | ... | ... | ... | ... | ... | ... | ... | ... | ... | ... | ... | ... | ... | ... | ... | ... | ... | ... | ... | ... | ... | ... | ... | ... | ... | ... | ... | ... | ... | 2,297 | 15,634 | 22,335 | 6,270 | 7,684 | ||||||||||
| Customer Loans | TRY mil | 91,621 | 106,081 | 134,163 | 166,323 | 191,046 | |||||||||||||||||||||||||||||||||||||||||||||||||||||||
| Retail Loans | TRY mil | ... | ... | ... | ... | ... | ... | ... | ... | ... | ... | ... | ... | ... | ... | ... | ... | ... | ... | ... | ... | ... | ... | ... | ... | ... | ... | ... | ... | ... | ... | ... | ... | ... | ... | ... | ... | ... | ... | ... | ... | ... | ... | ... | ... | 19,240 | 30,339 | 38,236 | 44,050 | 52,291 | |||||||||||
| Mortgage Loans | TRY mil | ... | ... | ... | ... | ... | ... | ... | ... | ... | ... | ... | ... | ... | ... | ... | ... | ... | ... | ... | ... | ... | ... | ... | ... | ... | ... | ... | ... | ... | ... | ... | ... | ... | ... | ... | ... | ... | ... | ... | ... | ... | ... | ... | ... | ... | ... | ... | ... | ... | ... | ... | ... | ... | ... | ... | ... | 14,608 | 15,726 | ||
| Consumer Loans | TRY mil | ... | ... | ... | ... | ... | ... | ... | ... | ... | ... | ... | ... | ... | ... | ... | ... | ... | ... | ... | ... | ... | ... | ... | ... | ... | ... | ... | ... | ... | ... | ... | ... | ... | ... | ... | ... | ... | ... | ... | ... | ... | ... | ... | ... | ... | ... | ... | ... | ... | ... | ... | ... | ... | ... | ... | ... | 29,442 | 36,565 | ||
| Corporate Loans | TRY mil | ... | ... | ... | ... | ... | ... | ... | ... | ... | ... | ... | ... | ... | ... | ... | ... | ... | ... | ... | ... | ... | ... | ... | ... | ... | ... | ... | ... | ... | ... | ... | ... | ... | ... | ... | ... | ... | ... | ... | ... | ... | ... | ... | ... | 45,810 | 45,933 | 59,434 | 108,877 | 126,104 | |||||||||||
| Debt Securities | TRY mil | ... | ... | ... | ... | ... | ... | ... | ... | ... | ... | ... | ... | ... | ... | ... | ... | ... | ... | ... | ... | ... | ... | ... | ... | ... | ... | ... | ... | ... | ... | ... | ... | ... | ... | ... | ... | ... | ... | ... | ... | ... | ... | ... | 50,029 | 47,177 | 46,667 | 49,329 | 54,010 | ||||||||||||
| Fixed Assets | TRY mil | ... | ... | ... | ... | ... | ... | ... | ... | ... | ... | ... | ... | ... | ... | ... | ... | ... | ... | ... | ... | ... | ... | ... | ... | ... | ... | ... | ... | ... | ... | ... | ... | ... | ... | ... | ... | ... | ... | ... | ... | ... | ... | ... | 1,924 | 1,926 | 2,028 | 2,765 | 6,375 | ||||||||||||
| Total Assets | TRY mil | 161,668 | 173,841 | 209,047 | 277,073 | 325,499 | |||||||||||||||||||||||||||||||||||||||||||||||||||||||
| Shareholders' Equity | TRY mil | 17,921 | 23,787 | 25,049 | 33,005 | 36,684 | |||||||||||||||||||||||||||||||||||||||||||||||||||||||
| Of Which Minority Interest | TRY mil | ... | ... | ... | ... | ... | ... | ... | ... | ... | ... | ... | ... | ... | ... | ... | ... | ... | ... | ... | ... | ... | ... | ... | ... | ... | ... | ... | ... | ... | ... | ... | ... | ... | ... | ... | ... | ... | ... | ... | ... | ... | ... | ... | 0 | 0 | 0 | 4,086 | 4,561 | ||||||||||||
| Liabilities | TRY mil | 143,747 | 150,054 | 183,999 | 244,069 | 288,815 | |||||||||||||||||||||||||||||||||||||||||||||||||||||||
| Interbank Borrowing | TRY mil | ... | ... | ... | ... | ... | ... | ... | ... | ... | ... | ... | ... | ... | ... | ... | ... | ... | ... | ... | ... | ... | ... | ... | ... | ... | ... | ... | ... | ... | ... | ... | ... | ... | ... | ... | ... | ... | ... | ... | ... | ... | ... | ... | 3,706 | 3,046 | 3,979 | 25,504 | 28,121 | ||||||||||||
| Customer Deposits | TRY mil | 94,608 | 102,337 | 116,995 | 131,302 | 150,705 | |||||||||||||||||||||||||||||||||||||||||||||||||||||||
| Retail Deposits | TRY mil | ... | ... | ... | ... | ... | ... | ... | ... | ... | ... | ... | ... | ... | ... | ... | ... | ... | ... | ... | ... | ... | ... | ... | ... | ... | ... | ... | ... | ... | ... | ... | ... | ... | ... | ... | ... | ... | ... | ... | ... | ... | ... | ... | 40,664 | 41,453 | 45,374 | 105,949 | 126,634 | ... | ... | ||||||||||
| Corporate Deposits | TRY mil | ... | ... | ... | ... | ... | ... | ... | ... | ... | ... | ... | ... | ... | ... | ... | ... | ... | ... | ... | ... | ... | ... | ... | ... | ... | ... | ... | ... | ... | ... | ... | ... | ... | ... | ... | ... | ... | ... | ... | ... | ... | ... | ... | 11,678 | 14,200 | 15,269 | 13,642 | 14,081 | ... | ... | ||||||||||
| Issued Debt Securities | TRY mil | ... | ... | ... | ... | ... | ... | ... | ... | ... | ... | ... | ... | ... | ... | ... | ... | ... | ... | ... | ... | ... | ... | ... | ... | ... | ... | ... | ... | ... | ... | ... | ... | ... | ... | ... | ... | ... | ... | ... | ... | ... | ... | ... | ... | 14,930 | 18,897 | 28,974 | 56,792 | 74,947 | |||||||||||
| Other Liabilities | TRY mil | ... | ... | ... | ... | ... | ... | ... | ... | ... | ... | ... | ... | ... | ... | ... | ... | ... | ... | ... | ... | ... | ... | ... | ... | ... | ... | ... | ... | ... | ... | ... | ... | ... | ... | ... | ... | ... | ... | ... | ... | ... | ... | ... | ... | 30,504 | 25,774 | 34,050 | 30,471 | 35,043 | |||||||||||
| asset quality | |||||||||||||||||||||||||||||||||||||||||||||||||||||||||||||
| Non-Performing Loans | TRY mil | ... | ... | ... | ... | ... | ... | ... | ... | ... | ... | ... | ... | ... | ... | ... | ... | ... | ... | ... | ... | ... | ... | ... | ... | ... | ... | ... | ... | ... | ... | ... | ... | ... | ... | ... | ... | ... | ... | ... | ... | ... | ... | ... | ... | 1,984 | 2,025 | 2,238 | 2,700 | 3,920 | |||||||||||
| Gross Loans | TRY mil | ... | ... | ... | ... | ... | ... | ... | ... | ... | ... | ... | ... | ... | ... | ... | ... | ... | ... | ... | ... | ... | ... | ... | ... | ... | ... | ... | ... | ... | ... | ... | ... | ... | ... | ... | ... | ... | ... | ... | ... | ... | ... | ... | ... | 93,605 | 107,680 | 135,963 | 168,328 | 193,938 | |||||||||||
| Total Provisions | TRY mil | ... | ... | ... | ... | ... | ... | ... | ... | ... | ... | ... | ... | ... | ... | ... | ... | ... | ... | ... | ... | ... | ... | ... | ... | ... | ... | ... | ... | ... | ... | ... | ... | ... | ... | ... | ... | ... | ... | ... | ... | ... | ... | ... | ... | 1,984 | 1,599 | 1,800 | 2,005 | 2,892 | |||||||||||
| growth rates | |||||||||||||||||||||||||||||||||||||||||||||||||||||||||||||
| Customer Loan Growth | % | ... | 42.6 | 15.8 | 26.5 | 24.0 | 14.9 | ||||||||||||||||||||||||||||||||||||||||||||||||||||||
| Retail Loan Growth | % | ... | ... | ... | ... | ... | ... | ... | ... | ... | ... | ... | ... | ... | ... | ... | ... | ... | ... | ... | ... | ... | ... | ... | ... | ... | ... | ... | ... | ... | ... | ... | ... | ... | ... | ... | ... | ... | ... | ... | ... | ... | ... | ... | ... | ... | 36.2 | 57.7 | 26.0 | 15.2 | 18.7 | ||||||||||
| Mortgage Loan Growth | % | ... | ... | ... | ... | ... | ... | ... | ... | ... | ... | ... | ... | ... | ... | ... | ... | ... | ... | ... | ... | ... | ... | ... | ... | ... | ... | ... | ... | ... | ... | ... | ... | ... | ... | ... | ... | ... | ... | ... | ... | ... | ... | ... | ... | ... | ... | ... | ... | ... | ... | ... | ... | ... | ... | ... | ... | ... | 7.65 | ||
| Consumer Loan Growth | % | ... | ... | ... | ... | ... | ... | ... | ... | ... | ... | ... | ... | ... | ... | ... | ... | ... | ... | ... | ... | ... | ... | ... | ... | ... | ... | ... | ... | ... | ... | ... | ... | ... | ... | ... | ... | ... | ... | ... | ... | ... | ... | ... | ... | ... | ... | ... | ... | ... | ... | ... | ... | ... | ... | ... | ... | ... | 24.2 | ||
| Corporate Loan Growth | % | ... | ... | ... | ... | ... | ... | ... | ... | ... | ... | ... | ... | ... | ... | ... | ... | ... | ... | ... | ... | ... | ... | ... | ... | ... | ... | ... | ... | ... | ... | ... | ... | ... | ... | ... | ... | ... | ... | ... | ... | ... | ... | ... | ... | ... | 51.7 | 0.268 | 29.4 | 83.2 | 15.8 | ||||||||||
| Total Asset Growth | % | ... | 22.7 | 7.53 | 20.3 | 32.5 | 17.5 | ||||||||||||||||||||||||||||||||||||||||||||||||||||||
| Shareholders' Equity Growth | % | ... | 5.33 | 32.7 | 5.31 | 31.8 | 11.1 | ||||||||||||||||||||||||||||||||||||||||||||||||||||||
| Customer Deposit Growth | % | ... | 11.5 | 8.17 | 14.3 | 12.2 | 14.8 | ||||||||||||||||||||||||||||||||||||||||||||||||||||||
| Retail Deposit Growth | % | ... | ... | ... | ... | ... | ... | ... | ... | ... | ... | ... | ... | ... | ... | ... | ... | ... | ... | ... | ... | ... | ... | ... | ... | ... | ... | ... | ... | ... | ... | ... | ... | ... | ... | ... | ... | ... | ... | ... | ... | ... | ... | ... | ... | 6.24 | 1.94 | 9.46 | 133 | 19.5 | ... | ... | |||||||||
| Corporate Deposit Growth | % | ... | ... | ... | ... | ... | ... | ... | ... | ... | ... | ... | ... | ... | ... | ... | ... | ... | ... | ... | ... | ... | ... | ... | ... | ... | ... | ... | ... | ... | ... | ... | ... | ... | ... | ... | ... | ... | ... | ... | ... | ... | ... | ... | ... | -3.23 | 21.6 | 7.53 | -10.7 | 3.22 | ... | ... | |||||||||
| market share | |||||||||||||||||||||||||||||||||||||||||||||||||||||||||||||
| Market Share in Customer Loans | % | ... | ... | 14.4 | 14.5 | 13.8 | 14.5 | 13.8 | |||||||||||||||||||||||||||||||||||||||||||||||||||||
| Market Share in Corporate Loans | % | ... | ... | ... | ... | ... | ... | ... | ... | ... | ... | ... | ... | ... | ... | ... | ... | ... | ... | ... | ... | ... | ... | ... | ... | ... | ... | ... | ... | ... | ... | ... | ... | ... | ... | ... | ... | ... | ... | ... | ... | ... | ... | ... | ... | 11.2 | 9.96 | 9.66 | 14.1 | 12.7 | |||||||||||
| Market Share in Retail Loans | % | ... | ... | ... | ... | ... | ... | ... | ... | ... | ... | ... | ... | ... | ... | ... | ... | ... | ... | ... | ... | ... | ... | ... | ... | ... | ... | ... | ... | ... | ... | ... | ... | ... | ... | ... | ... | ... | ... | ... | ... | ... | ... | ... | ... | ... | ... | ... | ... | ... | ... | ... | ... | ... | ... | ... | ... | 11.8 | 14.8 | ||
| Market Share in Consumer Loans | % | ... | ... | ... | ... | ... | ... | ... | ... | ... | ... | ... | ... | ... | ... | ... | ... | ... | ... | ... | ... | ... | ... | ... | ... | ... | ... | ... | ... | ... | ... | ... | ... | ... | ... | ... | ... | ... | ... | ... | ... | ... | ... | ... | ... | 8.42 | 11.2 | 10.8 | 11.7 | 13.4 | |||||||||||
| Market Share in Mortgage Loans | % | ... | ... | ... | ... | ... | ... | ... | ... | ... | ... | ... | ... | ... | ... | ... | ... | ... | ... | ... | ... | ... | ... | ... | ... | ... | ... | ... | ... | ... | ... | ... | ... | ... | ... | ... | ... | ... | ... | ... | ... | ... | ... | ... | ... | ... | ... | ... | ... | ... | ... | ... | ... | ... | ... | ... | ... | 11.6 | 10.9 | ||
| Market Share in Total Assets | % | ... | 13.9 | 13.4 | 12.8 | 14.7 | 14.6 | ||||||||||||||||||||||||||||||||||||||||||||||||||||||
| Market Share in Customer Deposits | % | ... | ... | 14.4 | 14.1 | 13.1 | 13.2 | 12.9 | |||||||||||||||||||||||||||||||||||||||||||||||||||||
| Market Share in Retail Deposits | % | ... | ... | ... | ... | ... | ... | ... | ... | ... | ... | ... | ... | ... | ... | ... | ... | ... | ... | ... | ... | ... | ... | ... | ... | ... | ... | ... | ... | ... | ... | ... | ... | ... | ... | ... | ... | ... | ... | ... | ... | ... | ... | ... | ... | ... | 10.4 | 9.62 | 8.91 | 18.3 | 18.3 | ... | ... | ||||||||
| Market Share in Corporate Deposits | % | ... | ... | ... | ... | ... | ... | ... | ... | ... | ... | ... | ... | ... | ... | ... | ... | ... | ... | ... | ... | ... | ... | ... | ... | ... | ... | ... | ... | ... | ... | ... | ... | ... | ... | ... | ... | ... | ... | ... | ... | ... | ... | ... | ... | ... | 5.81 | 6.39 | 5.17 | 4.23 | 3.75 | ... | ... |
| ratios | Unit | 1958 | 1959 | 1960 | 1961 | 1962 | 1963 | 1964 | 1965 | 1966 | 1967 | 1968 | 1969 | 1970 | 1971 | 1972 | 1973 | 1974 | 1975 | 1976 | 1977 | 1978 | 1979 | 1980 | 1981 | 1982 | 1983 | 1984 | 1985 | 1986 | 1987 | 1988 | 1989 | 1990 | 1991 | 1992 | 1993 | 1994 | 1995 | 1996 | 1997 | 1998 | 1999 | 2000 | 2001 | 2002 | 2003 | 2004 | 2005 | 2006 | 2007 | 2008 | 2009 | 2010 | 2011 | 2012 | 2013 | 2014 | 2015 | 2016 | 2017 |
| ratios | |||||||||||||||||||||||||||||||||||||||||||||||||||||||||||||
| ROE | % | ... | ... | ... | ... | ... | ... | ... | ... | ... | ... | ... | ... | ... | ... | ... | ... | ... | ... | ... | ... | ... | ... | ... | ... | ... | ... | ... | ... | ... | ... | ... | ... | ... | ... | ... | ... | ... | ... | ... | ... | ... | ... | ... | 15.3 | 17.4 | 14.6 | 12.1 | 9.56 | ||||||||||||
| ROA | % | ... | ... | ... | ... | ... | ... | ... | ... | ... | ... | ... | ... | ... | ... | ... | ... | ... | ... | ... | ... | ... | ... | ... | ... | ... | ... | ... | ... | ... | ... | ... | ... | ... | ... | ... | ... | ... | ... | ... | ... | ... | ... | ... | 1.82 | 2.16 | 1.86 | 1.45 | 1.11 | ||||||||||||
| Costs (As % Of Assets) | % | ... | ... | ... | ... | ... | ... | ... | ... | ... | ... | ... | ... | ... | ... | ... | ... | ... | ... | ... | ... | ... | ... | ... | ... | ... | ... | ... | ... | ... | ... | ... | ... | ... | ... | ... | ... | ... | ... | ... | ... | ... | ... | ... | 2.37 | 3.03 | 2.80 | 3.91 | 3.74 | ||||||||||||
| Costs (As % Of Income) | % | ... | ... | ... | ... | ... | ... | ... | ... | ... | ... | ... | ... | ... | ... | ... | ... | ... | ... | ... | ... | ... | ... | ... | ... | ... | ... | ... | ... | ... | ... | ... | ... | ... | ... | ... | ... | ... | ... | ... | ... | ... | ... | ... | 42.6 | 53.4 | 53.9 | 59.2 | 62.1 | ||||||||||||
| Capital Adequacy Ratio | % | ... | ... | ... | ... | ... | ... | ... | ... | ... | ... | ... | ... | ... | ... | ... | ... | ... | ... | ... | ... | ... | ... | ... | ... | ... | ... | ... | ... | ... | ... | ... | ... | ... | ... | ... | ... | ... | ... | ... | ... | ... | ... | ... | ... | 14.1 | 16.3 | 14.4 | 16.0 | 15.1 | |||||||||||
| Tier 1 Ratio | % | ... | ... | ... | ... | ... | ... | ... | ... | ... | ... | ... | ... | ... | ... | ... | ... | ... | ... | ... | ... | ... | ... | ... | ... | ... | ... | ... | ... | ... | ... | ... | ... | ... | ... | ... | ... | ... | ... | ... | ... | ... | ... | ... | ... | ... | ... | ... | ... | ... | ... | ... | ... | ... | ... | ... | ... | ... | 12.9 | ||
| Net Interest Margin | % | ... | ... | ... | ... | ... | ... | ... | ... | ... | ... | ... | ... | ... | ... | ... | ... | ... | ... | ... | ... | ... | ... | ... | ... | ... | ... | ... | ... | ... | ... | ... | ... | ... | ... | ... | ... | ... | ... | ... | ... | ... | ... | ... | 3.11 | 3.54 | 3.47 | 3.48 | 3.38 | ||||||||||||
| Interest Spread | % | ... | ... | ... | ... | ... | ... | ... | ... | ... | ... | ... | ... | ... | ... | ... | ... | ... | ... | ... | ... | ... | ... | ... | ... | ... | ... | ... | ... | ... | ... | ... | ... | ... | ... | ... | ... | ... | ... | ... | ... | ... | ... | ... | 2.53 | 2.91 | 2.95 | 2.97 | 2.90 | ||||||||||||
| Asset Yield | % | ... | ... | ... | ... | ... | ... | ... | ... | ... | ... | ... | ... | ... | ... | ... | ... | ... | ... | ... | ... | ... | ... | ... | ... | ... | ... | ... | ... | ... | ... | ... | ... | ... | ... | ... | ... | ... | ... | ... | ... | ... | ... | ... | 7.43 | 7.99 | 7.03 | 7.30 | 7.11 | ||||||||||||
| Cost Of Liabilities | % | ... | ... | ... | ... | ... | ... | ... | ... | ... | ... | ... | ... | ... | ... | ... | ... | ... | ... | ... | ... | ... | ... | ... | ... | ... | ... | ... | ... | ... | ... | ... | ... | ... | ... | ... | ... | ... | ... | ... | ... | ... | ... | ... | 4.90 | 5.08 | 4.07 | 4.34 | 4.21 | ||||||||||||
| Payout Ratio | % | ... | ... | ... | ... | ... | ... | ... | ... | ... | ... | ... | ... | ... | ... | ... | ... | ... | ... | ... | ... | ... | ... | ... | ... | ... | ... | ... | ... | ... | ... | ... | ... | ... | ... | ... | ... | ... | ... | ... | ... | ... | ... | ... | ... | ... | ... | ... | ... | ... | ... | ... | ... | ... | ... | ... | ... | 21.3 | 36.6 | ... | |
| Interest Income (As % Of Revenues) | % | ... | ... | ... | ... | ... | ... | ... | ... | ... | ... | ... | ... | ... | ... | ... | ... | ... | ... | ... | ... | ... | ... | ... | ... | ... | ... | ... | ... | ... | ... | ... | ... | ... | ... | ... | ... | ... | ... | ... | ... | ... | ... | ... | 55.9 | 62.5 | 66.9 | 52.8 | 56.2 | ||||||||||||
| Fee Income (As % Of Revenues) | % | ... | ... | ... | ... | ... | ... | ... | ... | ... | ... | ... | ... | ... | ... | ... | ... | ... | ... | ... | ... | ... | ... | ... | ... | ... | ... | ... | ... | ... | ... | ... | ... | ... | ... | ... | ... | ... | ... | ... | ... | ... | ... | ... | 17.5 | 18.0 | 19.4 | 9.37 | 9.96 | ||||||||||||
| Other Income (As % Of Revenues) | % | ... | ... | ... | ... | ... | ... | ... | ... | ... | ... | ... | ... | ... | ... | ... | ... | ... | ... | ... | ... | ... | ... | ... | ... | ... | ... | ... | ... | ... | ... | ... | ... | ... | ... | ... | ... | ... | ... | ... | ... | ... | ... | ... | 26.6 | 19.5 | 13.7 | 37.9 | 33.8 | ||||||||||||
| Cost Per Employee | USD per month | ... | ... | ... | ... | ... | ... | ... | ... | ... | ... | ... | ... | ... | ... | ... | ... | ... | ... | ... | ... | ... | ... | ... | ... | ... | ... | ... | ... | ... | ... | ... | ... | ... | ... | ... | ... | ... | ... | ... | ... | ... | ... | ... | 3,625 | 3,454 | 4,121 | 4,370 | 3,964 | ||||||||||||
| Cost Per Employee (Local Currency) | TRY per month | ... | ... | ... | ... | ... | ... | ... | ... | ... | ... | ... | ... | ... | ... | ... | ... | ... | ... | ... | ... | ... | ... | ... | ... | ... | ... | ... | ... | ... | ... | ... | ... | ... | ... | ... | ... | ... | ... | ... | ... | ... | ... | ... | 6,092 | 6,217 | 7,859 | 9,804 | 10,398 | ||||||||||||
| Staff Cost (As % Of Total Cost) | % | ... | ... | ... | ... | ... | ... | ... | ... | ... | ... | ... | ... | ... | ... | ... | ... | ... | ... | ... | ... | ... | ... | ... | ... | ... | ... | ... | ... | ... | ... | ... | ... | ... | ... | ... | ... | ... | ... | ... | ... | ... | ... | ... | 52.3 | 35.8 | 42.4 | 31.1 | 27.9 | ||||||||||||
| Equity (As % Of Assets) | % | 11.1 | 13.7 | 12.0 | 11.9 | 11.3 | |||||||||||||||||||||||||||||||||||||||||||||||||||||||
| Loans (As % Of Deposits) | % | 96.8 | 104 | 115 | 127 | 127 | |||||||||||||||||||||||||||||||||||||||||||||||||||||||
| Loans (As % Assets) | % | 56.7 | 61.0 | 64.2 | 60.0 | 58.7 | |||||||||||||||||||||||||||||||||||||||||||||||||||||||
| NPLs (As % Of Loans) | % | ... | ... | ... | ... | ... | ... | ... | ... | ... | ... | ... | ... | ... | ... | ... | ... | ... | ... | ... | ... | ... | ... | ... | ... | ... | ... | ... | ... | ... | ... | ... | ... | ... | ... | ... | ... | ... | ... | ... | ... | ... | ... | ... | ... | 2.12 | 1.88 | 1.65 | 1.60 | 2.02 | |||||||||||
| Provisions (As % Of NPLs) | % | ... | ... | ... | ... | ... | ... | ... | ... | ... | ... | ... | ... | ... | ... | ... | ... | ... | ... | ... | ... | ... | ... | ... | ... | ... | ... | ... | ... | ... | ... | ... | ... | ... | ... | ... | ... | ... | ... | ... | ... | ... | ... | ... | ... | 100 | 78.9 | 80.4 | 74.3 | 73.8 | |||||||||||
| Provisions (As % Of Loans) | % | ... | ... | ... | ... | ... | ... | ... | ... | ... | ... | ... | ... | ... | ... | ... | ... | ... | ... | ... | ... | ... | ... | ... | ... | ... | ... | ... | ... | ... | ... | ... | ... | ... | ... | ... | ... | ... | ... | ... | ... | ... | ... | ... | ... | 2.17 | 1.51 | 1.34 | 1.21 | 1.51 | |||||||||||
| Cost of Provisions (As % Of Loans) | % | ... | ... | ... | ... | ... | ... | ... | ... | ... | ... | ... | ... | ... | ... | ... | ... | ... | ... | ... | ... | ... | ... | ... | ... | ... | ... | ... | ... | ... | ... | ... | ... | ... | ... | ... | ... | ... | ... | ... | ... | ... | ... | ... | 1.78 | -0.020 | 0.257 | 1.02 | 1.28 |
| other data | Unit | 1958 | 1959 | 1960 | 1961 | 1962 | 1963 | 1964 | 1965 | 1966 | 1967 | 1968 | 1969 | 1970 | 1971 | 1972 | 1973 | 1974 | 1975 | 1976 | 1977 | 1978 | 1979 | 1980 | 1981 | 1982 | 1983 | 1984 | 1985 | 1986 | 1987 | 1988 | 1989 | 1990 | 1991 | 1992 | 1993 | 1994 | 1995 | 1996 | 1997 | 1998 | 1999 | 2000 | 2001 | 2002 | 2003 | 2004 | 2005 | 2006 | 2007 | 2008 | 2009 | 2010 | 2011 | 2012 | 2013 | 2014 | 2015 | 2016 | 2017 |
| other data | |||||||||||||||||||||||||||||||||||||||||||||||||||||||||||||
| Branches | ... | ... | ... | 1,201 | 1,250 | 1,309 | 1,333 | 1,377 | |||||||||||||||||||||||||||||||||||||||||||||||||||||
| Employees | ... | ... | ... | 24,887 | 24,411 | 24,129 | 25,098 | 25,157 | |||||||||||||||||||||||||||||||||||||||||||||||||||||
| ATMs | ... | ... | ... | ... | ... | ... | ... | ... | ... | ... | ... | ... | ... | ... | ... | ... | ... | ... | ... | ... | ... | ... | ... | ... | ... | ... | ... | ... | ... | ... | ... | ... | ... | ... | ... | ... | ... | ... | ... | ... | ... | ... | ... | ... | ... | ... | ... | ... | 4,538 | 4,451 | 5,673 | 6,290 | 6,582 | ... | |||||||
| Clients | mil | ... | ... | ... | ... | ... | ... | ... | ... | ... | ... | ... | ... | ... | ... | ... | ... | ... | ... | ... | ... | ... | ... | ... | ... | ... | ... | ... | ... | ... | ... | ... | ... | ... | ... | ... | ... | ... | ... | ... | ... | ... | ... | ... | ... | ... | ... | ... | ... | ... | ... | ... | ... | ... | ... | ... | ... | 14.0 | ... | ... | ... |
| Payment Cards | '000 | ... | ... | ... | ... | ... | ... | ... | ... | ... | ... | ... | ... | ... | ... | ... | ... | ... | ... | ... | ... | ... | ... | ... | ... | ... | ... | ... | ... | ... | ... | ... | ... | ... | ... | ... | ... | ... | ... | ... | ... | ... | ... | ... | ... | ... | ... | ... | ... | ... | ... | ... | ... | ... | ... | ... | ... | ... | 16,414 | ... | |
| Debit Cards | '000 | ... | ... | ... | ... | ... | ... | ... | ... | ... | ... | ... | ... | ... | ... | ... | ... | ... | ... | ... | ... | ... | ... | ... | ... | ... | ... | ... | ... | ... | ... | ... | ... | ... | ... | ... | ... | ... | ... | ... | ... | ... | ... | ... | ... | ... | ... | ... | ... | ... | ... | ... | ... | ... | ... | ... | ... | ... | 9,633 | ... | |
| Credit Cards | '000 | ... | ... | ... | ... | ... | ... | ... | ... | ... | ... | ... | ... | ... | ... | ... | ... | ... | ... | ... | ... | ... | ... | ... | ... | ... | ... | ... | ... | ... | ... | ... | ... | ... | ... | ... | ... | ... | ... | ... | ... | ... | ... | ... | ... | 5,166 | 6,243 | 5,949 | 6,529 | 6,781 | ... |
Get all company financials in excel:


By Helgi Library - June 18, 2018
Isbank employed 24,836 persons in 2017, down 0.656% when compared to the previous year. Historically, the bank's workforce hit an all time high of 25,157 persons in 2015 and an all time low of 14,873 in 2002. Average cost reached USD 4,069 per month per employee,...
By Helgi Library - December 12, 2019
Isbank's corporate loans reached TRY 201,484 mil in 2017, up 25.5% compared to the previous year. Turkish banking sector provided corporate loans of TRY 1,571 bil in 2017, up 22.5% when compared to the last year. Isbank accounted for 13.5% of all corporat...
By Helgi Library - June 18, 2018
Isbank employed 24,836 persons in 2017, down 0% compared to the previous year. Historically, the bank's workforce hit an all time high of 25,157 persons in 2015 and an all time low of 18,729 in 2006. The bank operated a network of 1,364 branches and 6,557 ...
By Helgi Library - June 18, 2018
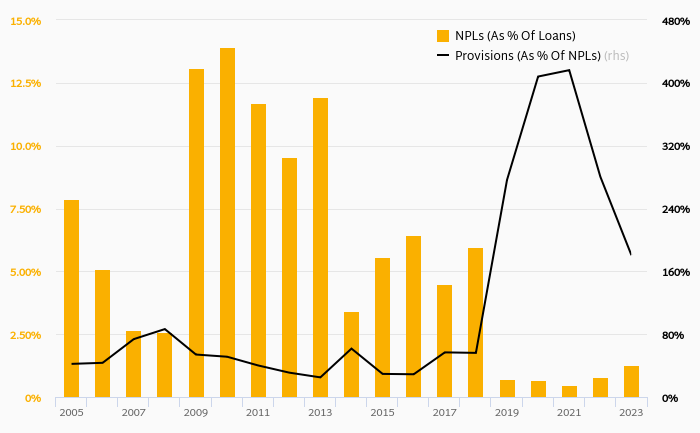
Isbank's non-performing loans reached 2.16% of total loans at the end of 2017, down from 2.34% compared to the previous year. Historically, the NPL ratio hit an all time high of 17.3% in 2002 and an all time low of 1.60% in 2014. Provision coverage amounted...
By Helgi Library - June 18, 2018
Isbank generated total banking revenues of TRY 23,321 mil in 2017, up 14.3% compared to the previous year. Historically, the bank’s revenues containing of interest, fee and other non-interest income reached an all time high of TRY 23,321 mil in 2017 and an all ...
By Helgi Library - June 18, 2018
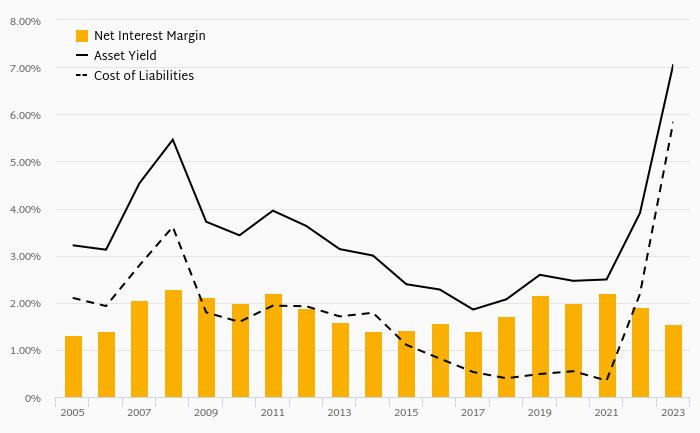
Isbank's net interest margin amounted to 3.70% in 2017, up from 3.53% compared to the previous year. Historically, the bank’s net interest margin reached an all time high of 10.8% in 2001 and an all time low of 3.11% in 2011. The average margin in the l...
By Helgi Library - June 18, 2018
Isbank stock traded at TRY 6.97 per share at the end 2017 implying a market capitalization of USD 20,731 mil. Since the end of 2012, the stock has appreciated by 12.1 % implying an annual average growth of 2.30 %. In absolute terms, the value of the company rose ...
By Helgi Library - June 18, 2018
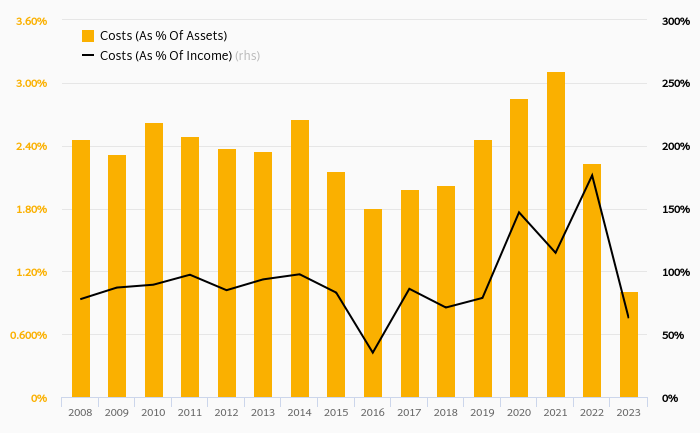
Isbank's cost to income ratio reached 54.7% in 2017, up from 50.8% compared to the previous year. Historically, the bank’s costs reached an all time high of 87.2% of income in 2001 and an all time low of 34.0% in 2009. When compared to total assets, bank's...
By Helgi Library - June 18, 2018
Isbank's customer loan growth reached 19.4% in 2017, down from 20.4% compared to the previous year. Historically, the bank’s loans growth reached an all time high of 127% in 1996 and an all time low of 1.52% in 2009. In the last decade, the average annual...
By Helgi Library - September 26, 2018
Isbank generated total banking revenues of TRY 20,400 mil in 2016, up 12.4% compared to the previous year. Turkish banking sector banking sector generated total revenues of TRY 121,108 mil in 2016, up 22.1% when compared to the last year. As a r...
Turkiye Is Bankasi AS (or Isbank) is the largest privately-owned bank in Turkey. The Bank offers retail and commercial banking products and services, such as credit and debit cards, private and commercial loans, savings and checking accounts and money transfers, issuing letters of guarantee, foreign currency and non-cash loans and commercial loan deposit accounts, as well as portfolio management, mutual and pension fund management, international trade finance and securities brokerage. The Bank also provides online and mobile banking services, and has investments in companies that are active in finance, glass industry, telecommunications and other industry and service sectors. At the end of 2015, the Bank operated 1,377 branches and 6,582 ATMs, employed over 25,000 employees and serviced more than 6 mil retail clients

Isbank has been growing its revenues and asset by 14.8% and 18.4% a year on average in the last 10 years. Its loans and deposits have grown by 23.2% and 15.5% a year during that time and loans to deposits ratio reached 138% at the end of 2017. The company achieved an average return on equity of 14.8% in the last decade with net profit growing 12.9% a year on average. In terms of operating efficiency, its cost to income ratio reached 54.7% in 2017, compared to 49.7% average in the last decade.
Equity represented 13.0% of total assets or 20.5% of loans at the end of 2017. Isbank's non-performing loans were 2.16% of total loans while provisions covered some 104% of NPLs at the end of 2017.
Isbank stock traded at TRY 6.97 per share at the end of 2017 resulting in a market capitalization of USD 20,731 mil. Over the previous five years, stock price rose by 12.1% or 2.3% a year on average. That’s compared to an average ROE of 11.9% the bank generated for its shareholders. This closing price put stock at a 12-month trailing price to earnings (PE) of 13.6x and price to book value (PBV) of 1.39x in 2017.
 Helgi Library