By Helgi Library - June 7, 2018
Oberbank's non-performing loans reached 2.81% of total loans at the end of 2017, down from 3.53% compared to the previous year. ...
By Helgi Library - June 7, 2018
Oberbank made a net profit of EUR 200 mil in 2017, up 10.5% compared to the previous year. This implies a return on equity of 8....
By Helgi Library - June 7, 2018
Oberbank stock traded at 82.0 per share at the end 2017 implying a market capitalization of USD 3,467 mil. Since the end of 2012, the s...
| Profit Statement |
| Balance Sheet |
| Ratios |
| Valuation |
Get all company financials in excel:
Get all company financials in excel:


By Helgi Library - June 7, 2018
Oberbank's net interest margin amounted to 1.58% in 2017, down from 1.65% compared to the previous year. Historically, the bank’s net interest margin reached an all time high of 1.78% in 2014 and an all time low of 1.58% in 2017. The average margin in t...
By Helgi Library - June 7, 2018
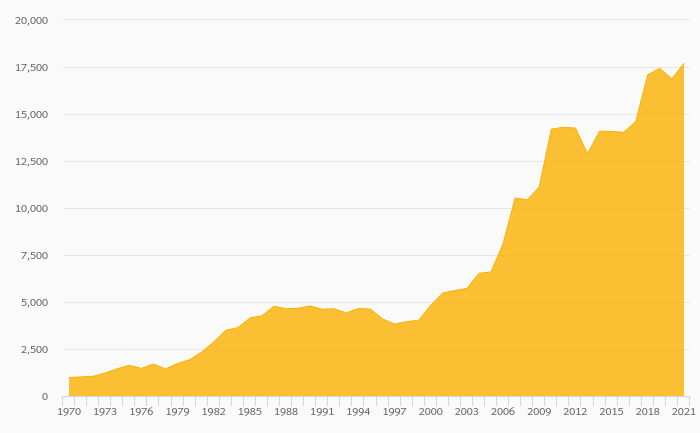
Oberbank generated total banking revenues of EUR 538 mil in 2017, up 7.19% compared to the previous year. Historically, the bank’s revenues containing of interest, fee and other non-interest income reached an all time high of EUR 628 mil in 2012 and an all time...
By Helgi Library - June 7, 2018
Oberbank's capital adequacy ratio reached 17.0% at the end of 2017, down from 19.4% compared to the previous year. Historically, the bank’s capital ratio hit an all time high of 19.4% in 2016 and an all time low of 15.7% in 2014. The Tier 1 ratio amounted to ...
By Helgi Library - June 7, 2018
Oberbank's customer loan growth reached 7.82% in 2017, down from 7.88% compared to the previous year. Historically, the bank’s loans growth reached an all time high of 7.88% in 2016 and an all time low of 2.96% in 2012. In the last decade, the average ann...

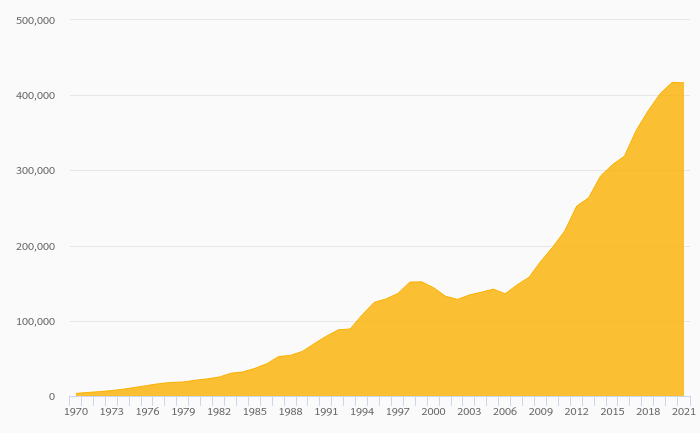
Oberbank has been growing its revenues and asset by -3.06% and 3.34% a year on average in the last 5 years. Its loans and deposits have grown by 5.72% and 3.93% a year during that time and loans to deposits ratio reached 126% at the end of 2017. The company achieved an average return on equity of 8.95% in the last five years with net profit growing 12.5% a year on average. In terms of operating efficiency, its cost to income ratio reached 49.5% in 2017, compared to 49.3% average in the last five years.
Equity represented 11.8% of total assets or 17.2% of loans at the end of 2017. Oberbank's non-performing loans were 2.81% of total loans while provisions covered some 94.7% of NPLs at the end of 2017.
Oberbank stock traded at 82.0 per share at the end of 2017 resulting in a market capitalization of USD 3,467 mil. Over the previous five years, stock price rose by 70.7% or 11.3% a year on average. That’s compared to an average ROE of 8.95% the bank generated for its shareholders. This closing price put stock at a 12-month trailing price to earnings (PE) of 14.5x and price to book value (PBV) of 1.17x in 2017.
 Helgi Library