By Helgi Library - May 11, 2022
Restaurant Brands Int. made a net profit of USD 838 mil with revenues of USD 5,739 mil in 2021, up by 72.4% and up by 1...
By Helgi Library - May 11, 2022
Restaurant Brands Int. stock traded at USD 60.1 per share at the end 2021 translating into a market capitalization of USD 27,530 mil. ...
By Helgi Library - May 11, 2022
Restaurant Brands Int. invested a total of USD 90.0 mil in 2021, down 14.3% compared to the previous year. Historically, ...
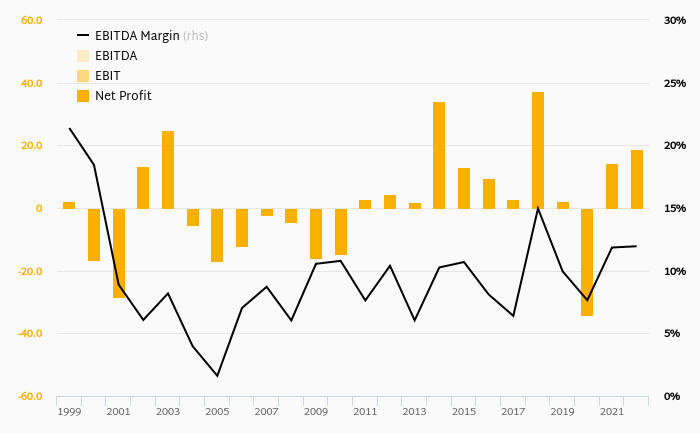
| Profit Statement |
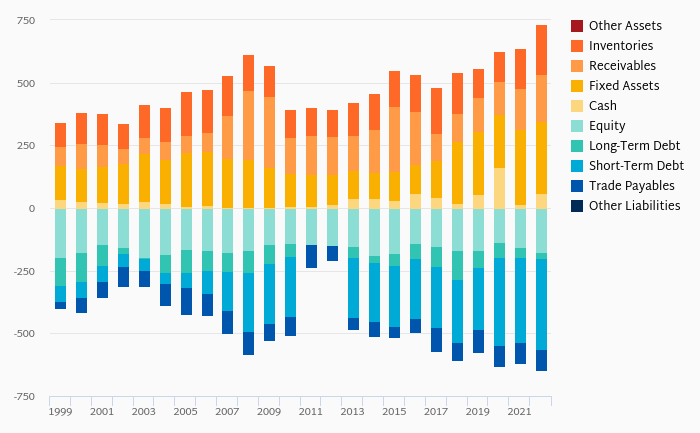
| Balance Sheet |
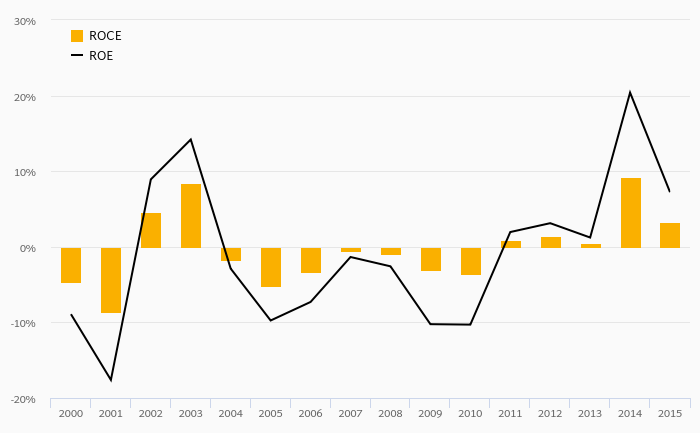
| Ratios |
| Valuation |
Get all company financials in excel:
Get all company financials in excel:


By Helgi Library - May 11, 2022
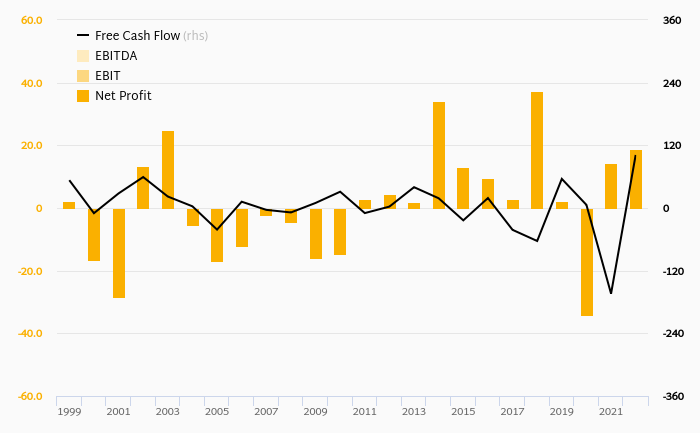
Restaurant Brands Int. made a net profit of USD 838 mil with revenues of USD 5,739 mil in 2021, up by 72.4% and up by 15.5%, respectively, compared to the previous year. This translates into a net margin of 14.6%. Historically, between 2013 and 2021, ...
By Helgi Library - May 11, 2022
Restaurant Brands Int. stock traded at USD 60.1 per share at the end 2021 translating into a market capitalization of USD 27,530 mil. Since the end of 2016, the stock has appreciated by 47.6% representing an annual average growth of 8.10%. At the end of ...
By Helgi Library - May 11, 2022
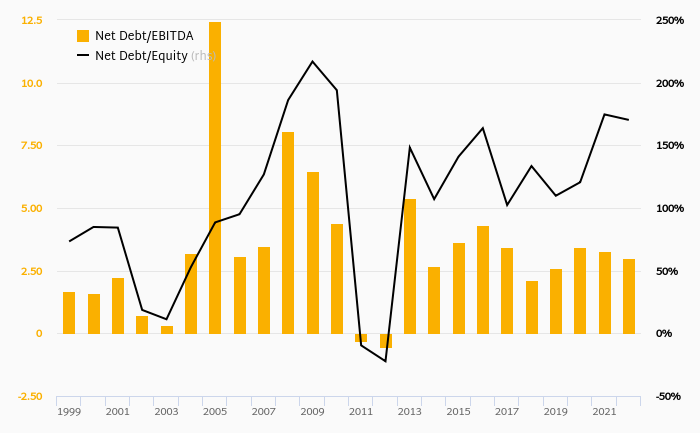
Restaurant Brands Int.'s net debt stood at USD 13,468 mil and accounted for 350% of equity at the end of 2021. The ratio is up 14.1 pp compared to the previous year. Historically, the firm’s net debt to equity reached a high of 350% in 2021 and a...
By Helgi Library - May 11, 2022
Restaurant Brands Int. stock traded at USD 60.1 per share at the end 2021 implying a market capitalization of USD 27,530 mil. Since the end of 2016, stock has appreciated by 47.6% implying an annual average growth of 8.10% In absolute terms, the value of the com...

Restaurant Brands Int. has been growing its sales by 3.77% a year on average in the last 5 years. EBITDA has grown on average by 3.74% a year during that time to total of USD 2,842 mil in 2027, or 37.3% of sales. That’s compared to 39.0% average margin seen in last five years.
The company netted USD 1,648 mil in 2027 implying ROE of 25.7% and ROCE of . Again, the average figures were 28.2% and %, respectively when looking at the previous 5 years.
Restaurant Brands Int.’s net debt amounted to USD 14,320 mil at the end of 2027, or 215% of equity. When compared to EBITDA, net debt was 5.04x, down when compared to average of 5.04x seen in the last 5 years.
Restaurant Brands Int. stock traded at USD 51.0 per share at the end of 2027 resulting in a market capitalization of USD 23,664 mil. Over the previous five years, stock price grew by 0% or 0% a year on average. The closing price put stock at a 12-month trailing EV/EBITDA of 13.4x and price to earnings (PE) of 14.4x as of 2027.
 Helgi Library