By Helgi Library - December 12, 2019
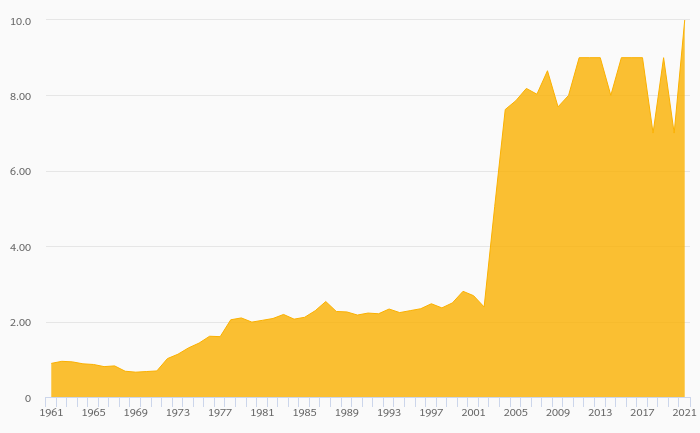
Tatra banka's mortgage loans reached EUR 3,469 mil in 2017, up 18.2% compared to the previous year. Slovak banking sector provi...
By Helgi Library - December 12, 2019
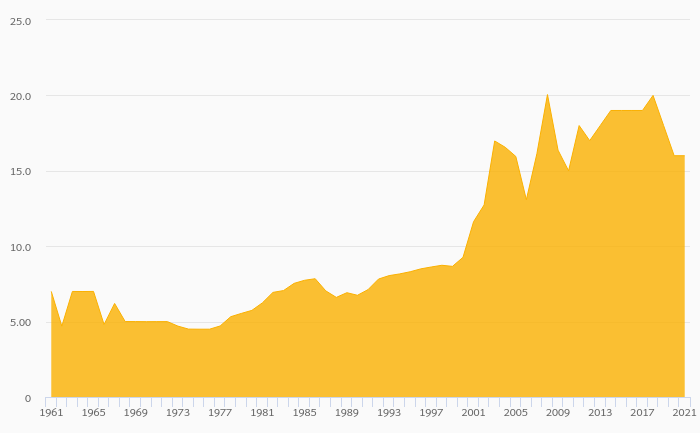
Tatra banka's customer loans reached EUR 9,333 mil in 2017, up 11.8% compared to the previous year. Slovak banking sector provi...
By Helgi Library - July 16, 2018
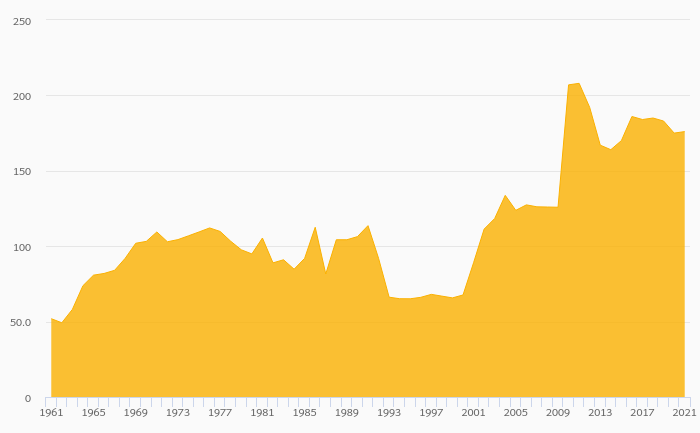
Tatra banka's retail deposits reached EUR 6,820 mil in 2017, up 11.0% compared to the previous year. Slovak banking sector acce...
| Profit Statement | 2015 | 2016 | 2017 | |
| Net Interest Income | EUR mil | 289 | 275 | 272 |
| Net Fee Income | EUR mil | 132 | 119 | 125 |
| Other Income | EUR mil | 24.9 | 52.8 | 28.4 |
| Total Revenues | EUR mil | 446 | 447 | 425 |
| Staff Cost | EUR mil | 108 | 119 | 125 |
| Operating Profit | EUR mil | 212 | 198 | 183 |
| Provisions | EUR mil | 33.9 | 12.3 | 13.6 |
| Net Profit | EUR mil | 121 | 126 | 124 |
| Balance Sheet | 2015 | 2016 | 2017 | |
| Interbank Loans | EUR mil | 126 | 148 | 220 |
| Customer Loans | EUR mil | 7,923 | 8,351 | 9,333 |
| Total Assets | EUR mil | 11,215 | 11,373 | 12,503 |
| Shareholders' Equity | EUR mil | 996 | 994 | 992 |
| Interbank Borrowing | EUR mil | 357 | 241 | 285 |
| Customer Deposits | EUR mil | 8,719 | 8,967 | 10,037 |
| Issued Debt Securities | EUR mil | 925 | 950 | 1,001 |
| Ratios | 2015 | 2016 | 2017 | |
| ROE | % | 12.1 | 12.7 | 12.5 |
| ROA | % | 1.15 | 1.12 | 1.04 |
| Costs (As % Of Assets) | % | 2.24 | 2.21 | 2.03 |
| Costs (As % Of Income) | % | 52.4 | 55.8 | 57.0 |
| Capital Adequacy Ratio | % | 18.2 | 19.7 | 18.7 |
| Net Interest Margin | % | 2.77 | 2.43 | 2.27 |
| Loans (As % Of Deposits) | % | 90.9 | 93.1 | 93.0 |
| NPLs (As % Of Loans) | % | 3.39 | 3.51 | 2.90 |
| Provisions (As % Of NPLs) | % | 80.2 | 66.6 | 70.0 |
| Growth Rates | 2015 | 2016 | 2017 | |
| Total Revenue Growth | % | -2.33 | 0.190 | -4.85 |
| Operating Cost Growth | % | -7.05 | 6.55 | -2.72 |
| Operating Profit Growth | % | 3.47 | -6.82 | -7.54 |
| Net Profit Growth | % | 5.17 | 4.49 | -1.30 |
| Customer Loan Growth | % | 13.4 | 5.41 | 11.8 |
| Total Asset Growth | % | 15.8 | 1.41 | 9.93 |
| Customer Deposit Growth | % | 18.8 | 2.84 | 11.9 |
| Shareholders' Equity Growth | % | -0.085 | -0.234 | -0.181 |
| Employees | 3,735 | 3,795 | 3,754 | |
Get all company financials in excel:
| summary | Unit | 1994 | 1995 | 1996 | 1997 | 1998 | 1999 | 2000 | 2001 | 2002 | 2003 | 2004 | 2005 | 2006 | 2007 | 2008 | 2009 | 2010 | 2011 | 2012 | 2013 | 2014 | 2015 | 2016 | 2017 |
| income statement | |||||||||||||||||||||||||
| Net Interest Income | EUR mil | ... | ... | ... | 291 | 278 | 296 | 305 | 289 | ||||||||||||||||
| Total Revenues | EUR mil | ... | ... | ... | 417 | 426 | 440 | 457 | 446 | ||||||||||||||||
| Operating Profit | EUR mil | ... | ... | ... | 190 | 177 | 162 | 205 | 212 | ||||||||||||||||
| Net Profit | EUR mil | ... | ... | ... | 139 | 104 | 97.2 | 115 | 121 | ||||||||||||||||
| balance sheet | |||||||||||||||||||||||||
| Interbank Loans | EUR mil | ... | ... | ... | 169 | 118 | 152 | 240 | 126 | ||||||||||||||||
| Customer Loans | EUR mil | ... | ... | ... | 6,169 | 6,181 | 6,383 | 6,989 | 7,923 | ||||||||||||||||
| Debt Securities | EUR mil | ... | ... | ... | 2,112 | 2,247 | 1,861 | 1,893 | 1,969 | ||||||||||||||||
| Total Assets | EUR mil | ... | ... | ... | 9,161 | 9,073 | 9,469 | 9,681 | 11,215 | ||||||||||||||||
| Shareholders' Equity | EUR mil | ... | ... | ... | 1,052 | 1,062 | 1,013 | 997 | 996 | ||||||||||||||||
| Interbank Borrowing | EUR mil | ... | ... | ... | 101 | 118 | 357 | 190 | 357 | ||||||||||||||||
| Customer Deposits | EUR mil | ... | ... | ... | 6,933 | 6,865 | 7,008 | 7,338 | 8,719 | ||||||||||||||||
| Issued Debt Securities | EUR mil | ... | ... | ... | 874 | 839 | 922 | 822 | 925 | ||||||||||||||||
| ratios | |||||||||||||||||||||||||
| ROE | % | ... | ... | ... | 14.6 | 9.80 | 9.36 | 11.4 | 12.1 | ||||||||||||||||
| ROA | % | ... | ... | ... | 1.55 | 1.14 | 1.05 | 1.20 | 1.15 | ||||||||||||||||
| Costs (As % Of Assets) | % | ... | ... | ... | 2.53 | 2.73 | 3.00 | 2.63 | 2.24 | ||||||||||||||||
| Costs (As % Of Income) | % | ... | ... | ... | 54.4 | 58.4 | 63.2 | 55.1 | 52.4 | ||||||||||||||||
| Capital Adequacy Ratio | % | ... | ... | ... | ... | ... | 13.1 | 15.2 | 16.6 | 19.6 | 18.2 | ||||||||||||||
| Net Interest Margin | % | ... | ... | ... | 3.25 | 3.05 | 3.19 | 3.19 | 2.77 | ||||||||||||||||
| Interest Income (As % Of Revenues) | % | ... | ... | ... | 69.8 | 65.3 | 67.3 | 66.8 | 64.9 | ||||||||||||||||
| Fee Income (As % Of Revenues) | % | ... | ... | ... | 24.9 | 25.9 | 26.1 | 27.2 | 29.5 | ||||||||||||||||
| Staff Cost (As % Of Total Cost) | % | ... | ... | ... | 48.2 | 43.8 | 39.7 | 42.7 | 46.1 | ||||||||||||||||
| Equity (As % Of Assets) | % | ... | ... | ... | 11.5 | 11.7 | 10.7 | 10.3 | 8.88 | ||||||||||||||||
| Loans (As % Of Deposits) | % | ... | ... | ... | 89.0 | 90.0 | 91.1 | 95.2 | 90.9 | ||||||||||||||||
| Loans (As % Assets) | % | ... | ... | ... | 67.3 | 68.1 | 67.4 | 72.2 | 70.6 | ||||||||||||||||
| NPLs (As % Of Loans) | % | ... | ... | ... | ... | ... | ... | ... | ... | ... | ... | ... | 4.97 | 5.22 | 5.02 | 4.83 | 3.39 | ||||||||
| Provisions (As % Of NPLs) | % | ... | ... | ... | ... | ... | ... | ... | ... | ... | ... | ... | 59.5 | 62.2 | 59.0 | 61.2 | 80.2 | ||||||||
| valuation | |||||||||||||||||||||||||
| Book Value Per Share Growth | % | ... | ... | ... | ... | 8.57 | -4.34 | 6.36 | 3.15 | -5.19 |
| income statement | Unit | 1994 | 1995 | 1996 | 1997 | 1998 | 1999 | 2000 | 2001 | 2002 | 2003 | 2004 | 2005 | 2006 | 2007 | 2008 | 2009 | 2010 | 2011 | 2012 | 2013 | 2014 | 2015 | 2016 | 2017 |
| income statement | |||||||||||||||||||||||||
| Interest Income | EUR mil | ... | ... | ... | 367 | 357 | 347 | 345 | 322 | ||||||||||||||||
| Interest Cost | EUR mil | ... | ... | ... | 76.4 | 78.5 | 50.9 | 39.7 | 32.5 | ||||||||||||||||
| Net Interest Income | EUR mil | ... | ... | ... | 291 | 278 | 296 | 305 | 289 | ||||||||||||||||
| Net Fee Income | EUR mil | ... | ... | ... | 104 | 110 | 115 | 124 | 132 | ||||||||||||||||
| Other Income | EUR mil | ... | ... | ... | 22.0 | 37.4 | 29.0 | 27.2 | 24.9 | ||||||||||||||||
| Total Revenues | EUR mil | ... | ... | ... | 417 | 426 | 440 | 457 | 446 | ||||||||||||||||
| Staff Cost | EUR mil | ... | ... | ... | 109 | 109 | 110 | 107 | 108 | ||||||||||||||||
| Depreciation | EUR mil | ... | ... | ... | 20.4 | 22.5 | 52.5 | 24.3 | 26.5 | ||||||||||||||||
| Other Cost | EUR mil | ... | ... | ... | 97.0 | 117 | 115 | 120 | 99.6 | ||||||||||||||||
| Operating Cost | EUR mil | ... | ... | ... | 227 | 249 | 278 | 252 | 234 | ||||||||||||||||
| Operating Profit | EUR mil | ... | ... | ... | 190 | 177 | 162 | 205 | 212 | ||||||||||||||||
| Provisions | EUR mil | ... | ... | ... | 15.1 | 45.1 | 34.0 | 53.2 | 33.9 | ||||||||||||||||
| Extra and Other Cost | EUR mil | ... | ... | ... | 0 | 0.540 | 0 | 0 | 18.7 | ||||||||||||||||
| Pre-Tax Profit | EUR mil | ... | ... | ... | 175 | 131 | 128 | 152 | 159 | ||||||||||||||||
| Tax | EUR mil | ... | ... | ... | 35.6 | 27.9 | 30.9 | 37.2 | 38.9 | ||||||||||||||||
| Minorities | EUR mil | ... | ... | ... | 0 | 0 | 0 | 0 | 0 | ||||||||||||||||
| Net Profit | EUR mil | ... | ... | ... | 139 | 104 | 97.2 | 115 | 121 | ||||||||||||||||
| growth rates | |||||||||||||||||||||||||
| Net Interest Income Growth | % | ... | ... | ... | ... | 8.57 | -4.34 | 6.36 | 3.15 | -5.19 | |||||||||||||||
| Net Fee Income Growth | % | ... | ... | ... | ... | 1.45 | 6.30 | 4.19 | 8.21 | 5.99 | |||||||||||||||
| Total Revenue Growth | % | ... | ... | ... | ... | 7.81 | 2.24 | 3.26 | 3.84 | -2.33 | |||||||||||||||
| Operating Cost Growth | % | ... | ... | ... | ... | 3.87 | 9.68 | 11.7 | -9.39 | -7.05 | |||||||||||||||
| Operating Profit Growth | % | ... | ... | ... | ... | 12.9 | -6.66 | -8.52 | 26.5 | 3.47 | |||||||||||||||
| Pre-Tax Profit Growth | % | ... | ... | ... | ... | 40.8 | -24.8 | -2.58 | 18.6 | 5.03 | |||||||||||||||
| Net Profit Growth | % | ... | ... | ... | ... | 47.7 | -25.6 | -6.15 | 18.0 | 5.17 | |||||||||||||||
| market share | |||||||||||||||||||||||||
| Market Share in Revenues | % | ... | ... | ... | 17.0 | 20.3 | 18.9 | 18.6 | 19.6 | ||||||||||||||||
| Market Share in Net Profit | % | ... | ... | ... | ... | ... | ... | 20.6 | 21.6 | 17.7 | 20.5 | 19.9 | |||||||||||||
| Market Share in Employees | % | 19.0 | 18.3 | 18.6 | 18.5 | 19.8 | |||||||||||||||||||
| Market Share in Bank Cards | % | ... | ... | ... | ... | ... | ... | ... | ... | ... | ... | ... | ... | ... | ... | ... | ... | ... | ... | ... | ... | ... | ... | ... | |
| Market Share in Branches | % | ... | 14.6 | 14.9 | 16.9 | 18.4 | 20.9 |
| balance sheet | Unit | 1994 | 1995 | 1996 | 1997 | 1998 | 1999 | 2000 | 2001 | 2002 | 2003 | 2004 | 2005 | 2006 | 2007 | 2008 | 2009 | 2010 | 2011 | 2012 | 2013 | 2014 | 2015 | 2016 | 2017 |
| balance sheet | |||||||||||||||||||||||||
| Cash | EUR mil | ... | ... | ... | 349 | 175 | 689 | 338 | 907 | ||||||||||||||||
| Interbank Loans | EUR mil | ... | ... | ... | 169 | 118 | 152 | 240 | 126 | ||||||||||||||||
| Customer Loans | EUR mil | ... | ... | ... | 6,169 | 6,181 | 6,383 | 6,989 | 7,923 | ||||||||||||||||
| Retail Loans | EUR mil | ... | ... | ... | ... | ... | ... | ... | ... | ... | ... | ... | ... | ... | 2,712 | 2,907 | 3,197 | 3,435 | 3,976 | ||||||
| Mortgage Loans | EUR mil | ... | ... | ... | ... | ... | ... | ... | ... | ... | ... | ... | ... | ... | ... | ... | ... | ... | 1,649 | 1,796 | 2,029 | 2,232 | 2,607 | ||
| Consumer Loans | EUR mil | ... | ... | ... | ... | ... | ... | ... | ... | ... | ... | ... | ... | ... | ... | ... | ... | ... | 1,063 | 1,111 | 1,169 | 1,202 | 1,369 | ||
| Corporate Loans | EUR mil | ... | ... | ... | ... | ... | ... | ... | ... | ... | ... | ... | ... | ... | 3,629 | 3,464 | 3,361 | 3,757 | 4,154 | ||||||
| Debt Securities | EUR mil | ... | ... | ... | 2,112 | 2,247 | 1,861 | 1,893 | 1,969 | ||||||||||||||||
| Fixed Assets | EUR mil | ... | ... | ... | 122 | 89.2 | 122 | 116 | 116 | ||||||||||||||||
| Total Assets | EUR mil | ... | ... | ... | 9,161 | 9,073 | 9,469 | 9,681 | 11,215 | ||||||||||||||||
| Shareholders' Equity | EUR mil | ... | ... | ... | 1,052 | 1,062 | 1,013 | 997 | 996 | ||||||||||||||||
| Of Which Minority Interest | EUR mil | ... | ... | ... | 0 | 0 | 0 | 0 | 0 | ||||||||||||||||
| Liabilities | EUR mil | ... | ... | ... | 8,109 | 8,011 | 8,456 | 8,684 | 10,219 | ||||||||||||||||
| Interbank Borrowing | EUR mil | ... | ... | ... | 101 | 118 | 357 | 190 | 357 | ||||||||||||||||
| Customer Deposits | EUR mil | ... | ... | ... | 6,933 | 6,865 | 7,008 | 7,338 | 8,719 | ||||||||||||||||
| Retail Deposits | EUR mil | ... | ... | ... | ... | ... | ... | ... | ... | ... | ... | ... | ... | ... | ... | ... | ... | ... | 4,397 | 4,233 | 4,212 | 4,525 | 5,268 | ||
| Corporate Deposits | EUR mil | ... | ... | ... | ... | ... | ... | ... | ... | ... | ... | ... | ... | ... | ... | ... | ... | ... | 2,444 | 2,560 | 2,717 | 2,721 | 3,398 | ||
| Sight Deposits | EUR mil | ... | ... | ... | ... | ... | ... | ... | ... | ... | ... | ... | ... | ... | ... | ... | ... | ... | 4,193 | 4,255 | 4,962 | 5,371 | 6,522 | ||
| Term Deposits | EUR mil | ... | ... | ... | ... | ... | ... | ... | ... | ... | ... | ... | ... | ... | ... | ... | ... | ... | 2,739 | 2,609 | 2,046 | 1,967 | 2,197 | ||
| Issued Debt Securities | EUR mil | ... | ... | ... | 874 | 839 | 922 | 822 | 925 | ||||||||||||||||
| Other Liabilities | EUR mil | ... | ... | ... | 201 | 189 | 169 | 334 | 217 | ||||||||||||||||
| asset quality | |||||||||||||||||||||||||
| Non-Performing Loans | EUR mil | ... | ... | ... | ... | ... | ... | ... | ... | ... | ... | ... | 316 | 334 | 330 | 348 | 276 | ||||||||
| Gross Loans | EUR mil | ... | ... | ... | 6,357 | 6,388 | 6,578 | 7,202 | 8,144 | ||||||||||||||||
| Total Provisions | EUR mil | ... | ... | ... | 188 | 207 | 195 | 213 | 221 | ||||||||||||||||
| growth rates | |||||||||||||||||||||||||
| Customer Loan Growth | % | ... | ... | ... | ... | 10.8 | 0.187 | 3.27 | 9.49 | 13.4 | |||||||||||||||
| Retail Loan Growth | % | ... | ... | ... | ... | ... | ... | ... | ... | ... | ... | ... | ... | ... | ... | 13.8 | 7.21 | 9.98 | 7.42 | 15.8 | |||||
| Mortgage Loan Growth | % | ... | ... | ... | ... | ... | ... | ... | ... | ... | ... | ... | ... | ... | ... | ... | ... | ... | ... | 8.92 | 12.9 | 10.1 | 16.8 | ||
| Consumer Loan Growth | % | ... | ... | ... | ... | ... | ... | ... | ... | ... | ... | ... | ... | ... | ... | ... | ... | ... | ... | 4.55 | 5.22 | 2.86 | 13.9 | ||
| Corporate Loan Growth | % | ... | ... | ... | ... | ... | ... | ... | ... | ... | ... | ... | ... | ... | ... | 7.73 | -4.55 | -2.96 | 11.8 | 10.6 | |||||
| Total Asset Growth | % | ... | ... | ... | ... | 4.55 | -0.958 | 4.36 | 2.25 | 15.8 | |||||||||||||||
| Shareholders' Equity Growth | % | ... | ... | ... | ... | 23.8 | 1.02 | -4.65 | -1.55 | -0.085 | |||||||||||||||
| Customer Deposit Growth | % | ... | ... | ... | ... | 1.93 | -0.982 | 2.09 | 4.71 | 18.8 | |||||||||||||||
| Retail Deposit Growth | % | ... | ... | ... | ... | ... | ... | ... | ... | ... | ... | ... | ... | ... | ... | ... | ... | ... | ... | -3.72 | -0.481 | 7.43 | 16.4 | ||
| Corporate Deposit Growth | % | ... | ... | ... | ... | ... | ... | ... | ... | ... | ... | ... | ... | ... | ... | ... | ... | ... | ... | 4.74 | 6.13 | 0.140 | 24.9 | ||
| market share | |||||||||||||||||||||||||
| Market Share in Customer Loans | % | ... | ... | ... | 16.9 | 16.7 | 16.3 | 16.7 | 17.4 | ||||||||||||||||
| Market Share in Corporate Loans | % | ... | ... | ... | ... | ... | ... | ... | ... | ... | ... | ... | ... | ... | 23.4 | 23.1 | 23.0 | 26.1 | 26.5 | ||||||
| Market Share in Retail Loans | % | ... | ... | ... | ... | ... | ... | ... | ... | ... | ... | ... | ... | ... | ... | ... | ... | ... | 21.8 | 21.8 | 22.2 | 21.1 | 22.1 | ||
| Market Share in Consumer Loans | % | ... | ... | ... | ... | ... | ... | ... | ... | ... | ... | ... | ... | ... | 15.8 | 15.5 | 15.6 | 14.9 | 15.3 | ||||||
| Market Share in Mortgage Loans | % | ... | ... | ... | ... | ... | ... | ... | ... | ... | ... | ... | ... | ... | ... | ... | ... | ... | 13.4 | 13.1 | 13.3 | 12.9 | 13.2 | ||
| Market Share in Total Assets | % | ... | ... | ... | 15.5 | 15.2 | 15.5 | 15.1 | 16.2 | ||||||||||||||||
| Market Share in Customer Deposits | % | ... | ... | ... | 17.3 | 16.2 | 15.8 | 15.9 | 17.3 | ||||||||||||||||
| Market Share in Retail Deposits | % | ... | ... | ... | ... | ... | ... | ... | ... | ... | ... | ... | ... | ... | ... | ... | ... | ... | 17.5 | 15.9 | 15.4 | 15.9 | 16.9 | ||
| Market Share in Corporate Deposits | % | ... | ... | ... | ... | ... | ... | ... | ... | ... | ... | ... | ... | ... | ... | ... | ... | ... | 26.4 | 26.8 | 25.1 | 25.3 | 28.8 |
| ratios | Unit | 1994 | 1995 | 1996 | 1997 | 1998 | 1999 | 2000 | 2001 | 2002 | 2003 | 2004 | 2005 | 2006 | 2007 | 2008 | 2009 | 2010 | 2011 | 2012 | 2013 | 2014 | 2015 | 2016 | 2017 |
| ratios | |||||||||||||||||||||||||
| ROE | % | ... | ... | ... | 14.6 | 9.80 | 9.36 | 11.4 | 12.1 | ||||||||||||||||
| ROA | % | ... | ... | ... | 1.55 | 1.14 | 1.05 | 1.20 | 1.15 | ||||||||||||||||
| Costs (As % Of Assets) | % | ... | ... | ... | 2.53 | 2.73 | 3.00 | 2.63 | 2.24 | ||||||||||||||||
| Costs (As % Of Income) | % | ... | ... | ... | 54.4 | 58.4 | 63.2 | 55.1 | 52.4 | ||||||||||||||||
| Capital Adequacy Ratio | % | ... | ... | ... | ... | ... | 13.1 | 15.2 | 16.6 | 19.6 | 18.2 | ||||||||||||||
| Tier 1 Ratio | % | ... | ... | ... | ... | ... | ... | ... | ... | ... | ... | ... | ... | ... | ... | ... | ... | 13.1 | 15.2 | 15.4 | 15.2 | 14.1 | |||
| Net Interest Margin | % | ... | ... | ... | 3.25 | 3.05 | 3.19 | 3.19 | 2.77 | ||||||||||||||||
| Interest Spread | % | ... | ... | ... | ... | 3.14 | 2.94 | 3.12 | 3.14 | 2.74 | |||||||||||||||
| Asset Yield | % | ... | ... | ... | 4.10 | 3.91 | 3.74 | 3.60 | 3.08 | ||||||||||||||||
| Cost Of Liabilities | % | ... | ... | ... | ... | 0.954 | 0.974 | 0.618 | 0.464 | 0.343 | |||||||||||||||
| Interest Income (As % Of Revenues) | % | ... | ... | ... | 69.8 | 65.3 | 67.3 | 66.8 | 64.9 | ||||||||||||||||
| Fee Income (As % Of Revenues) | % | ... | ... | ... | 24.9 | 25.9 | 26.1 | 27.2 | 29.5 | ||||||||||||||||
| Other Income (As % Of Revenues) | % | ... | ... | ... | 5.28 | 8.79 | 6.60 | 5.95 | 5.58 | ||||||||||||||||
| Cost Per Employee | USD per month | ... | ... | ... | 3,609 | 3,407 | 3,533 | 3,346 | 2,757 | ||||||||||||||||
| Cost Per Employee (Local Currency) | EUR per month | ... | ... | ... | 2,596 | 2,653 | 2,661 | 2,596 | 2,405 | ||||||||||||||||
| Staff Cost (As % Of Total Cost) | % | ... | ... | ... | 48.2 | 43.8 | 39.7 | 42.7 | 46.1 | ||||||||||||||||
| Equity (As % Of Assets) | % | ... | ... | ... | 11.5 | 11.7 | 10.7 | 10.3 | 8.88 | ||||||||||||||||
| Loans (As % Of Deposits) | % | ... | ... | ... | 89.0 | 90.0 | 91.1 | 95.2 | 90.9 | ||||||||||||||||
| Loans (As % Assets) | % | ... | ... | ... | 67.3 | 68.1 | 67.4 | 72.2 | 70.6 | ||||||||||||||||
| NPLs (As % Of Loans) | % | ... | ... | ... | ... | ... | ... | ... | ... | ... | ... | ... | 4.97 | 5.22 | 5.02 | 4.83 | 3.39 | ||||||||
| Provisions (As % Of NPLs) | % | ... | ... | ... | ... | ... | ... | ... | ... | ... | ... | ... | 59.5 | 62.2 | 59.0 | 61.2 | 80.2 | ||||||||
| Provisions (As % Of Loans) | % | ... | ... | ... | 3.05 | 3.36 | 3.05 | 3.05 | 2.79 | ||||||||||||||||
| Cost of Provisions (As % Of Loans) | % | ... | ... | ... | 0.257 | 0.731 | 0.541 | 0.795 | 0.455 |
| other data | Unit | 1994 | 1995 | 1996 | 1997 | 1998 | 1999 | 2000 | 2001 | 2002 | 2003 | 2004 | 2005 | 2006 | 2007 | 2008 | 2009 | 2010 | 2011 | 2012 | 2013 | 2014 | 2015 | 2016 | 2017 |
| other data | |||||||||||||||||||||||||
| Branches | 151 | 158 | 160 | 174 | 198 | ||||||||||||||||||||
| Employees | 3,509 | 3,418 | 3,455 | 3,446 | 3,735 | ||||||||||||||||||||
| ATMs | ... | ... | ... | ... | ... | ... | ... | ... | ... | ... | ... | ... | ... | ... | ... | ... | ... | ... | 307 | ... | ... | ||||
| Clients | mil | ... | ... | ... | ... | ... | ... | ... | ... | ... | ... | ... | ... | ... | ... | ... | ... | ... | ... | ... | ... | ... | ... | ... | |
| Payment Cards | '000 | ... | ... | ... | ... | ... | ... | ... | ... | ... | ... | ... | ... | ... | ... | ... | ... | ... | ... | ... | ... | ... | ... | ... | |
| Sight (As % Of Customer Deposits) | % | ... | ... | ... | ... | ... | ... | ... | ... | ... | ... | ... | ... | ... | ... | ... | ... | ... | 60.5 | 62.0 | 70.8 | 73.2 | 74.8 | ||
| Risk-Weighted Assets | EUR mil | ... | ... | ... | ... | ... | ... | ... | ... | ... | ... | ... | ... | ... | ... | ... | ... | ... | ... | ... | 5,388 | 5,249 | ... | ... | ... |
Get all company financials in excel:

By Helgi Library - May 24, 2018
Tatra banka made a net profit of EUR 124 mil in 2017, down 1.30% compared to the previous year. This implies a return on equity of 12.5%. Historically, the bank’s net profit reached an all time high of EUR 139 mil in 2011 and an all time low of EUR 23.8 mil...
By Helgi Library - May 24, 2018
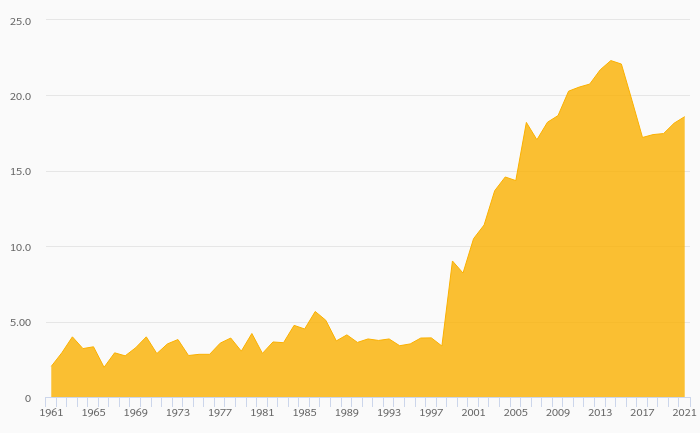
Tatra banka's non-performing loans reached 2.90% of total loans at the end of 2017, down from 3.51% compared to the previous year. Historically, the NPL ratio hit an all time high of 8.78% in 2010 and an all time low of 2.81% in 2005. Provision coverage amo...
By Helgi Library - December 12, 2019
Tatra banka's customer deposits reached EUR 10,037 mil in 2017, up 11.9% compared to the previous year. Slovak banking sector accepted customer deposits of EUR 55.7 bil in 2017, up 5.33% when compared to the last year. Tatra banka accounted for 18.4% of a...
By Helgi Library - December 12, 2019
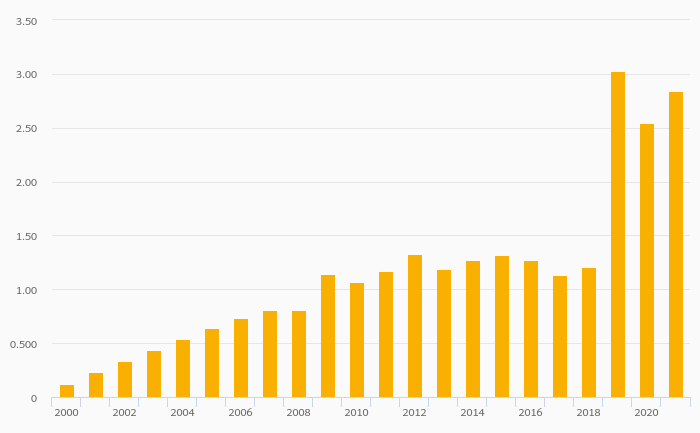
Tatra banka's consumer loans reached EUR 1,673 mil in 2017, up 12.8% compared to the previous year. Slovak banking sector provided consumer loans of EUR 7.45 bil in 2017, up 8.46% when compared to the last year. Tatra banka accounted for 15.7% of all cons...
By Helgi Library - May 24, 2018
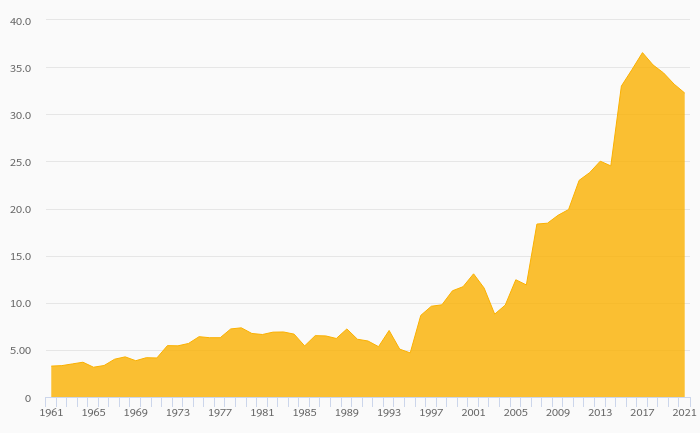
Tatra banka's loans reached EUR 9,527 mil in the 2017, up from EUR 8,551 mil compared to the previous year. Historically, the bank’s loans reached an all time high of EUR 9,527 mil in 2017 and an all time low of EUR 6,357 mil in 2011. In the last decade...
By Helgi Library - May 24, 2018
Tatra banka's capital adequacy ratio reached 18.7% at the end of 2017, down from 19.7% compared to the previous year. Historically, the bank’s capital ratio hit an all time high of 19.7% in 2016 and an all time low of 10.4% in 2010. The Tier 1 ratio amounted ...
By Helgi Library - July 16, 2018
Tatra banka's corporate deposits reached EUR 3,211 mil in 2017, up 14.6% compared to the previous year. Slovak banking sector accepted corporate deposits of EUR 12.3 bil in 2017, up 9.35% when compared to the last year. Tatra banka accounted for 26.0% of ...
By Helgi Library - May 24, 2018
Tatra banka's cost to income ratio reached 57.0% in 2017, up from 55.8% compared to the previous year. Historically, the bank’s costs reached an all time high of 72.4% of income in 2003 and an all time low of 26.8% in 1998. When compared to total assets, b...
By Helgi Library - July 16, 2018
Tatra banka generated total banking revenues of EUR 425 mil in 2017, down 4.85% compared to the previous year. Slovak banking sector banking sector generated total revenues of EUR 2,324 mil in 2017, down 10.6% when compared to the last year. As ...
By Helgi Library - May 24, 2018
Tatra banka's net interest margin amounted to 2.27% in 2017, down from 2.43% compared to the previous year. Historically, the bank’s net interest margin reached an all time high of 3.55% in 2002 and an all time low of 0.486% in 2000. The average margin ...
Tatra banka is a Slovakia-based bank. The Bank offers its financial products and services to private customers, small and medium size enterprises, and large corporates. The Bank's deposit products include fixed deposits, fixed foreign exchange deposits, current accounts, and savings accounts. The Bank’s loan portfolio primarily comprises personal, mortgage, housing, investment, short-term, subsidized, refinanced investment, and real estate project financing loans, as well as overdrafts, trade finance, and credit guarantees. The Bank operates through subsidiaries, including Tatra Asset Management, Eliot, or Pension Fund of Tatra banka, among others. Tatra banka was founded in 1990 and is based in Bratislava, the Slovak Republic. It is a subsidiary of Raiffeisen Bank International AG.

Tatra banka has been growing its revenues and asset by 1.79% and 5.20% a year on average in the last 10 years. Its loans and deposits have grown by 8.59% and 6.14% a year during that time and loans to deposits ratio reached 93.0% at the end of 2017. The company achieved an average return on equity of 12.8% in the last decade with net profit growing 1.98% a year on average. In terms of operating efficiency, its cost to income ratio reached 57.0% in 2017, compared to 56.6% average in the last decade.
Equity represented 7.94% of total assets or 10.6% of loans at the end of 2017. Tatra banka's non-performing loans were 2.90% of total loans while provisions covered some 70.0% of NPLs at the end of 2017.
 Helgi Library