By Helgi Library - May 15, 2024
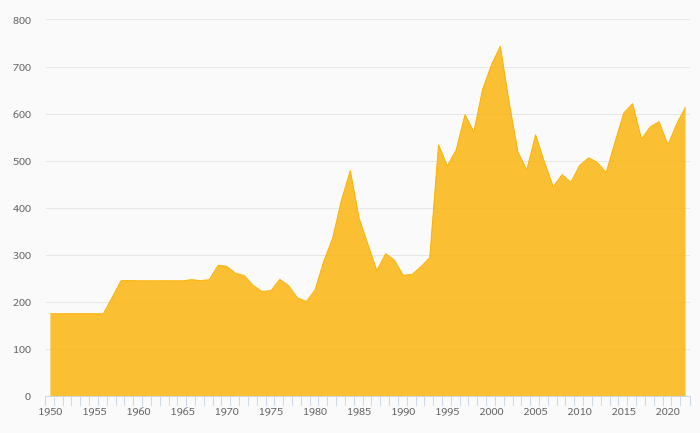
WSK Bank's net interest margin amounted to 4.78% in 2022, up from 4.38% compared to the previous year. Historically, the b...
By Helgi Library - May 15, 2024
WSK Bank made a net profit of EUR 0.518 mil under revenues of EUR 10.2 mil in 2022, up -28.0% and 2.03% respectively compared to the ...
By Helgi Library - May 15, 2024
WSK Bank's customer loan growth reached 0.276% in 2022, up from -0.818% compared to the previous year. Historically, the ba...
| Profit Statement | 2020 | 2021 | 2022 | |
| Net Interest Income | EUR mil | 5.72 | 5.70 | 6.36 |
| Net Fee Income | EUR mil | 1.72 | 1.60 | 0.956 |
| Other Income | EUR mil | 2.72 | 2.74 | 2.93 |
| Total Revenues | EUR mil | 10.2 | 10.0 | 10.2 |
| Staff Cost | EUR mil | 4.16 | 4.66 | 4.70 |
| Operating Profit | EUR mil | 1.01 | 1.08 | 0.816 |
| Provisions | EUR mil | 0.040 | 0.068 | 0.065 |
| Net Profit | EUR mil | 0.714 | 0.719 | 0.518 |
| Balance Sheet | 2020 | 2021 | 2022 | |
| Interbank Loans | EUR mil | 28.9 | 35.2 | 34.0 |
| Customer Loans | EUR mil | 83.1 | 82.4 | 82.6 |
| Investments | EUR mil | 0.610 | 0.206 | ... |
| Total Assets | EUR mil | 126 | 134 | 132 |
| Shareholders' Equity | EUR mil | 26.2 | 26.9 | 27.4 |
| Customer Deposits | EUR mil | 89.6 | 95.9 | 92.2 |
| Ratios | 2020 | 2021 | 2022 | |
| ROE | % | 2.72 | 2.71 | 1.90 |
| ROA | % | 0.578 | 0.552 | 0.389 |
| Costs (As % Of Assets) | % | 5.99 | 6.09 | 5.75 |
| Costs (As % Of Income) | % | 72.9 | 79.0 | 74.6 |
| Net Interest Margin | % | 4.63 | 4.38 | 4.78 |
| Loans (As % Of Deposits) | % | 92.7 | 85.9 | 89.6 |
| Growth Rates | 2020 | 2021 | 2022 | |
| Total Revenue Growth | % | -1.67 | -1.08 | 2.03 |
| Operating Cost Growth | % | -1.52 | 7.19 | -3.65 |
| Operating Profit Growth | % | -42.8 | 6.90 | -24.1 |
| Net Profit Growth | % | -41.8 | 0.744 | -28.0 |
| Customer Loan Growth | % | 5.85 | -0.818 | 0.276 |
| Total Asset Growth | % | 4.56 | 6.20 | -1.68 |
| Customer Deposit Growth | % | 6.25 | 6.99 | -3.87 |
| Shareholders' Equity Growth | % | 0.002 | 2.67 | 1.86 |
Get all company financials in excel:
| summary | Unit | 2013 | 2014 | 2015 | 2016 | 2017 | 2018 | 2019 | 2020 | 2021 | 2022 |
| income statement | |||||||||||
| Net Interest Income | EUR mil | 4.37 | 4.74 | 4.93 | 5.25 | 5.72 | |||||
| Total Revenues | EUR mil | 8.83 | 9.84 | 11.4 | 10.3 | 10.2 | |||||
| Operating Profit | EUR mil | 3.16 | 2.51 | 3.02 | 1.76 | 1.01 | |||||
| Net Profit | EUR mil | 2.80 | 1.83 | 2.23 | 1.23 | 0.714 | |||||
| balance sheet | |||||||||||
| Interbank Loans | EUR mil | 29.8 | 33.8 | 32.1 | 28.1 | 28.9 | |||||
| Customer Loans | EUR mil | 75.0 | 73.4 | 75.8 | 78.5 | 83.1 | |||||
| Investments | EUR mil | 0.611 | 0.611 | 0.611 | 0.611 | 0.610 | ... | ||||
| Total Assets | EUR mil | 117 | 119 | 120 | 121 | 126 | |||||
| Shareholders' Equity | EUR mil | 21.0 | 22.8 | 25.0 | 26.2 | 26.2 | |||||
| Customer Deposits | EUR mil | 86.3 | 85.4 | 84.9 | 84.3 | 89.6 | |||||
| ratios | |||||||||||
| ROE | % | 14.2 | 8.33 | 9.30 | 4.78 | 2.72 | |||||
| ROA | % | 2.38 | 1.55 | 1.86 | 1.02 | 0.578 | |||||
| Costs (As % Of Assets) | % | 5.93 | 5.94 | 6.71 | 6.23 | 5.99 | |||||
| Costs (As % Of Income) | % | 78.9 | 71.5 | 70.7 | 72.8 | 72.9 | |||||
| Net Interest Margin | % | 3.72 | 4.00 | 4.11 | 4.35 | 4.63 | |||||
| Interest Income (As % Of Revenues) | % | 49.5 | 48.1 | 43.3 | 50.8 | 56.3 | |||||
| Fee Income (As % Of Revenues) | % | 21.8 | 18.4 | 15.7 | 18.3 | 16.9 | |||||
| Staff Cost (As % Of Total Cost) | % | 59.2 | 58.7 | 52.2 | 59.1 | 56.2 | |||||
| Equity (As % Of Assets) | % | 18.0 | 19.1 | 20.8 | 21.7 | 20.8 | |||||
| Loans (As % Of Deposits) | % | 86.9 | 86.0 | 89.4 | 93.0 | 92.7 | |||||
| Loans (As % Assets) | % | 64.0 | 61.5 | 63.0 | 65.0 | 65.8 | |||||
| valuation | |||||||||||
| Book Value Per Share Growth | % | ... | 0.854 | 8.42 | 4.10 | 6.45 | 8.95 |
| income statement | Unit | 2013 | 2014 | 2015 | 2016 | 2017 | 2018 | 2019 | 2020 | 2021 | 2022 |
| income statement | |||||||||||
| Interest Income | EUR mil | 5.48 | 5.45 | 5.49 | 5.70 | 6.08 | |||||
| Interest Cost | EUR mil | 1.11 | 0.713 | 0.559 | 0.448 | 0.360 | |||||
| Net Interest Income | EUR mil | 4.37 | 4.74 | 4.93 | 5.25 | 5.72 | |||||
| Net Fee Income | EUR mil | 1.92 | 1.81 | 1.79 | 1.89 | 1.72 | |||||
| Fee Income | EUR mil | 2.39 | 2.28 | 2.40 | 2.40 | 2.22 | |||||
| Fee Expense | EUR mil | 0.470 | 0.470 | 0.604 | 0.507 | 0.504 | |||||
| Other Income | EUR mil | 2.54 | 3.29 | 4.67 | 3.19 | 2.72 | |||||
| Total Revenues | EUR mil | 8.83 | 9.84 | 11.4 | 10.3 | 10.2 | |||||
| Staff Cost | EUR mil | 4.12 | 4.13 | 4.20 | 4.44 | 4.16 | |||||
| Depreciation | EUR mil | 0.742 | 0.860 | 1.60 | 0.853 | 1.00 | |||||
| Other Cost | EUR mil | 2.10 | 2.05 | 2.25 | 2.22 | 2.24 | |||||
| Operating Cost | EUR mil | 6.96 | 7.03 | 8.05 | 7.52 | 7.40 | |||||
| Operating Profit | EUR mil | 3.16 | 2.51 | 3.02 | 1.76 | 1.01 | |||||
| Provisions | EUR mil | 0.125 | 0.054 | 0.035 | 0.057 | 0.040 | |||||
| Pre-Tax Profit | EUR mil | 3.04 | 2.46 | 2.98 | 1.70 | 0.966 | |||||
| Tax | EUR mil | 0.239 | 0.628 | 0.755 | 0.477 | 0.252 | |||||
| Net Profit | EUR mil | 2.80 | 1.83 | 2.23 | 1.23 | 0.714 | |||||
| growth rates | |||||||||||
| Net Interest Income Growth | % | ... | 0.854 | 8.42 | 4.10 | 6.45 | 8.95 | ||||
| Net Fee Income Growth | % | ... | -3.95 | -5.94 | -0.720 | 5.41 | -9.00 | ||||
| Total Revenue Growth | % | ... | 6.20 | 11.5 | 15.8 | -9.30 | -1.67 | ||||
| Operating Cost Growth | % | ... | 15.3 | 0.991 | 14.4 | -6.61 | -1.52 | ||||
| Operating Profit Growth | % | ... | 23.5 | -20.6 | 20.1 | -41.6 | -42.8 | ||||
| Pre-Tax Profit Growth | % | ... | 23.9 | -19.1 | 21.3 | -42.9 | -43.3 | ||||
| Net Profit Growth | % | ... | 111 | -34.6 | 21.7 | -44.9 | -41.8 |
| balance sheet | Unit | 2013 | 2014 | 2015 | 2016 | 2017 | 2018 | 2019 | 2020 | 2021 | 2022 |
| balance sheet | |||||||||||
| Cash & Cash Equivalents | EUR mil | 2.81 | 2.71 | 2.91 | 4.19 | 4.78 | |||||
| Interbank Loans | EUR mil | 29.8 | 33.8 | 32.1 | 28.1 | 28.9 | |||||
| Customer Loans | EUR mil | 75.0 | 73.4 | 75.8 | 78.5 | 83.1 | |||||
| Investments | EUR mil | 0.611 | 0.611 | 0.611 | 0.611 | 0.610 | ... | ||||
| Property and Equipment | EUR mil | 6.92 | 6.73 | 7.29 | 7.44 | 7.28 | |||||
| Intangible Assets | EUR mil | 0.673 | 0.564 | 0.474 | 0.315 | 0.193 | |||||
| Total Assets | EUR mil | 117 | 119 | 120 | 121 | 126 | |||||
| Shareholders' Equity | EUR mil | 21.0 | 22.8 | 25.0 | 26.2 | 26.2 | |||||
| Of Which Minority Interest | EUR mil | 0 | 0 | 0 | 0 | 0 | |||||
| Liabilities | EUR mil | 96.1 | 96.6 | 95.3 | 94.6 | 100 | |||||
| Customer Deposits | EUR mil | 86.3 | 85.4 | 84.9 | 84.3 | 89.6 | |||||
| growth rates | |||||||||||
| Customer Loan Growth | % | ... | 1.48 | -2.07 | 3.26 | 3.48 | 5.85 | ||||
| Total Asset Growth | % | ... | -0.377 | 2.00 | 0.761 | 0.356 | 4.56 | ||||
| Shareholders' Equity Growth | % | ... | 15.3 | 8.56 | 9.63 | 4.79 | 0.002 | ||||
| Customer Deposit Growth | % | ... | -3.72 | -1.07 | -0.652 | -0.617 | 6.25 |
| ratios | Unit | 2013 | 2014 | 2015 | 2016 | 2017 | 2018 | 2019 | 2020 | 2021 | 2022 |
| ROE | % | 14.2 | 8.33 | 9.30 | 4.78 | 2.72 | |||||
| ROTE | % | 14.5 | 8.58 | 9.50 | 4.86 | 2.75 | |||||
| ROA | % | 2.38 | 1.55 | 1.86 | 1.02 | 0.578 | |||||
| Return on Loans | % | 3.76 | 2.46 | 2.98 | 1.59 | 0.884 | |||||
| Costs (As % Of Assets) | % | 5.93 | 5.94 | 6.71 | 6.23 | 5.99 | |||||
| Costs (As % Of Income) | % | 78.9 | 71.5 | 70.7 | 72.8 | 72.9 | |||||
| Costs (As % Of Loans) | % | 9.35 | 9.47 | 10.8 | 9.74 | 9.16 | |||||
| Costs (As % Of Loans & Deposits) | % | ... | 4.29 | 4.39 | 5.04 | 4.65 | 4.41 | ||||
| Net Interest Margin | % | 3.72 | 4.00 | 4.11 | 4.35 | 4.63 | |||||
| Interest Spread | % | 3.53 | 3.87 | 4.00 | 4.25 | 4.55 | |||||
| Asset Yield | % | 4.67 | 4.61 | 4.58 | 4.72 | 4.92 | |||||
| Cost Of Liabilities | % | 1.14 | 0.740 | 0.582 | 0.472 | 0.370 | |||||
| Interest Income (As % Of Revenues) | % | 49.5 | 48.1 | 43.3 | 50.8 | 56.3 | |||||
| Fee Income (As % Of Revenues) | % | 21.8 | 18.4 | 15.7 | 18.3 | 16.9 | |||||
| Other Income (As % Of Revenues) | % | 28.7 | 33.5 | 41.0 | 30.9 | 26.8 | |||||
| Staff Cost (As % Of Total Cost) | % | 59.2 | 58.7 | 52.2 | 59.1 | 56.2 | |||||
| Equity (As % Of Assets) | % | 18.0 | 19.1 | 20.8 | 21.7 | 20.8 | |||||
| Equity (As % Of Loans) | % | 28.1 | 31.1 | 33.0 | 33.4 | 31.6 | |||||
| Loans (As % Of Deposits) | % | 86.9 | 86.0 | 89.4 | 93.0 | 92.7 | |||||
| Loans (As % Assets) | % | 64.0 | 61.5 | 63.0 | 65.0 | 65.8 | |||||
| Cost of Provisions (As % Of Loans) | % | 0.168 | 0.073 | 0.047 | 0.074 | 0.049 |
Get all company financials in excel:


WSK Bank has been growing its revenues and asset by -0.257% and 2.97% a year on average in the last 3 years. Its loans and deposits have grown by 1.73% and 3.00% a year during that time and loans to deposits ratio reached 89.6% at the end of 2022. The company achieved an average return on equity of 2.44% in the last three years with net profit growing -25.0% a year on average. In terms of operating efficiency, its cost to income ratio reached 74.6% in 2022, compared to 75.5% average in the last three years.
Equity represented 20.8% of total assets or 33.2% of loans at the end of 2022. WSK Bank's non-performing loans were of total loans while provisions covered some of NPLs at the end of 2022.
 Helgi Library