| Profit Statement |
| Balance Sheet |
| Ratios |
| Valuation |
Get all company financials in excel:
Get all company financials in excel:
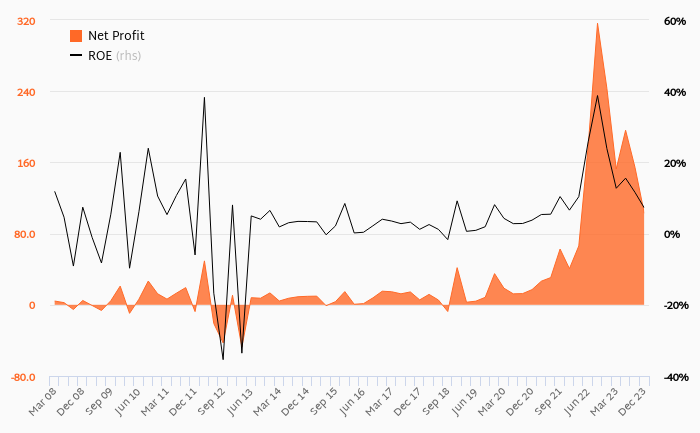
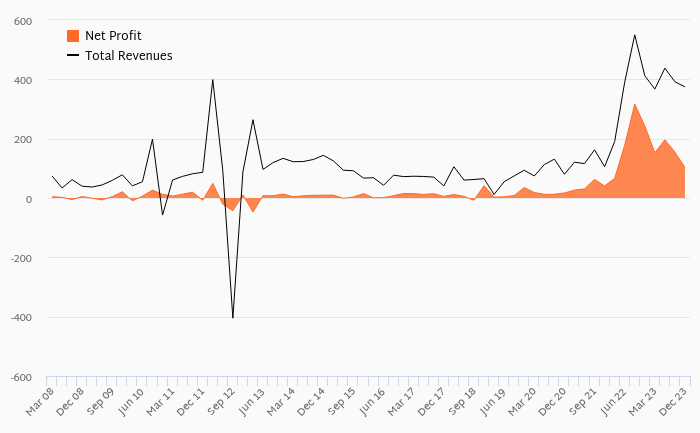
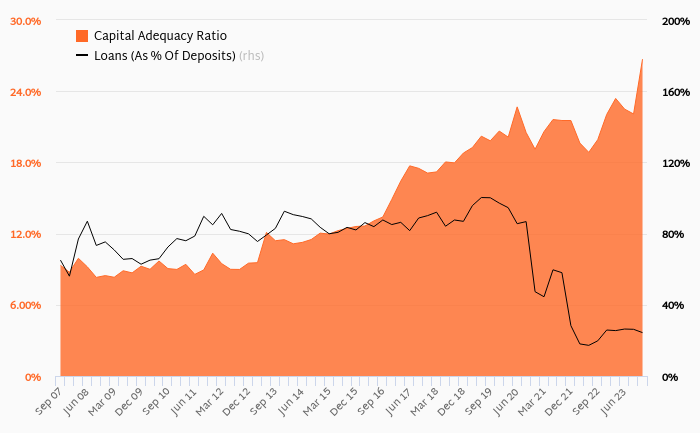
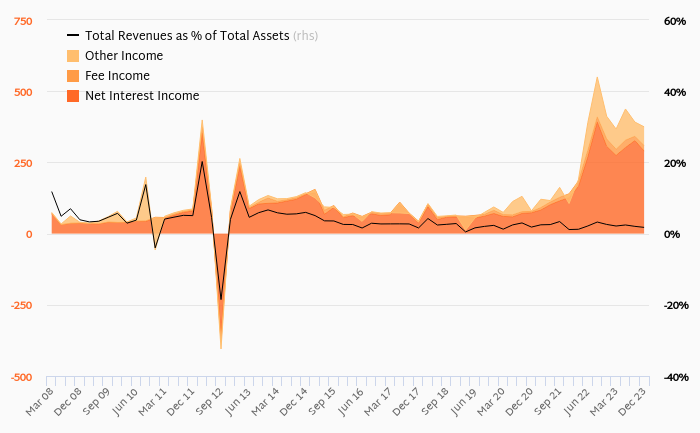

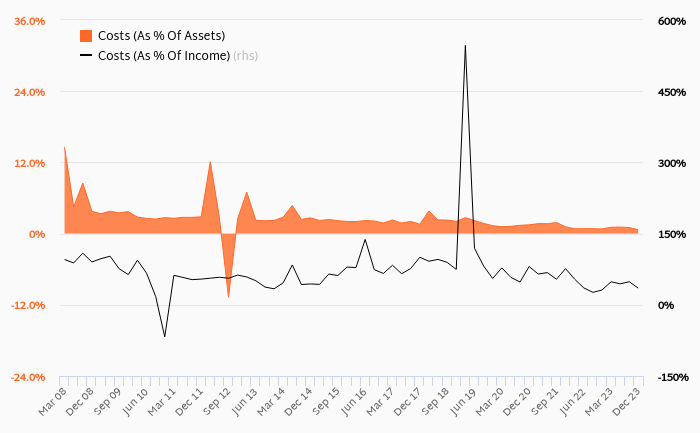

BAWAG Group has been growing its revenues and asset by 7.76% and 9.75% a year on average in the last 3 years. Its loans and deposits have grown by 12.3% and 13.6% a year during that time and loans to deposits ratio reached 99.5% at the end of 2017. The company achieved an average return on equity of 14.5% in the last three years with net profit growing 14.0% a year on average. In terms of operating efficiency, its cost to income ratio reached 46.5% in 2017, compared to 45.3% average in the last three years.
Equity represented 7.84% of total assets or 11.7% of loans at the end of 2017. BAWAG Group's non-performing loans were 2.30% of total loans while provisions covered some 38.6% of NPLs at the end of 2017.
BAWAG Group stock traded at 44.5 per share at the end of 2017 resulting in a market capitalization of USD 5,330 mil. Over the previous three years, stock price rose by 0% or 0% a year on average. That’s compared to an average ROE of 14.5% the bank generated for its shareholders. This closing price put stock at a 12-month trailing price to earnings (PE) of 9.53x and price to book value (PBV) of 1.23x in 2017.
 Helgi Library