By Helgi Library - February 16, 2024
CSOB's customer deposits reached CZK 1,494,567 mil in 2023-09-30, up 2.60% compared to the previous year. Czech banking sector ...
By Helgi Library - February 16, 2024
CSOB made a net profit of CZK 1,831 mil in the fourth quarter of 2023, up 644% when compared to the same period of last year. ...
By Helgi Library - February 16, 2024
CSOB made a net profit of CZK 1,831 mil under revenues of CZK 10,620 mil in the fourth quarter of 2023, up 644% and 64.2% ...
| Profit Statement | 2021 | 2022 | 2023 | |
| Net Interest Income | CZK mil | 22,900 | 31,062 | 29,045 |
| Net Fee Income | CZK mil | 7,828 | 8,041 | 8,925 |
| Other Income | CZK mil | 4,996 | 1,371 | 3,324 |
| Total Revenues | CZK mil | 35,724 | 40,474 | 41,294 |
| Staff Cost | CZK mil | 9,512 | 10,109 | 10,626 |
| Operating Profit | CZK mil | 15,890 | 18,487 | 18,705 |
| Provisions | CZK mil | -3,253 | 1,497 | 1,376 |
| Net Profit | CZK mil | 16,160 | 14,571 | 15,436 |
| Balance Sheet | 2021 | 2022 | 2023 | |
| Interbank Loans | CZK mil | 606,356 | 465,010 | 536,551 |
| Customer Loans | CZK mil | 816,771 | 860,526 | 904,446 |
| Investments | CZK mil | 201,526 | 249,225 | 63,202 |
| Total Assets | CZK mil | 1,805,479 | 1,805,617 | 1,869,032 |
| Shareholders' Equity | CZK mil | 117,378 | 100,978 | 114,481 |
| Interbank Borrowing | CZK mil | 25,057 | 43,708 | 260,648 |
| Customer Deposits | CZK mil | 1,156,902 | 1,231,800 | 1,336,648 |
| Issued Debt Securities | CZK mil | 421,603 | 305,507 | 70,145 |
| Ratios | 2021 | 2022 | 2023 | |
| ROE | % | 14.4 | 13.3 | 14.3 |
| ROA | % | 0.907 | 0.807 | 0.840 |
| Costs (As % Of Assets) | % | 1.11 | 1.22 | 1.23 |
| Costs (As % Of Income) | % | 55.5 | 54.3 | 54.7 |
| Capital Adequacy Ratio | % | 22.7 | 20.2 | 19.7 |
| Net Interest Margin | % | 1.29 | 1.72 | 1.58 |
| Loans (As % Of Deposits) | % | 70.6 | 69.9 | 67.7 |
| NPLs (As % Of Loans) | % | 1.95 | 1.81 | 1.51 |
| Provisions (As % Of NPLs) | % | 49.4 | 44.6 | 45.2 |
| Growth Rates | 2021 | 2022 | 2023 | |
| Total Revenue Growth | % | 1.34 | 13.3 | 2.03 |
| Operating Cost Growth | % | 3.02 | 10.9 | 2.74 |
| Operating Profit Growth | % | -0.681 | 16.3 | 1.18 |
| Net Profit Growth | % | 90.4 | -9.83 | 5.94 |
| Customer Loan Growth | % | -12.6 | 5.36 | 5.10 |
| Total Asset Growth | % | 2.79 | 0.008 | 3.51 |
| Customer Deposit Growth | % | 7.60 | 6.47 | 8.51 |
| Shareholders' Equity Growth | % | 9.71 | -14.0 | 13.4 |
| Employees | 8,089 | 8,069 | 8,036 | |
Get all company financials in excel:
| summary | Unit | 1994 | 1995 | 1996 | 1997 | 1998 | 1999 | 2000 | 2001 | 2002 | 2003 | 2004 | 2005 | 2006 | 2007 | 2008 | 2009 | 2010 | 2011 | 2012 | 2013 | 2014 | 2015 | 2016 | 2017 | 2018 | 2019 | 2020 | 2021 | 2022 | 2023 |
| income statement | |||||||||||||||||||||||||||||||
| Net Interest Income | CZK mil | ... | ... | ... | 22,692 | 26,016 | 32,004 | 26,102 | 22,900 | ||||||||||||||||||||||
| Total Revenues | CZK mil | ... | ... | ... | 37,199 | 37,102 | 42,404 | 35,251 | 35,724 | ||||||||||||||||||||||
| Operating Profit | CZK mil | ... | ... | ... | 20,947 | 19,333 | 23,370 | 15,999 | 15,890 | ||||||||||||||||||||||
| Net Profit | CZK mil | 17,517 | 15,757 | 19,691 | 8,488 | 16,160 | |||||||||||||||||||||||||
| balance sheet | |||||||||||||||||||||||||||||||
| Interbank Loans | CZK mil | ... | ... | ... | 485,267 | 532,823 | 621,193 | 645,747 | 606,356 | ||||||||||||||||||||||
| Customer Loans | CZK mil | 674,729 | 690,610 | 838,018 | 934,195 | 816,771 | |||||||||||||||||||||||||
| Investments | CZK mil | ... | ... | ... | 70,372 | 85,564 | 88,519 | 99,420 | 201,526 | ||||||||||||||||||||||
| Total Assets | CZK mil | 1,314,399 | 1,377,568 | 1,630,597 | 1,756,440 | 1,805,479 | |||||||||||||||||||||||||
| Shareholders' Equity | CZK mil | 92,456 | 91,546 | 98,208 | 106,992 | 117,378 | |||||||||||||||||||||||||
| Interbank Borrowing | CZK mil | ... | ... | ... | 68,502 | 54,653 | 47,346 | 57,422 | 25,057 | ||||||||||||||||||||||
| Customer Deposits | CZK mil | 744,448 | 792,625 | 959,951 | 1,075,138 | 1,156,902 | |||||||||||||||||||||||||
| Issued Debt Securities | CZK mil | ... | ... | ... | 350,136 | 365,311 | 415,818 | 425,293 | 421,603 | ||||||||||||||||||||||
| ratios | |||||||||||||||||||||||||||||||
| ROE | % | ... | 19.3 | 17.1 | 20.8 | 8.27 | 14.4 | ||||||||||||||||||||||||
| ROA | % | ... | 1.46 | 1.17 | 1.31 | 0.501 | 0.907 | ||||||||||||||||||||||||
| Costs (As % Of Assets) | % | ... | ... | ... | 1.35 | 1.32 | 1.27 | 1.14 | 1.11 | ||||||||||||||||||||||
| Costs (As % Of Income) | % | ... | ... | ... | 43.7 | 47.9 | 44.9 | 54.6 | 55.5 | ||||||||||||||||||||||
| Capital Adequacy Ratio | % | 17.2 | 18.0 | 19.2 | 24.2 | 22.7 | |||||||||||||||||||||||||
| Net Interest Margin | % | ... | ... | ... | 1.89 | 1.93 | 2.13 | 1.54 | 1.29 | ||||||||||||||||||||||
| Interest Income (As % Of Revenues) | % | ... | ... | ... | 61.0 | 70.1 | 75.5 | 74.0 | 64.1 | ||||||||||||||||||||||
| Fee Income (As % Of Revenues) | % | ... | ... | ... | 17.2 | 21.6 | 20.1 | 21.5 | 21.9 | ||||||||||||||||||||||
| Staff Cost (As % Of Total Cost) | % | ... | ... | ... | 48.7 | 49.0 | 49.0 | 48.1 | 48.0 | ||||||||||||||||||||||
| Equity (As % Of Assets) | % | 7.03 | 6.65 | 6.02 | 6.09 | 6.50 | |||||||||||||||||||||||||
| Loans (As % Of Deposits) | % | 90.6 | 87.1 | 87.3 | 86.9 | 70.6 | |||||||||||||||||||||||||
| Loans (As % Assets) | % | 51.3 | 50.1 | 51.4 | 53.2 | 45.2 | |||||||||||||||||||||||||
| NPLs (As % Of Loans) | % | ... | ... | ... | ... | ... | ... | ... | ... | ... | 2.04 | 3.06 | 2.18 | 2.00 | 1.95 | ||||||||||||||||
| Provisions (As % Of NPLs) | % | ... | ... | ... | ... | ... | ... | ... | ... | ... | 58.3 | 45.7 | 47.3 | 48.7 | 49.4 | ||||||||||||||||
| valuation | |||||||||||||||||||||||||||||||
| Book Value Per Share Growth | % | ... | ... | ... | ... | 2.06 | 14.6 | 23.0 | -18.4 | -12.3 |
| income statement | Unit | 1994 | 1995 | 1996 | 1997 | 1998 | 1999 | 2000 | 2001 | 2002 | 2003 | 2004 | 2005 | 2006 | 2007 | 2008 | 2009 | 2010 | 2011 | 2012 | 2013 | 2014 | 2015 | 2016 | 2017 | 2018 | 2019 | 2020 | 2021 | 2022 | 2023 |
| income statement | |||||||||||||||||||||||||||||||
| Interest Income | CZK mil | ... | ... | ... | 25,979 | 33,764 | 46,820 | 35,680 | 36,975 | ||||||||||||||||||||||
| Interest Cost | CZK mil | ... | ... | ... | 3,287 | 7,748 | 14,816 | 9,578 | 14,075 | ||||||||||||||||||||||
| Net Interest Income | CZK mil | ... | ... | ... | 22,692 | 26,016 | 32,004 | 26,102 | 22,900 | ||||||||||||||||||||||
| Net Fee Income | CZK mil | ... | ... | ... | 6,396 | 8,022 | 8,518 | 7,591 | 7,828 | ||||||||||||||||||||||
| Fee Income | CZK mil | ... | ... | ... | ... | ... | ... | ... | ... | ... | ... | ... | ... | ... | ... | ... | ... | ... | ... | ... | ... | ... | ... | ... | ... | ... | ... | ... | 13,227 | ||
| Fee Expense | CZK mil | ... | ... | ... | ... | ... | ... | ... | ... | ... | ... | ... | ... | ... | ... | ... | ... | ... | ... | ... | ... | ... | ... | ... | ... | ... | ... | ... | 5,399 | ||
| Other Income | CZK mil | ... | ... | ... | 8,111 | 3,064 | 1,882 | 1,558 | 4,996 | ||||||||||||||||||||||
| Total Revenues | CZK mil | ... | ... | ... | 37,199 | 37,102 | 42,404 | 35,251 | 35,724 | ||||||||||||||||||||||
| Staff Cost | CZK mil | ... | ... | ... | 7,920 | 8,709 | 9,333 | 9,254 | 9,512 | ||||||||||||||||||||||
| Depreciation | CZK mil | ... | ... | ... | 1,380 | 1,455 | 2,256 | 2,155 | 2,342 | ||||||||||||||||||||||
| Other Cost | CZK mil | ... | ... | ... | 6,952 | 7,605 | 7,445 | 7,843 | 7,980 | ||||||||||||||||||||||
| Operating Cost | CZK mil | ... | ... | ... | 16,252 | 17,769 | 19,034 | 19,252 | 19,834 | ||||||||||||||||||||||
| Operating Profit | CZK mil | ... | ... | ... | 20,947 | 19,333 | 23,370 | 15,999 | 15,890 | ||||||||||||||||||||||
| Provisions | CZK mil | ... | ... | ... | 615 | 983 | 403 | 5,926 | -3,253 | ||||||||||||||||||||||
| Extra and Other Cost | CZK mil | ... | ... | ... | -637 | -581 | -218 | 43.0 | 64.0 | ||||||||||||||||||||||
| Pre-Tax Profit | CZK mil | 20,969 | 18,931 | 23,185 | 10,030 | 19,079 | |||||||||||||||||||||||||
| Tax | CZK mil | 3,453 | 3,174 | 3,494 | 1,542 | 2,919 | |||||||||||||||||||||||||
| Minorities | CZK mil | -1.00 | 0 | 0 | 0 | 0 | |||||||||||||||||||||||||
| Net Profit | CZK mil | 17,517 | 15,757 | 19,691 | 8,488 | 16,160 | |||||||||||||||||||||||||
| Net Profit Avail. to Common | CZK mil | 17,517 | 15,757 | 19,691 | 8,488 | 16,160 | |||||||||||||||||||||||||
| growth rates | |||||||||||||||||||||||||||||||
| Net Interest Income Growth | % | ... | ... | ... | ... | 2.06 | 14.6 | 23.0 | -18.4 | -12.3 | |||||||||||||||||||||
| Net Fee Income Growth | % | ... | ... | ... | ... | 2.86 | 25.4 | 6.18 | -10.9 | 3.12 | |||||||||||||||||||||
| Total Revenue Growth | % | ... | ... | ... | ... | 9.27 | -0.261 | 14.3 | -16.9 | 1.34 | |||||||||||||||||||||
| Operating Cost Growth | % | ... | ... | ... | ... | 3.84 | 9.33 | 7.12 | 1.15 | 3.02 | |||||||||||||||||||||
| Operating Profit Growth | % | ... | ... | ... | ... | 13.9 | -7.70 | 20.9 | -31.5 | -0.681 | |||||||||||||||||||||
| Pre-Tax Profit Growth | % | ... | 14.1 | -9.72 | 22.5 | -56.7 | 90.2 | ||||||||||||||||||||||||
| Net Profit Growth | % | ... | 15.7 | -10.0 | 25.0 | -56.9 | 90.4 | ||||||||||||||||||||||||
| market share | |||||||||||||||||||||||||||||||
| Market Share in Revenues | % | ... | ... | ... | 20.8 | 19.5 | 21.0 | 19.5 | 19.4 | ... | |||||||||||||||||||||
| Market Share in Net Profit | % | 23.2 | 19.3 | 21.6 | 17.9 | 23.0 | |||||||||||||||||||||||||
| Market Share in Employees | % | ... | ... | ... | ... | 20.6 | 20.6 | 20.7 | 20.5 | 20.4 | ... | ||||||||||||||||||||
| Market Share in Bank Cards | % | ... | ... | ... | ... | ... | ... | ... | ... | ... | ... | ... | ... | ... | ... | ... | ... | ... | ... | ... | ... | ... | ... | ... | ... | ... | ... | ... | ... | ... | |
| Market Share in Branches | % | ... | ... | ... | ... | ... | ... | ... | ... | 13.9 | 12.0 | 11.9 | 12.6 | 13.0 | ... |
| balance sheet | Unit | 1994 | 1995 | 1996 | 1997 | 1998 | 1999 | 2000 | 2001 | 2002 | 2003 | 2004 | 2005 | 2006 | 2007 | 2008 | 2009 | 2010 | 2011 | 2012 | 2013 | 2014 | 2015 | 2016 | 2017 | 2018 | 2019 | 2020 | 2021 | 2022 | 2023 |
| balance sheet | |||||||||||||||||||||||||||||||
| Cash & Cash Equivalents | CZK mil | ... | ... | ... | 54,499 | 38,610 | 47,725 | 29,595 | 39,762 | ||||||||||||||||||||||
| Interbank Loans | CZK mil | ... | ... | ... | 485,267 | 532,823 | 621,193 | 645,747 | 606,356 | ||||||||||||||||||||||
| Customer Loans | CZK mil | 674,729 | 690,610 | 838,018 | 934,195 | 816,771 | |||||||||||||||||||||||||
| Retail Loans | CZK mil | ... | ... | ... | ... | ... | ... | ... | ... | 310,500 | 449,100 | 471,000 | 492,279 | 522,336 | |||||||||||||||||
| Mortgage Loans | CZK mil | ... | ... | ... | ... | ... | ... | ... | ... | 282,400 | 417,700 | 437,200 | 458,162 | 487,177 | |||||||||||||||||
| Consumer Loans | CZK mil | ... | ... | ... | ... | ... | ... | ... | ... | 28,100 | 31,400 | 33,800 | 34,117 | 35,159 | |||||||||||||||||
| Corporate Loans | CZK mil | ... | ... | ... | ... | ... | ... | ... | ... | 191,000 | 292,100 | 309,700 | 300,125 | 312,775 | |||||||||||||||||
| Investments | CZK mil | ... | ... | ... | 70,372 | 85,564 | 88,519 | 99,420 | 201,526 | ||||||||||||||||||||||
| Property and Equipment | CZK mil | ... | ... | ... | ... | 11,024 | 10,355 | 14,417 | 14,690 | 13,643 | |||||||||||||||||||||
| Intangible Assets | CZK mil | ... | ... | ... | ... | ... | ... | ... | ... | ... | ... | ... | ... | ... | ... | ... | ... | ... | ... | ... | ... | ... | ... | ... | 5,816 | 5,770 | 10,918 | 10,767 | 11,164 | ||
| Total Assets | CZK mil | 1,314,399 | 1,377,568 | 1,630,597 | 1,756,440 | 1,805,479 | |||||||||||||||||||||||||
| Shareholders' Equity | CZK mil | 92,456 | 91,546 | 98,208 | 106,992 | 117,378 | |||||||||||||||||||||||||
| Of Which Minority Interest | CZK mil | ... | ... | ... | ... | ... | 0 | 0 | 0 | 0 | 0 | ||||||||||||||||||||
| Liabilities | CZK mil | 1,221,943 | 1,286,022 | 1,532,389 | 1,649,448 | 1,688,101 | |||||||||||||||||||||||||
| Interbank Borrowing | CZK mil | ... | ... | ... | 68,502 | 54,653 | 47,346 | 57,422 | 25,057 | ||||||||||||||||||||||
| Customer Deposits | CZK mil | 744,448 | 792,625 | 959,951 | 1,075,138 | 1,156,902 | |||||||||||||||||||||||||
| Sight Deposits | CZK mil | ... | ... | ... | ... | ... | ... | ... | ... | ... | ... | ... | ... | ... | ... | ... | ... | ... | ... | ... | ... | ... | ... | ... | ... | ... | ... | 652,900 | 705,000 | ||
| Term Deposits | CZK mil | ... | ... | ... | ... | ... | ... | ... | ... | ... | ... | ... | ... | ... | ... | ... | ... | ... | ... | ... | ... | ... | ... | ... | ... | ... | ... | 419,870 | 451,902 | ||
| Issued Debt Securities | CZK mil | ... | ... | ... | 350,136 | 365,311 | 415,818 | 425,293 | 421,603 | ||||||||||||||||||||||
| Subordinated Debt | CZK mil | ... | ... | ... | ... | ... | ... | ... | ... | ... | ... | ... | ... | ... | ... | ... | ... | ... | ... | ... | ... | ... | ... | ... | ... | ... | ... | ... | 19,439 | ||
| Other Liabilities | CZK mil | ... | ... | ... | 58,857 | 73,433 | 109,274 | 91,595 | 84,539 | ||||||||||||||||||||||
| asset quality | |||||||||||||||||||||||||||||||
| Non-Performing Loans | CZK mil | ... | ... | ... | ... | ... | ... | ... | ... | ... | 13,900 | 21,400 | 18,500 | 18,911 | 16,120 | ||||||||||||||||
| Gross Loans | CZK mil | ... | ... | ... | ... | ... | ... | ... | ... | 682,829 | 700,390 | 846,769 | 943,410 | 828,414 | |||||||||||||||||
| Risk-Weighted Assets | CZK mil | ... | ... | ... | ... | ... | ... | ... | ... | ... | ... | ... | ... | ... | ... | ... | ... | ... | ... | 403,151 | 383,254 | 391,461 | 410,027 | 412,628 | |||||||
| Total Provisions | CZK mil | ... | ... | ... | ... | ... | ... | ... | ... | 8,100 | 9,780 | 8,751 | 9,215 | 7,960 | |||||||||||||||||
| growth rates | |||||||||||||||||||||||||||||||
| Customer Loan Growth | % | ... | 25.6 | 2.35 | 21.3 | 11.5 | -12.6 | ||||||||||||||||||||||||
| Retail Loan Growth | % | ... | ... | ... | ... | ... | ... | ... | ... | ... | -3.14 | 44.6 | 4.88 | 4.52 | 6.11 | ||||||||||||||||
| Mortgage Loan Growth | % | ... | ... | ... | ... | ... | ... | ... | ... | ... | 10.0 | 47.9 | 4.67 | 4.79 | 6.33 | ||||||||||||||||
| Consumer Loan Growth | % | ... | ... | ... | ... | ... | ... | ... | ... | ... | -56.0 | 11.7 | 7.64 | 0.938 | 3.05 | ||||||||||||||||
| Corporate Loan Growth | % | ... | ... | ... | ... | ... | ... | ... | ... | ... | 3.08 | 52.9 | 6.03 | -3.09 | 4.21 | ||||||||||||||||
| Total Asset Growth | % | ... | 21.1 | 4.81 | 18.4 | 7.72 | 2.79 | ||||||||||||||||||||||||
| Shareholders' Equity Growth | % | ... | 4.19 | -0.984 | 7.28 | 8.94 | 9.71 | ||||||||||||||||||||||||
| Customer Deposit Growth | % | ... | 10.1 | 6.47 | 21.1 | 12.0 | 7.60 | ||||||||||||||||||||||||
| market share | |||||||||||||||||||||||||||||||
| Market Share in Customer Loans | % | 21.9 | 20.9 | 24.3 | 26.0 | 21.2 | ... | ||||||||||||||||||||||||
| Market Share in Corporate Loans | % | ... | ... | ... | ... | ... | ... | ... | ... | 18.7 | 27.0 | 27.7 | 26.7 | 26.3 | |||||||||||||||||
| Market Share in Retail Loans | % | ... | ... | ... | ... | ... | ... | ... | ... | 20.3 | 27.3 | 27.0 | 26.5 | 25.6 | |||||||||||||||||
| Market Share in Consumer Loans | % | ... | ... | ... | ... | ... | ... | ... | ... | 7.36 | 7.85 | 8.14 | 8.07 | 7.84 | ... | ||||||||||||||||
| Market Share in Mortgage Loans | % | ... | ... | ... | ... | ... | ... | ... | ... | 24.6 | 33.5 | 32.9 | 31.9 | 30.5 | |||||||||||||||||
| Market Share in Total Assets | % | 18.8 | 18.9 | 21.6 | 22.0 | 21.2 | ... | ||||||||||||||||||||||||
| Market Share in Customer Deposits | % | 17.9 | 17.8 | 20.3 | 20.8 | 21.0 |
| ratios | Unit | 1994 | 1995 | 1996 | 1997 | 1998 | 1999 | 2000 | 2001 | 2002 | 2003 | 2004 | 2005 | 2006 | 2007 | 2008 | 2009 | 2010 | 2011 | 2012 | 2013 | 2014 | 2015 | 2016 | 2017 | 2018 | 2019 | 2020 | 2021 | 2022 | 2023 |
| ROE | % | ... | 19.3 | 17.1 | 20.8 | 8.27 | 14.4 | ||||||||||||||||||||||||
| ROTE | % | ... | ... | ... | ... | ... | ... | ... | ... | ... | ... | ... | ... | ... | ... | ... | ... | ... | ... | ... | ... | ... | ... | ... | ... | 18.3 | 22.8 | 9.25 | 16.0 | ||
| ROE (@ 15% of RWA) | % | ... | ... | ... | ... | ... | ... | ... | ... | ... | ... | ... | ... | ... | ... | ... | ... | ... | ... | ... | 29.8 | 26.7 | 33.9 | 14.1 | 26.2 | ||||||
| ROA | % | ... | 1.46 | 1.17 | 1.31 | 0.501 | 0.907 | ||||||||||||||||||||||||
| Return on Loans | % | 2.89 | 2.31 | 2.58 | 0.958 | 1.85 | |||||||||||||||||||||||||
| Operating Profit (As % of RWA) | % | ... | ... | ... | ... | ... | ... | ... | ... | ... | ... | ... | ... | ... | ... | ... | ... | ... | ... | ... | 5.35 | 4.92 | 6.03 | 3.99 | 3.86 | ||||||
| Costs (As % Of Assets) | % | ... | ... | ... | 1.35 | 1.32 | 1.27 | 1.14 | 1.11 | ||||||||||||||||||||||
| Costs (As % Of Income) | % | ... | ... | ... | 43.7 | 47.9 | 44.9 | 54.6 | 55.5 | ||||||||||||||||||||||
| Costs (As % Of Loans) | % | ... | ... | ... | 2.68 | 2.60 | 2.49 | 2.17 | 2.27 | ||||||||||||||||||||||
| Costs (As % Of Loans & Deposits) | % | ... | ... | ... | 1.23 | 1.22 | 1.16 | 1.01 | 0.996 | ||||||||||||||||||||||
| Capital Adequacy Ratio | % | 17.2 | 18.0 | 19.2 | 24.2 | 22.7 | |||||||||||||||||||||||||
| Tier 1 Ratio | % | ... | ... | ... | ... | ... | ... | ... | ... | ... | ... | ... | ... | ... | ... | 17.2 | 18.0 | 19.2 | 23.7 | 22.4 | |||||||||||
| Net Interest Margin | % | ... | ... | ... | 1.89 | 1.93 | 2.13 | 1.54 | 1.29 | ||||||||||||||||||||||
| Interest Spread | % | ... | ... | ... | 1.87 | 1.89 | 2.06 | 1.50 | 1.23 | ||||||||||||||||||||||
| Asset Yield | % | ... | ... | ... | 2.16 | 2.51 | 3.11 | 2.11 | 2.08 | ||||||||||||||||||||||
| Revenues (As % of RWA) | % | ... | ... | ... | ... | ... | ... | ... | ... | ... | ... | ... | ... | ... | ... | ... | ... | ... | ... | ... | 9.50 | 9.44 | 10.9 | 8.80 | 8.69 | ||||||
| Cost Of Liabilities | % | ... | ... | ... | 0.296 | 0.618 | 1.05 | 0.602 | 0.843 | ||||||||||||||||||||||
| Interest Income (As % Of Revenues) | % | ... | ... | ... | 61.0 | 70.1 | 75.5 | 74.0 | 64.1 | ||||||||||||||||||||||
| Fee Income (As % Of Revenues) | % | ... | ... | ... | 17.2 | 21.6 | 20.1 | 21.5 | 21.9 | ||||||||||||||||||||||
| Other Income (As % Of Revenues) | % | ... | ... | ... | 21.8 | 8.26 | 4.44 | 4.42 | 14.0 | ||||||||||||||||||||||
| Staff Cost (As % Of Total Cost) | % | ... | ... | ... | 48.7 | 49.0 | 49.0 | 48.1 | 48.0 | ||||||||||||||||||||||
| Equity (As % Of Assets) | % | 7.03 | 6.65 | 6.02 | 6.09 | 6.50 | |||||||||||||||||||||||||
| Equity (As % Of Loans) | % | 13.7 | 13.3 | 11.7 | 11.5 | 14.4 | |||||||||||||||||||||||||
| Loans (As % Of Deposits) | % | 90.6 | 87.1 | 87.3 | 86.9 | 70.6 | |||||||||||||||||||||||||
| Loans (As % Assets) | % | 51.3 | 50.1 | 51.4 | 53.2 | 45.2 | |||||||||||||||||||||||||
| NPLs (As % Of Loans) | % | ... | ... | ... | ... | ... | ... | ... | ... | ... | 2.04 | 3.06 | 2.18 | 2.00 | 1.95 | ||||||||||||||||
| Provisions (As % Of NPLs) | % | ... | ... | ... | ... | ... | ... | ... | ... | ... | 58.3 | 45.7 | 47.3 | 48.7 | 49.4 | ||||||||||||||||
| Provisions (As % Of Loans) | % | ... | ... | ... | ... | ... | ... | ... | ... | 1.20 | 1.42 | 1.04 | 0.986 | 0.975 | |||||||||||||||||
| Cost of Provisions (As % Of Loans) | % | ... | ... | ... | 0.101 | 0.144 | 0.053 | 0.669 | -0.372 |
| other data | Unit | 1994 | 1995 | 1996 | 1997 | 1998 | 1999 | 2000 | 2001 | 2002 | 2003 | 2004 | 2005 | 2006 | 2007 | 2008 | 2009 | 2010 | 2011 | 2012 | 2013 | 2014 | 2015 | 2016 | 2017 | 2018 | 2019 | 2020 | 2021 | 2022 | 2023 |
| Branches | ... | ... | ... | ... | ... | ... | ... | ... | 270 | 235 | 225 | 212 | 208 | ||||||||||||||||||
| ATMs | ... | ... | ... | ... | ... | ... | ... | ... | 1,070 | 1,063 | 1,068 | 1,025 | 1,017 | ||||||||||||||||||
| ATMs (As % of Bank Branches) | % | ... | ... | ... | ... | ... | ... | ... | ... | 396 | 452 | 475 | 483 | 489 | |||||||||||||||||
| Employees | ... | ... | ... | ... | 8,615 | 8,623 | 8,626 | 8,349 | 8,089 | ||||||||||||||||||||||
| Employees Per Bank Branch | ... | ... | ... | ... | ... | ... | ... | ... | 31.9 | 36.7 | 38.3 | 39.4 | 38.9 | ||||||||||||||||||
| Cost Per Employee | USD per month | ... | ... | ... | ... | 3,265 | 3,847 | 4,000 | 4,198 | 4,522 | |||||||||||||||||||||
| Cost Per Employee (Local Currency) | CZK per month | ... | ... | ... | ... | 76,610 | 84,164 | 90,163 | 92,366 | 97,993 |
| customer breakdown | Unit | 1994 | 1995 | 1996 | 1997 | 1998 | 1999 | 2000 | 2001 | 2002 | 2003 | 2004 | 2005 | 2006 | 2007 | 2008 | 2009 | 2010 | 2011 | 2012 | 2013 | 2014 | 2015 | 2016 | 2017 | 2018 | 2019 | 2020 | 2021 | 2022 | 2023 |
| Customers | mil | ... | ... | ... | ... | ... | ... | 2.77 | 4.30 | 4.24 | 4.23 | 4.23 | |||||||||||||||||||
| Payment Cards | mil | ... | ... | ... | ... | ... | ... | ... | ... | ... | ... | ... | ... | ... | ... | ... | ... | ... | ... | ... | ... | ... | ... | ... | ... | ... | ... | ... | ... | ... | |
| Number of Mortgages | mil | ... | ... | ... | ... | ... | ... | ... | ... | ... | ... | ... | ... | ... | ... | ... | ... | ... | ... | ... | 0.203 | 0.288 | 0.303 | 0.317 | ... | ... | ... | ||||
| Average Size of Mortgage Loan | CZK | ... | ... | ... | ... | ... | ... | ... | ... | ... | ... | ... | ... | ... | ... | ... | ... | ... | ... | ... | 1,393,000 | 1,451,000 | 1,444,000 | 1,444,000 | ... | ... | ... | ||||
| Mortgages (As % of Total Clients) | % | ... | ... | ... | ... | ... | ... | ... | ... | ... | ... | ... | ... | ... | ... | ... | ... | ... | ... | ... | 7.32 | 6.69 | 7.14 | 7.50 | ... | ... | ... | ||||
| Payments Cards (As % of Total Clients) | % | ... | ... | ... | ... | ... | ... | ... | ... | ... | ... | ... | ... | ... | ... | ... | ... | ... | ... | ... | ... | ... | ... | ... | ... | ... | ... | ... | ... | ... | |
| Revenue per Customer (Local Currency) | CZK | ... | ... | ... | ... | ... | ... | 13,429 | 8,628 | 10,001 | 8,332 | 8,455 | |||||||||||||||||||
| Net Profit per Customer (Local Currency) | CZK | ... | ... | ... | ... | ... | ... | 6,324 | 3,664 | 4,644 | 2,006 | 3,825 | |||||||||||||||||||
| Loan per Customer (Local Currency) | CZK | ... | ... | ... | ... | ... | ... | 243,584 | 160,607 | 197,646 | 220,798 | 193,319 | |||||||||||||||||||
| Deposit per Customer (Local Currency) | CZK | ... | ... | ... | ... | ... | ... | 268,754 | 184,331 | 226,404 | 254,110 | 273,823 | |||||||||||||||||||
| Revenue per Customer | USD | ... | ... | ... | ... | ... | ... | 572 | 394 | 444 | 379 | 390 | |||||||||||||||||||
| Net Profit per Customer | USD | ... | ... | ... | ... | ... | ... | 269 | 167 | 206 | 91.2 | 177 | |||||||||||||||||||
| Loan per Customer | USD | ... | ... | ... | ... | ... | ... | 11,441 | 7,149 | 8,737 | 10,324 | 8,807 | |||||||||||||||||||
| Deposit per Customer | USD | ... | ... | ... | ... | ... | ... | 12,623 | 8,205 | 10,009 | 11,882 | 12,474 |
Get all company financials in excel:

By Helgi Library - February 16, 2024
CSOB's mortgage loans reached CZK 519,818 mil in 4Q2023, up 0.811% compared to the previous year. Czech banking sector provided mortgage loans of CZK 1,742 in 4Q2023, up 0.752% when compared to the last year. CSOB accounted for 29.8% of all mortgage loans...
By Helgi Library - February 16, 2024
CSOB's non-performing loans reached 1.51% of total loans at the end of 2023-12-31, down from 1.81% compared to the previous year. Historically, the NPL ratio hit an all time high of 5.13% in 2013-06-30 and an all time low of 1.51% in 2023-12-31. Provision c...
By Helgi Library - February 16, 2024
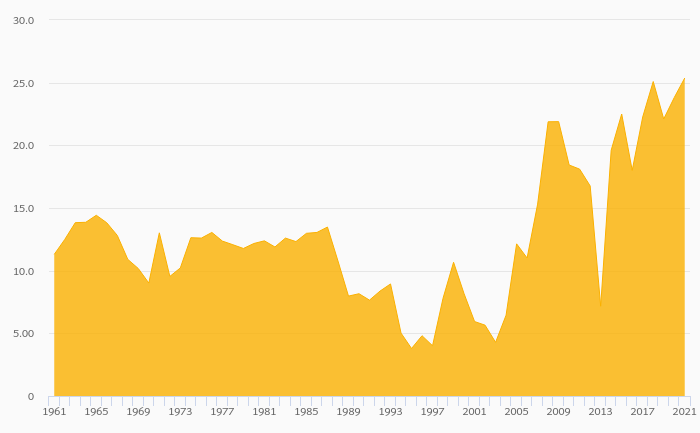
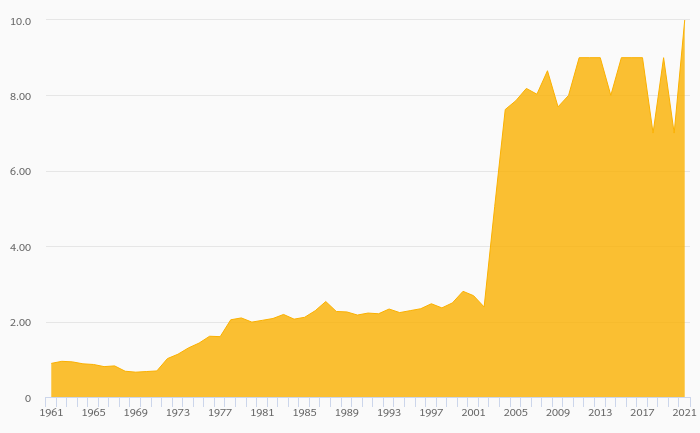
CSOB's net interest margin amounted to 1.51% in the fourth quarter of 2023, up from 1.39% when compared to the previous quarter. Historically, the bank’s net interest margin reached an all time high of 2.86% in 2Q2010 and an all time low of 1.11% in 2Q2...
By Helgi Library - February 16, 2024
CSOB's customer loans reached CZK 892,084 mil in 2023-09-30, up 1.67% compared to the previous year. Czech banking sector provided customer loans of CZK 4,290 in 2023-09-30, up 1.99% when compared to the last year. CSOB accounted for 20.8% of all customer...
By Helgi Library - September 29, 2023
Mortgage loans grew 6.80% yoy in the last 12 months and were up 1.13% qoq in the last quarter. At the end of September, mortgages formed 40.8% of total loans and 23.5% of GDP. Overall, CSOB was the largest mortgage lender with 30.4% of the ...
By Helgi Library - February 16, 2024
CSOB employed 8,036 persons in 2023-12-31, up 0.125% compared to the previous year. Historically, the bank's workforce hit an all time high of 10,511 persons in 2003-12-31 and an all time low of 6,750 in 2006-12-31. The bank operated a network of 198 branc...
By Helgi Library - February 16, 2024
CSOB's retail loans reached CZK 555,250 mil in the third quarter of 2023, up 0.778% compared to the previous year. Czech banking sector provided retail loans of CZK 2,222 bil in 3Q2023, up 0.843% when compared to the last year. CSOB accounted for 25.0% of...
By Helgi Library - February 16, 2024
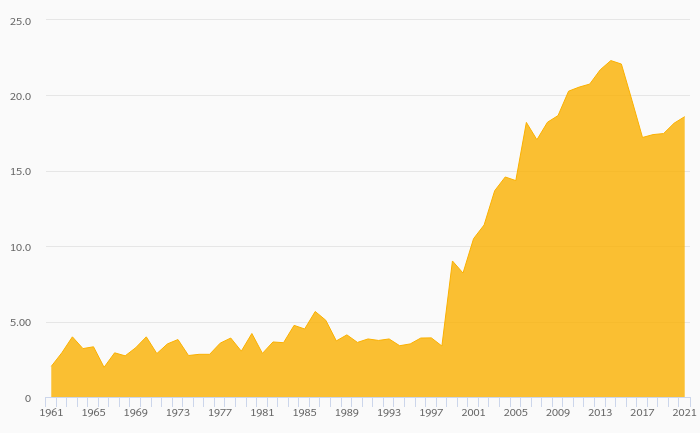
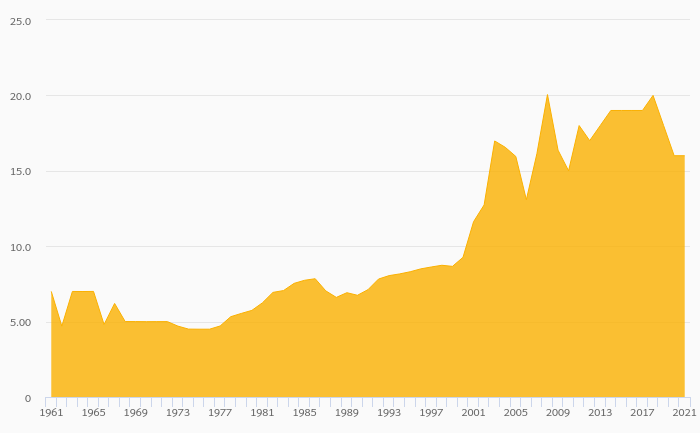
CSOB's cost to income ratio reached 53.4% in the fourth quarter of 2023, up from 52.9% when compared to the previous quarter. Historically, the bank’s costs reached an all time high of 433% of income in 3Q2008 and an all time low of 24.9% in 4Q2009. Wh...
By Helgi Library - February 16, 2024
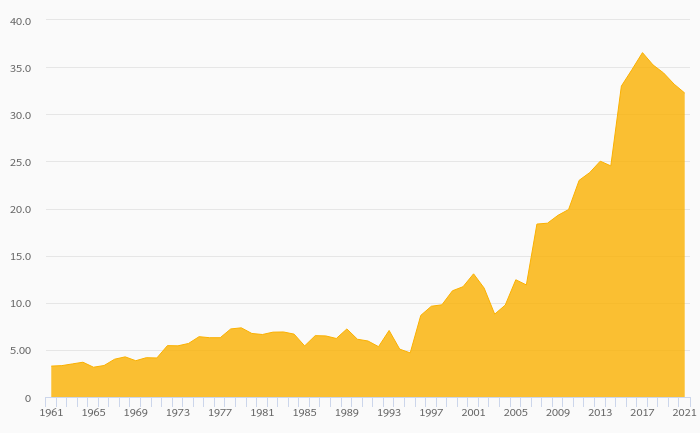
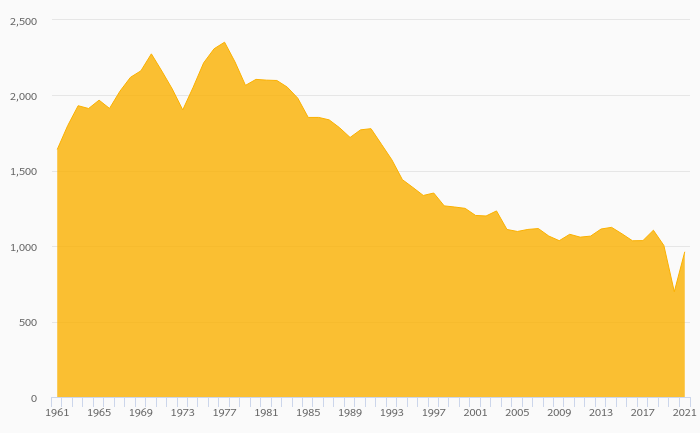
CSOB's loans reached CZK 914,700 mil in the fourth quarter of 2023, up from CZK 902,776 mil when compared to the previous quarter and up from CZK 872,429 mil when compared to the same period of last year. Historically, the bank’s loans reached an al...
By Helgi Library - February 16, 2024
CSOB's consumer loans reached CZK 39,613 mil in 2023-09-30, up 3.01% compared to the previous year. Czech banking sector provided consumer loans of CZK 493 bil in 2023-09-30, up 1.39% when compared to the last year. CSOB accounted for 8.03% of all consume...
CSOB is the largest financial Group in the Czech Republic with approximately a fifth of the market in assets, loans or deposits. Following its takeover of bankrupt IPB in 2000, the Bank serves now more than 3.6 million retail clients through a network of 200 branches, over 1,000 ATMs or 2,600 outlets if the network of the Czech Post Office is included. At the end of 2018, the Group employed over 8,000 people in the Czech Republic and Slovakia. The bank was privatized in 1999, when Belgium’s KBC became the majority owner (and sole owner in 2007). . The bank is particularly strong in the area of housing loans. Through its subsidiaries Hypoteční Banka and CMSS, ČSOB now controls a quarter of mortgage and building society loans. We estimate that mortgage lending generate over 20% of ČSOB's profit.

CSOB has been growing its revenues and asset by 2.84% and 6.86% a year on average in the last 10 years. Its loans and deposits have grown by 8.05% and 8.50% a year during that time and loans to deposits ratio reached 67.7% at the end of 2023. The company achieved an average return on equity of 15.7% in the last decade with net profit growing 1.23% a year on average. In terms of operating efficiency, its cost to income ratio reached 54.7% in 2023, compared to 49.7% average in the last decade.
Equity represented 6.13% of total assets or 12.7% of loans at the end of 2023. CSOB's non-performing loans were 1.51% of total loans while provisions covered some 45.2% of NPLs at the end of 2023.
 Helgi Library