By Helgi Library - November 4, 2023
Raiffeisen Bank Int. made a net profit of EUR 947 mil in the third quarter of 2023, down 18% when compared to the same period of ...
By Helgi Library - November 4, 2023
Raiffeisen Bank Int. made a net profit of EUR 947 mil under revenues of EUR 2,247 mil in the third quarter of 2023, down 18% and ...
By Helgi Library - November 4, 2023
Raiffeisen Bank Int.'s non-performing loans reached 2.80% of total loans at the end of 2023-09-30, down from 2.81% compared to th...
| Profit Statement | Mar 2023 | Jun 2023 | Sep 2023 | |
| Net Interest Income | EUR mil | 1,385 | 1,364 | 1,441 |
| Net Fee Income | EUR mil | 966 | 732 | 667 |
| Other Income | EUR mil | 108 | 101 | 140 |
| Total Revenues | EUR mil | 2,459 | 2,197 | 2,247 |
| Staff Cost | EUR mil | 562 | 606 | 491 |
| Operating Profit | EUR mil | 1,509 | 1,152 | 1,369 |
| Provisions | EUR mil | 301 | -41.9 | -7.73 |
| Net Profit | EUR mil | 700 | 627 | 947 |
| Balance Sheet | Mar 2023 | Jun 2023 | Sep 2023 | |
| Interbank Loans | EUR mil | 17,442 | 17,358 | 15,716 |
| Customer Loans | EUR mil | 105,336 | 101,806 | 101,931 |
| Investments | EUR mil | 26,281 | 28,236 | 30,803 |
| Total Assets | EUR mil | 210,977 | 206,123 | 204,175 |
| Shareholders' Equity | EUR mil | 19,225 | 19,329 | 19,851 |
| Interbank Borrowing | EUR mil | 35,005 | 33,681 | 29,298 |
| Customer Deposits | EUR mil | 124,776 | 120,553 | 121,233 |
| Issued Debt Securities | EUR mil | 31,971 | 32,561 | 33,792 |
| Ratios | Mar 2023 | Jun 2023 | Sep 2023 | |
| ROE | % | 14.7 | 13.0 | 19.3 |
| ROA | % | 1.34 | 1.20 | 1.85 |
| Costs (As % Of Assets) | % | 1.82 | 2.00 | 1.71 |
| Costs (As % Of Income) | % | 38.6 | 47.6 | 39.1 |
| Capital Adequacy Ratio | % | 20.1 | 19.9 | 19.7 |
| Net Interest Margin | % | 2.65 | 2.62 | 2.81 |
| Loans (As % Of Deposits) | % | 84.4 | 84.4 | 84.1 |
| NPLs (As % Of Loans) | % | 2.80 | 2.82 | 2.80 |
| Provisions (As % Of NPLs) | % | 58.2 | 57.6 | 58.9 |
| Valuation | Mar 2023 | Jun 2023 | Sep 2023 | |
| Market Capitalisation | USD mil | 5,120 | 5,238 | 4,806 |
| Number Of Shares | mil | 328 | 328 | 329 |
| Share Price | EUR | 14.2 | 14.5 | 13.8 |
| Price/Earnings (P/E) | 1.77 | 2.06 | 1.29 | |
| Price/Book Value (P/BV) | 0.257 | 0.263 | 0.244 | |
| Dividend Yield | % | ... | ... | ... |
| Earnings Per Share (EPS) | EUR | 8.01 | 7.04 | 10.7 |
| Book Value Per Share | EUR | 55.1 | 55.3 | 56.5 |
| Dividend Per Share | EUR | ... | ... | ... |
Get all company financials in excel:
| income statement | Unit | May 2024 | Sep 2023 |
| income statement | |||
| Interest Income | EUR mil | ... | |
| Interest Cost | EUR mil | ... | |
| Net Interest Income | EUR mil | ... | |
| Net Fee Income | EUR mil | ... | |
| Fee Income | EUR mil | ... | ... |
| Fee Expense | EUR mil | ... | ... |
| Other Income | EUR mil | ... | |
| Total Revenues | EUR mil | ... | |
| Staff Cost | EUR mil | ... | |
| Depreciation | EUR mil | ... | |
| Other Cost | EUR mil | ... | |
| Operating Cost | EUR mil | ... | |
| Operating Profit | EUR mil | ... | |
| Provisions | EUR mil | ... | |
| Extra and Other Cost | EUR mil | ... | |
| Pre-Tax Profit | EUR mil | ... | |
| Tax | EUR mil | ... | |
| Minorities | EUR mil | ... | |
| Net Profit | EUR mil | ... | |
| Net Profit Avail. to Common | EUR mil | ... | |
| Dividends | EUR mil | ... | ... |
| growth rates | |||
| Net Interest Income Growth | % | ... | |
| Net Fee Income Growth | % | ... | |
| Total Revenue Growth | % | ... | |
| Operating Cost Growth | % | ... | |
| Operating Profit Growth | % | ... | |
| Pre-Tax Profit Growth | % | ... | |
| Net Profit Growth | % | ... | |
| market share | |||
| Market Share in Revenues | % | ... | ... |
| Market Share in Net Profit | % | ... | ... |
| Market Share in Branches | % | ... | ... |
| ratios | Unit | May 2024 | Sep 2023 |
| ROE | % | ... | |
| ROTE | % | ... | |
| ROE (@ 15% of RWA) | % | ... | |
| ROA | % | ... | |
| Return on Loans | % | ... | |
| Operating Profit (As % of RWA) | % | ... | |
| Costs (As % Of Assets) | % | ... | |
| Costs (As % Of Income) | % | ... | |
| Costs (As % Of Loans) | % | ... | |
| Costs (As % Of Loans & Deposits) | % | ... | |
| Capital Adequacy Ratio | % | ... | |
| Tier 1 Ratio | % | ... | |
| Net Interest Margin | % | ... | |
| Interest Spread | % | ... | |
| Asset Yield | % | ... | |
| Revenues (As % of RWA) | % | ... | |
| Cost Of Liabilities | % | ... | |
| Payout Ratio | % | ... | |
| Interest Income (As % Of Revenues) | % | ... | |
| Fee Income (As % Of Revenues) | % | ... | |
| Other Income (As % Of Revenues) | % | ... | |
| Staff Cost (As % Of Total Cost) | % | ... | |
| Equity (As % Of Assets) | % | ... | |
| Equity (As % Of Loans) | % | ... | |
| Loans (As % Of Deposits) | % | ... | |
| Loans (As % Assets) | % | ... | |
| NPLs (As % Of Loans) | % | ... | |
| Provisions (As % Of NPLs) | % | ... | |
| Provisions (As % Of Loans) | % | ... | |
| Cost of Provisions (As % Of Loans) | % | ... |
| other data | Unit | May 2024 | Sep 2023 |
| Branches | ... | ||
| Employees | ... | ||
| Employees Per Bank Branch | ... | ||
| Cost Per Employee | USD per month | ... | |
| Cost Per Employee (Local Currency) | EUR per month | ... |
| customer breakdown | Unit | May 2024 | Sep 2023 |
| Customers | mil | ... | |
| Market Value per Customer (Local Currency) | EUR | ... | |
| Revenue per Customer (Local Currency) | EUR | ... | |
| Net Profit per Customer (Local Currency) | EUR | ... | |
| Loan per Customer (Local Currency) | EUR | ... | |
| Deposit per Customer (Local Currency) | EUR | ... | |
| Market Value per Customer | USD | ... | |
| Revenue per Customer | USD | ... | |
| Net Profit per Customer | USD | ... | |
| Loan per Customer | USD | ... | |
| Deposit per Customer | USD | ... |
Get all company financials in excel:


By Helgi Library - November 4, 2023
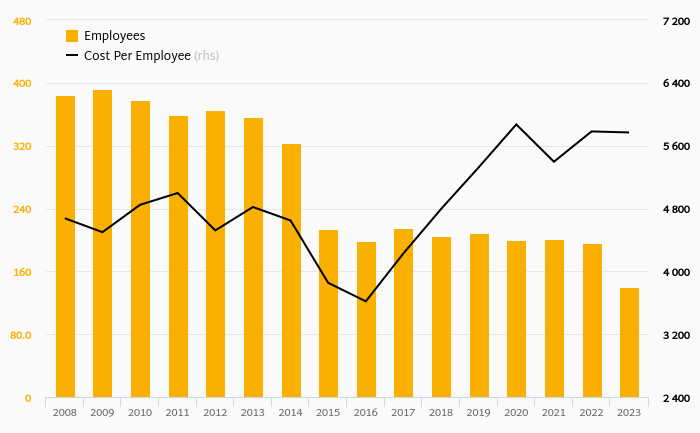
Raiffeisen Bank Int. employed 44,810 persons in 2023-09-30, up 0.563% when compared to the previous year. Historically, the bank's workforce hit an all time high of 63,376 persons in 2008-12-31 and an all time low of 44,024 in 2022-09-30. Average cost reached USD ...
By Helgi Library - August 24, 2023
Raiffeisen Bank Int.'s customer deposits reached EUR 71,538 mil in 2016-12-31, up 1.54% compared to the previous year. Austrian banking sector accepted customer deposits of EUR 395 bil in 2016-12-31, up 0.573% when compared to the last year. Raiffeisen Ba...
By Helgi Library - November 4, 2023
Raiffeisen Bank Int.'s capital adequacy ratio reached 19.7% at the end of third quarter of 2023, down from 19.9% when compared to the previous quarter. Historically, the bank’s capital ratio hit an all time high of 20.1% in 1Q2023 and an all time low of 8.40% in 3Q...
By Helgi Library - November 4, 2023
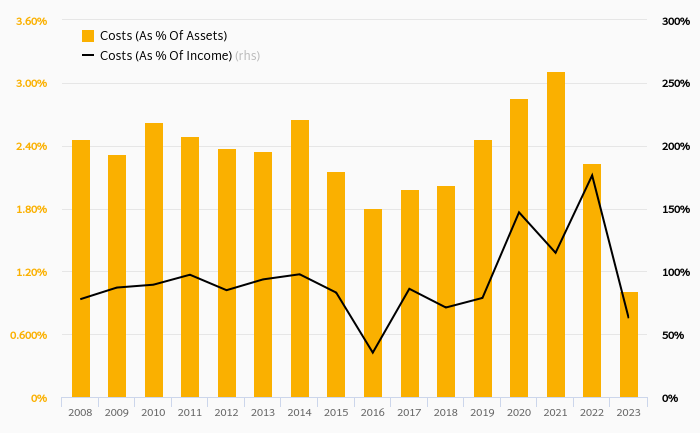
Raiffeisen Bank Int.'s cost to income ratio reached 39.1% in the third quarter of 2023, down from 47.6% when compared to the previous quarter. Historically, the bank’s costs reached an all time high of 90.8% of income in 4Q2012 and an all time low of 34.2% i...
By Helgi Library - November 4, 2023
Raiffeisen Bank Int.'s cost to income ratio reached 39.1% in the third quarter of 2023, down from 47.6% when compared to the previous quarter. Historically, the bank’s costs reached an all time high of 90.8% of income in 4Q2012 and an all time low of 34.2% i...
By Helgi Library - November 4, 2023
Raiffeisen Bank Int. generated total banking revenues of EUR 2,247 mil in the third quarter of 2023, down 16.8% when compared to the same period of last year and up 2.28% when compared to the previous quarter. Historically, the bank’s revenues con...
By Helgi Library - November 4, 2023
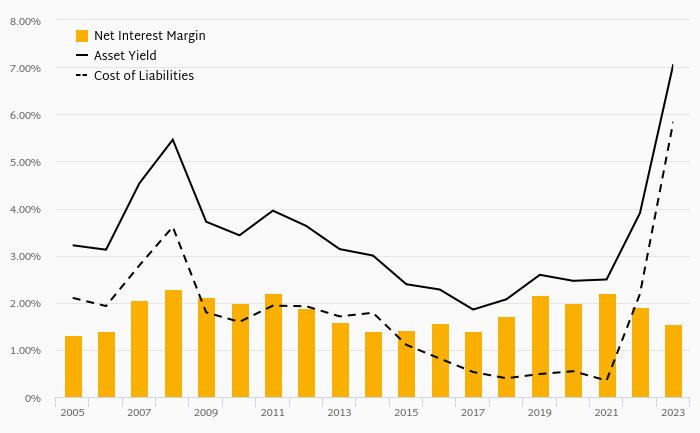
Raiffeisen Bank Int.'s net interest margin amounted to 2.81% in the third quarter of 2023, up from 2.62% when compared to the previous quarter. Historically, the bank’s net interest margin reached an all time high of 4.82% in 3Q2010 and an all time low of ...
By Helgi Library - November 4, 2023
Raiffeisen Bank Int. stock traded at per share at the end first quarter of 1970 implying a market capitalization of. Since the end of 1Q1965, the stock has A PHP Error was encountered Severity: Warning Message: A non-numeric value encountered Filename: src/Environment.php(35...
By Helgi Library - August 24, 2023
Raiffeisen Bank Int. generated total banking revenues of EUR 1,272 mil in 2016-09-30, down 8.62% compared to the previous year. Austrian banking sector banking sector generated total revenues of EUR 4,107 mil in 2016-09-30, down 24.2% when compared to...
By Helgi Library - August 24, 2023
Raiffeisen Bank Int.'s customer loans reached EUR 64,567 mil in 2016-09-30, down 1.34% compared to the previous year. Austrian banking sector provided customer loans of EUR 433 bil in 2016-09-30, down 0.057% when compared to the last year. Raiffeisen Bank...
Raiffeisen Bank International AG (RBI) is an Austrian bank that focuses on corporate and retail banking sector. From a relatively small bank in a country of 8 million people, the bank has grown into one of the biggest players in the region of Central and Eastern Europe (CEE) and the Commonwealth of Independent States (CIS). The bank now operates in 17 different countries, employes about 60,000 people and services approximatelly 14.9 million customers through more than 3,100 branches. The Bank's products include financing, leasing, investing, hedging, trade & export finance, investment banking, cash management, payment services, custody & fund services, and cards, among others. RBI's shares are listed on the Vienna Stock Exchange and are majority-owned by RZB, which is a central institution of the Austrian Raiffeisen Banking Group, the country's largest banking group

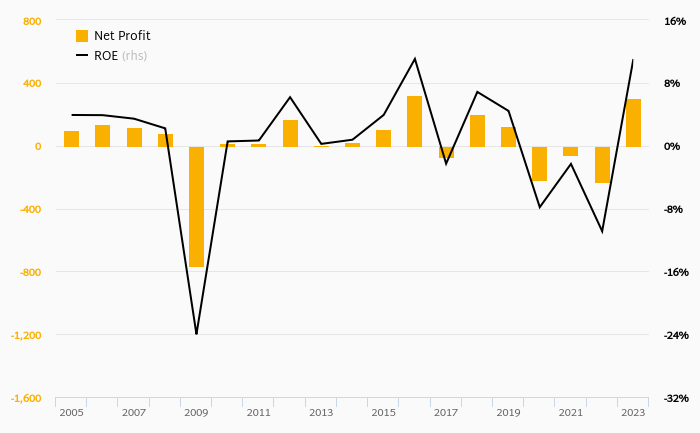
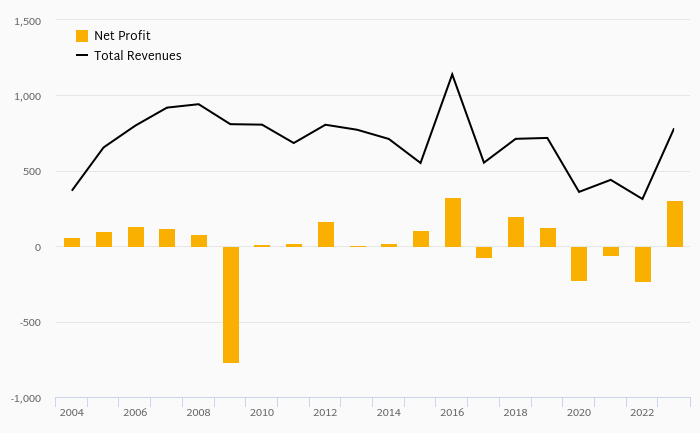
Raiffeisen Bank Int. has been growing its revenues and asset by 6.26% and 4.28% a year on average in the last 10 years. Its loans and deposits have grown by 2.88% and 6.56% a year during that time and loans to deposits ratio reached 82.5% at the end of 2022. The company achieved an average return on equity of 8.33% in the last decade with net profit growing 17.3% a year on average. In terms of operating efficiency, its cost to income ratio reached 36.6% in 2022, compared to 52.0% average in the last decade.
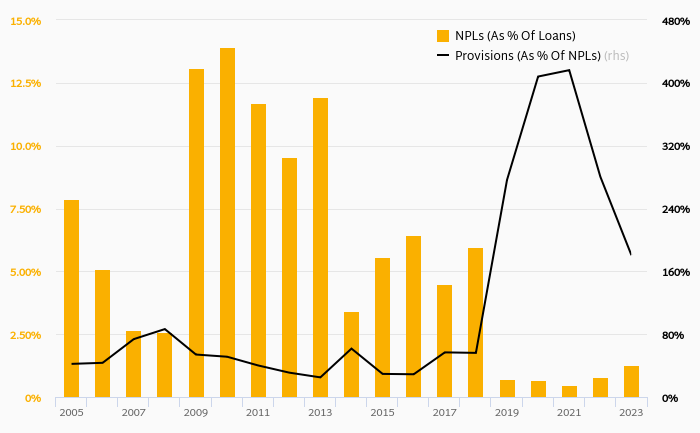
Equity represented 9.06% of total assets or 18.2% of loans at the end of 2022. Raiffeisen Bank Int.'s non-performing loans were 2.94% of total loans while provisions covered some 59.0% of NPLs at the end of 2022.
Raiffeisen Bank Int. stock traded at per share at the end of 2022 resulting in a market capitalization of . Over the previous three years, stock price rose by 0% or 0% a year on average. That’s compared to an average ROE of 12.9% the bank generated for its shareholders. This closing price put stock at a 12-month trailing price to earnings (PE) of 1.38x and price to book value (PBV) of 0.284x in 2022.
 Helgi Library