By Helgi Library - April 2, 2020
Severoceske doly's total assets reached CZK 33,064 mil at the end of 2014, up 3.1% compared to the previous year. ...
By Helgi Library - April 2, 2020
Severoceske doly's total assets reached CZK 33,064 mil at the end of 2014, up 3.1% compared to the previous year. ...
| Profit Statement | 2012 | 2013 | 2014 | |
| Sales | CZK mil | 11,361 | 12,352 | 10,672 |
| Gross Profit | CZK mil | 7,427 | 8,978 | 7,611 |
| EBITDA | CZK mil | 4,957 | 6,082 | 5,166 |
| EBIT | CZK mil | 2,608 | 3,406 | 2,599 |
| Financing Cost | CZK mil | -67.0 | -25.0 | 18.0 |
| Pre-Tax Profit | CZK mil | 2,675 | 3,431 | 2,581 |
| Net Profit | CZK mil | 2,137 | 2,745 | 2,080 |
| Dividends | CZK mil | 1,707 | 1,707 | ... |
| Balance Sheet | 2012 | 2013 | 2014 | |
| Total Assets | CZK mil | 33,069 | 32,071 | 33,064 |
| Non-Current Assets | CZK mil | 27,299 | 26,977 | 27,482 |
| Current Assets | CZK mil | 5,770 | 5,094 | 5,582 |
| Working Capital | CZK mil | 1,107 | -403 | -585 |
| Shareholders' Equity | CZK mil | 21,141 | 21,968 | 22,747 |
| Liabilities | CZK mil | 11,928 | 10,103 | 10,317 |
| Total Debt | CZK mil | 1,771 | 0 | 0 |
| Net Debt | CZK mil | -745 | -2,953 | -3,711 |
| Ratios | 2012 | 2013 | 2014 | |
| ROE | % | 10.2 | 12.7 | 9.30 |
| ROCE | % | 7.83 | 9.99 | 7.78 |
| Gross Margin | % | 65.4 | 72.7 | 71.3 |
| EBITDA Margin | % | 43.6 | 49.2 | 48.4 |
| EBIT Margin | % | 23.0 | 27.6 | 24.4 |
| Net Margin | % | 18.8 | 22.2 | 19.5 |
| Net Debt/EBITDA | -0.150 | -0.486 | -0.718 | |
| Net Debt/Equity | -0.035 | -0.134 | -0.163 | |
| Cost of Financing | % | -5.30 | -2.82 | ... |
| Cash Flow | 2012 | 2013 | 2014 | |
| Total Cash From Operations | CZK mil | 4,515 | 6,543 | 4,936 |
| Total Cash From Investing | CZK mil | -2,367 | -2,613 | -2,487 |
| Total Cash From Financing | CZK mil | -699 | -3,493 | -1,691 |
| Net Change In Cash | CZK mil | 1,449 | 437 | 758 |
| Cash Conversion Cycle | days | -26.1 | -147 | -163 |
| Cash Earnings | CZK mil | 4,486 | 5,421 | 4,647 |
| Free Cash Flow | CZK mil | 2,148 | 3,930 | 2,449 |
Get all company financials in excel:
| summary | Unit | 2000 | 2001 | 2002 | 2003 | 2004 | 2005 | 2006 | 2007 | 2008 | 2009 | 2010 | 2011 | 2012 | 2013 | 2014 |
| income statement | ||||||||||||||||
| Sales | CZK mil | ... | ... | ... | 10,702 | 10,231 | 9,710 | 11,231 | 11,361 | |||||||
| Gross Profit | CZK mil | ... | ... | ... | 7,331 | 7,918 | 7,077 | 7,728 | 7,427 | |||||||
| EBIT | CZK mil | ... | ... | ... | 3,741 | 4,013 | 2,827 | 3,229 | 2,608 | |||||||
| Net Profit | CZK mil | ... | ... | ... | 3,164 | 5,771 | 2,574 | 311 | 2,137 | |||||||
| ROE | % | ... | ... | ... | 17.0 | 28.8 | 12.3 | 1.48 | 10.2 | |||||||
| EBIT Margin | % | ... | ... | ... | 35.0 | 39.2 | 29.1 | 28.8 | 23.0 | |||||||
| Net Margin | % | ... | ... | ... | 29.6 | 56.4 | 26.5 | 2.77 | 18.8 | |||||||
| Employees | 4,965 | 5,037 | 4,999 | 5,064 | 5,198 | |||||||||||
| balance sheet | ||||||||||||||||
| Total Assets | CZK mil | ... | ... | ... | 33,737 | 33,925 | 33,477 | 31,979 | 33,069 | |||||||
| Non-Current Assets | CZK mil | ... | ... | ... | 22,380 | 25,527 | 28,340 | 26,066 | 27,299 | |||||||
| Current Assets | CZK mil | ... | ... | ... | 11,357 | 8,398 | 5,137 | 5,913 | 5,770 | |||||||
| Shareholders' Equity | CZK mil | ... | ... | ... | 19,308 | 20,704 | 21,283 | 20,694 | 21,141 | |||||||
| Liabilities | CZK mil | ... | ... | ... | 14,429 | 13,221 | 12,194 | 11,285 | 11,928 | |||||||
| Non-Current Liabilities | CZK mil | ... | ... | ... | 6,877 | 7,668 | 8,014 | 7,406 | 7,955 | |||||||
| Current Liabilities | CZK mil | ... | ... | ... | 7,552 | 5,553 | 4,180 | 3,879 | 3,973 | |||||||
| Net Debt/EBITDA | ... | ... | ... | 0.971 | 0.535 | 0.370 | -0.059 | -0.150 | ||||||||
| Net Debt/Equity | ... | ... | ... | 0.259 | 0.145 | 0.081 | -0.015 | -0.035 | ||||||||
| Cost of Financing | % | ... | ... | ... | ... | ... | ... | ... | -4.14 | -66.5 | -10.7 | 201 | -5.30 | ... | ||
| cash flow | ||||||||||||||||
| Total Cash From Operations | CZK mil | ... | ... | ... | 4,420 | 4,134 | 4,317 | 6,018 | 4,515 | |||||||
| Total Cash From Investing | CZK mil | ... | ... | ... | -1,587 | 2,366 | -1,076 | -2,471 | -2,367 | |||||||
| Total Cash From Financing | CZK mil | ... | ... | ... | -2,182 | -6,439 | -3,643 | -2,870 | -699 | |||||||
| Net Change In Cash | CZK mil | ... | ... | ... | 651 | 61.0 | -402 | 677 | 1,449 |
| income statement | Unit | 2000 | 2001 | 2002 | 2003 | 2004 | 2005 | 2006 | 2007 | 2008 | 2009 | 2010 | 2011 | 2012 | 2013 | 2014 |
| income statement | ||||||||||||||||
| Sales | CZK mil | ... | ... | ... | 10,702 | 10,231 | 9,710 | 11,231 | 11,361 | |||||||
| Cost of Goods & Services | CZK mil | ... | ... | ... | 3,371 | 2,313 | 2,633 | 3,503 | 3,934 | |||||||
| Gross Profit | CZK mil | ... | ... | ... | 7,331 | 7,918 | 7,077 | 7,728 | 7,427 | |||||||
| Staff Cost | CZK mil | ... | ... | ... | 2,188 | 2,290 | 2,417 | 2,435 | 2,470 | |||||||
| Other Cost | CZK mil | ... | ... | ... | 0 | 0 | 0 | 0 | 0 | |||||||
| EBITDA | CZK mil | ... | ... | ... | 5,143 | 5,628 | 4,660 | 5,293 | 4,957 | |||||||
| Depreciation | CZK mil | ... | ... | ... | 1,402 | 1,615 | 1,833 | 2,064 | 2,349 | |||||||
| EBIT | CZK mil | ... | ... | ... | 3,741 | 4,013 | 2,827 | 3,229 | 2,608 | |||||||
| Financing Cost | CZK mil | ... | ... | ... | -240 | -3,166 | -315 | 2,883 | -67.0 | |||||||
| Extraordinary Cost | CZK mil | ... | ... | ... | 0 | 0 | 0 | 0 | 0 | |||||||
| Pre-Tax Profit | CZK mil | ... | ... | ... | 3,981 | 7,179 | 3,142 | 346 | 2,675 | |||||||
| Tax | CZK mil | ... | ... | ... | 817 | 1,408 | 568 | 35.0 | 538 | |||||||
| Minorities | CZK mil | ... | ... | ... | 0 | 0 | 0 | 0 | 0 | |||||||
| Net Profit | CZK mil | ... | ... | ... | 3,164 | 5,771 | 2,574 | 311 | 2,137 | |||||||
| Dividends | CZK mil | ... | ... | 4,450 | 1,908 | 1,507 | 1,707 | 1,707 | ... | |||||||
| growth rates | ||||||||||||||||
| Total Revenue Growth | % | ... | ... | ... | ... | 2.25 | -4.40 | -5.09 | 15.7 | 1.16 | ||||||
| Operating Cost Growth | % | ... | ... | ... | ... | 8.53 | 4.66 | 5.55 | 0.745 | 1.44 | ||||||
| EBITDA Growth | % | ... | ... | ... | ... | 2.25 | 9.43 | -17.2 | 13.6 | -6.35 | ||||||
| EBIT Growth | % | ... | ... | ... | ... | -1.68 | 7.27 | -29.6 | 14.2 | -19.2 | ||||||
| Pre-Tax Profit Growth | % | ... | ... | ... | ... | 2.95 | 80.3 | -56.2 | -89.0 | 673 | ||||||
| Net Profit Growth | % | ... | ... | ... | ... | 3.87 | 82.4 | -55.4 | -87.9 | 587 | ||||||
| ratios | ||||||||||||||||
| ROE | % | ... | ... | ... | 17.0 | 28.8 | 12.3 | 1.48 | 10.2 | |||||||
| ROCE | % | ... | ... | ... | ... | 14.4 | 22.9 | 9.12 | 1.12 | 7.83 | ||||||
| Gross Margin | % | ... | ... | ... | 68.5 | 77.4 | 72.9 | 68.8 | 65.4 | |||||||
| EBITDA Margin | % | ... | ... | ... | 48.1 | 55.0 | 48.0 | 47.1 | 43.6 | |||||||
| EBIT Margin | % | ... | ... | ... | 35.0 | 39.2 | 29.1 | 28.8 | 23.0 | |||||||
| Net Margin | % | ... | ... | ... | 29.6 | 56.4 | 26.5 | 2.77 | 18.8 | |||||||
| Payout Ratio | % | ... | ... | ... | 141 | 33.1 | 58.5 | 549 | 79.9 | ... | ||||||
| Cost of Financing | % | ... | ... | ... | ... | ... | ... | ... | -4.14 | -66.5 | -10.7 | 201 | -5.30 | ... | ||
| Net Debt/EBITDA | ... | ... | ... | 0.971 | 0.535 | 0.370 | -0.059 | -0.150 |
| balance sheet | Unit | 2000 | 2001 | 2002 | 2003 | 2004 | 2005 | 2006 | 2007 | 2008 | 2009 | 2010 | 2011 | 2012 | 2013 | 2014 |
| balance sheet | ||||||||||||||||
| Non-Current Assets | CZK mil | ... | ... | ... | 22,380 | 25,527 | 28,340 | 26,066 | 27,299 | |||||||
| Property, Plant & Equipment | CZK mil | ... | ... | ... | 13,497 | 15,007 | 17,713 | 19,973 | 21,588 | |||||||
| Intangible Assets | CZK mil | ... | ... | ... | 62.0 | 26.0 | 26.0 | 41.0 | 29.0 | |||||||
| Current Assets | CZK mil | ... | ... | ... | 11,357 | 8,398 | 5,137 | 5,913 | 5,770 | |||||||
| Inventories | CZK mil | ... | ... | ... | 710 | 1,264 | 921 | 737 | 652 | |||||||
| Receivables | CZK mil | ... | ... | ... | 1,517 | 1,361 | 1,753 | 1,924 | 2,124 | |||||||
| Cash & Cash Equivalents | CZK mil | ... | ... | ... | 731 | 792 | 390 | 1,067 | 2,516 | |||||||
| Total Assets | CZK mil | ... | ... | ... | 33,737 | 33,925 | 33,477 | 31,979 | 33,069 | |||||||
| Shareholders' Equity | CZK mil | ... | ... | ... | 19,308 | 20,704 | 21,283 | 20,694 | 21,141 | |||||||
| Of Which Minority Interest | CZK mil | ... | ... | ... | 22.0 | 23.0 | 20.0 | 14.0 | 14.0 | |||||||
| Liabilities | CZK mil | ... | ... | ... | 14,429 | 13,221 | 12,194 | 11,285 | 11,928 | |||||||
| Non-Current Liabilities | CZK mil | ... | ... | ... | 6,877 | 7,668 | 8,014 | 7,406 | 7,955 | |||||||
| Long-Term Debt | CZK mil | ... | ... | ... | 0 | 0 | 0 | 0 | 0 | |||||||
| Deferred Tax Liabilities | CZK mil | ... | ... | ... | 461 | 1,163 | 1,331 | 896 | 1,002 | |||||||
| Current Liabilities | CZK mil | ... | ... | ... | 7,552 | 5,553 | 4,180 | 3,879 | 3,973 | |||||||
| Short-Term Debt | CZK mil | ... | ... | ... | 5,723 | 3,802 | 2,113 | 757 | 1,771 | |||||||
| Trade Payables | CZK mil | ... | ... | ... | 1,239 | 1,217 | 1,519 | 2,555 | 1,669 | |||||||
| Provisions | CZK mil | ... | ... | ... | 6,391 | 6,475 | 6,648 | 6,473 | 6,915 | |||||||
| Equity And Liabilities | CZK mil | ... | ... | ... | 33,737 | 33,925 | 33,477 | 31,979 | 33,069 | |||||||
| growth rates | ||||||||||||||||
| Total Asset Growth | % | ... | ... | ... | ... | 4.51 | 0.557 | -1.32 | -4.47 | 3.41 | ||||||
| Shareholders' Equity Growth | % | ... | ... | ... | ... | 8.23 | 7.23 | 2.80 | -2.77 | 2.16 | ||||||
| Net Debt Growth | % | ... | ... | ... | ... | -14.0 | -39.7 | -42.8 | -118 | 140 | ||||||
| Total Debt Growth | % | ... | ... | ... | ... | ... | ... | ... | ... | -2.72 | -33.6 | -44.4 | -64.2 | 134 | ... | |
| ratios | ||||||||||||||||
| Total Debt | CZK mil | ... | ... | ... | 5,723 | 3,802 | 2,113 | 757 | 1,771 | |||||||
| Net Debt | CZK mil | ... | ... | ... | 4,992 | 3,010 | 1,723 | -310 | -745 | |||||||
| Working Capital | CZK mil | ... | ... | ... | 988 | 1,408 | 1,155 | 106 | 1,107 | |||||||
| Capital Employed | CZK mil | ... | ... | ... | 23,368 | 26,935 | 29,495 | 26,172 | 28,406 | |||||||
| Net Debt/Equity | ... | ... | ... | 0.259 | 0.145 | 0.081 | -0.015 | -0.035 | ||||||||
| Cost of Financing | % | ... | ... | ... | ... | ... | ... | ... | -4.14 | -66.5 | -10.7 | 201 | -5.30 | ... |
| cash flow | Unit | 2000 | 2001 | 2002 | 2003 | 2004 | 2005 | 2006 | 2007 | 2008 | 2009 | 2010 | 2011 | 2012 | 2013 | 2014 |
| cash flow | ||||||||||||||||
| Net Profit | CZK mil | ... | ... | ... | 3,164 | 5,771 | 2,574 | 311 | 2,137 | |||||||
| Depreciation | CZK mil | ... | ... | ... | 1,402 | 1,615 | 1,833 | 2,064 | 2,349 | |||||||
| Non-Cash Items | CZK mil | ... | ... | ... | ... | 299 | -2,832 | -343 | 2,594 | 1,030 | ||||||
| Change in Working Capital | CZK mil | ... | ... | ... | ... | -445 | -420 | 253 | 1,049 | -1,001 | ||||||
| Total Cash From Operations | CZK mil | ... | ... | ... | 4,420 | 4,134 | 4,317 | 6,018 | 4,515 | |||||||
| Capital Expenditures | CZK mil | ... | ... | ... | -3,386 | -3,203 | -4,229 | -4,526 | -3,913 | |||||||
| Other Investments | CZK mil | ... | ... | ... | 1,799 | 5,569 | 3,153 | 2,055 | 1,546 | |||||||
| Total Cash From Investing | CZK mil | ... | ... | ... | -1,587 | 2,366 | -1,076 | -2,471 | -2,367 | |||||||
| Dividends Paid | CZK mil | ... | ... | ... | -1,815 | -4,450 | -1,908 | -1,507 | -1,707 | |||||||
| Issuance Of Debt | CZK mil | ... | ... | ... | ... | -160 | -1,921 | -1,689 | -1,356 | 1,014 | ||||||
| Total Cash From Financing | CZK mil | ... | ... | ... | -2,182 | -6,439 | -3,643 | -2,870 | -699 | |||||||
| Net Change In Cash | CZK mil | ... | ... | ... | 651 | 61.0 | -402 | 677 | 1,449 | |||||||
| ratios | ||||||||||||||||
| Days Sales Outstanding | days | ... | ... | ... | 51.7 | 48.6 | 65.9 | 62.5 | 68.2 | |||||||
| Days Sales Of Inventory | days | ... | ... | ... | 76.9 | 199 | 128 | 76.8 | 60.5 | |||||||
| Days Payable Outstanding | days | ... | ... | ... | 134 | 192 | 211 | 266 | 155 | |||||||
| Cash Conversion Cycle | days | ... | ... | ... | -5.54 | 56.0 | -17.0 | -127 | -26.1 | |||||||
| Cash Earnings | CZK mil | ... | ... | ... | 4,566 | 7,386 | 4,407 | 2,375 | 4,486 | |||||||
| Free Cash Flow | CZK mil | ... | ... | ... | 2,833 | 6,500 | 3,241 | 3,547 | 2,148 |
| other data | Unit | 2000 | 2001 | 2002 | 2003 | 2004 | 2005 | 2006 | 2007 | 2008 | 2009 | 2010 | 2011 | 2012 | 2013 | 2014 |
| other data | ||||||||||||||||
| ROA | % | ... | ... | ... | 9.59 | 17.1 | 7.64 | 0.950 | 6.57 | |||||||
| Gross Margin | % | ... | ... | ... | 68.5 | 77.4 | 72.9 | 68.8 | 65.4 | |||||||
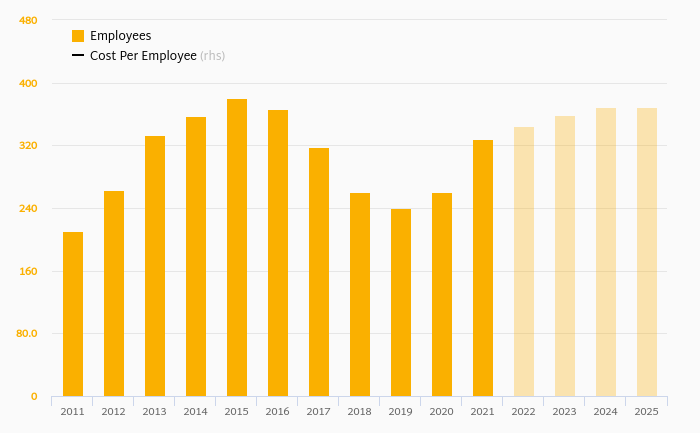
| Cost Per Employee | USD per month | ... | ... | ... | 2,156 | 1,988 | 2,108 | 2,266 | 2,024 | |||||||
| Cost Per Employee (Local Currency) | CZK per month | ... | ... | ... | 36,724 | 37,886 | 40,291 | 40,070 | 39,599 | |||||||
| Staff Cost (As % Of Total Cost) | % | ... | ... | ... | 31.4 | 36.8 | 35.1 | 30.4 | 28.2 | |||||||
| Effective Tax Rate | % | ... | ... | ... | 20.5 | 19.6 | 18.1 | 10.1 | 20.1 | |||||||
| Sales of Coal | CZK mil | ... | ... | ... | ... | ... | ... | ... | 9,570 | 10,231 | 9,710 | 10,425 | 10,105 | |||
| Sales from Engineering | CZK mil | ... | ... | ... | ... | ... | ... | ... | ... | ... | ... | 622 | ... | ... | ... | ... |
| Sales from Transport of Coal | CZK mil | ... | ... | ... | ... | ... | ... | ... | 488 | 495 | 516 | ... | ... | ... | ... | |
| Sales from Railway Transport | CZK mil | ... | ... | ... | ... | ... | ... | ... | 80.0 | 131 | 168 | ... | ... | ... | ... | |
| Sales from Road Transport | CZK mil | ... | ... | ... | ... | ... | ... | ... | 21.0 | 24.0 | 50.0 | ... | ... | ... | ... | |
| Mining Costs per Tonne | EUR | ... | ... | ... | 6.02 | 3.91 | 4.81 | 5.65 | 6.75 | |||||||
| Production of Coal (kt) | kt | 22,453 | 22,364 | 21,629 | 25,211 | 23,173 | ||||||||||
| Sales of Coal (kt) | kt | 22,272 | 22,029 | 21,757 | 25,144 | 22,789 | ||||||||||
| Sales of Coal to CEZ (kt) | kt | ... | ... | ... | ... | 16,660 | 16,471 | 17,167 | 19,696 | 17,273 | ||||||
| Sales of Coal to CEZ (As % of Total) | % | ... | ... | ... | ... | 74.8 | 74.8 | 78.9 | 78.3 | 75.8 | ||||||
| Sales Price of Coal per Tonne | EUR | ... | ... | ... | ... | ... | ... | ... | 17.2 | 17.6 | 17.6 | 16.9 | 17.6 | |||
| EBITDA per Tonne of Coal Mined | EUR | ... | ... | ... | 9.18 | 9.52 | 8.52 | 8.54 | 8.51 | |||||||
| EBIT per Tonne of Coal Mined | EUR | ... | ... | ... | 6.68 | 6.79 | 5.17 | 5.21 | 4.48 | |||||||
| Net Profit per Tonne of Coal Mined | EUR | ... | ... | ... | 5.65 | 9.76 | 4.71 | 0.502 | 3.67 | |||||||
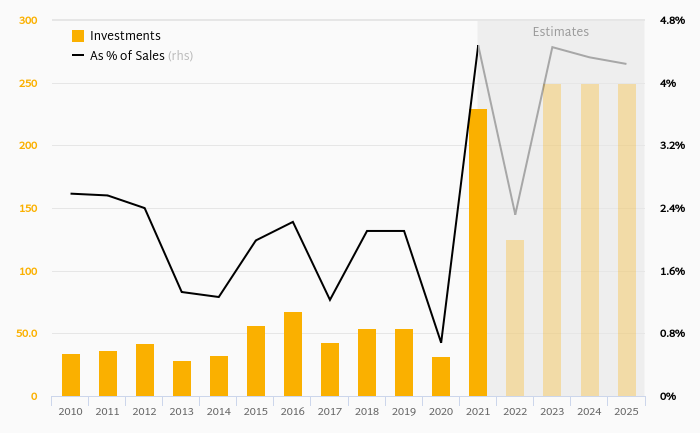
| Capital Expenditures (As % of Sales) | % | ... | ... | ... | 31.6 | 31.3 | 43.6 | 40.3 | 34.4 |
Get all company financials in excel:


Severočeské doly (SED) is a Czech Republic-based brown coal mining company. The Company is engaged in mining, processing and selling brown coal (lignite) and its by-products. It operates in the north-western part of the Northern Bohemian Brown Coal Basin, to the east of the town of Most. The company operates two separate mines, namely, the Nástup Tušimice mine and the Bílina mine. In 2012, Severočeské doly produced a total of 22.8 mil metric tonnes of brown coal, which is nearly a half of the Czech Republic's brown coal production. Since 2006, the Company is a wholly-owned subsidiary of the state-owned ČEZ Group. ČEZ is also the largest customer of the Company taking around 70% of Severočeské doly's annual coal production
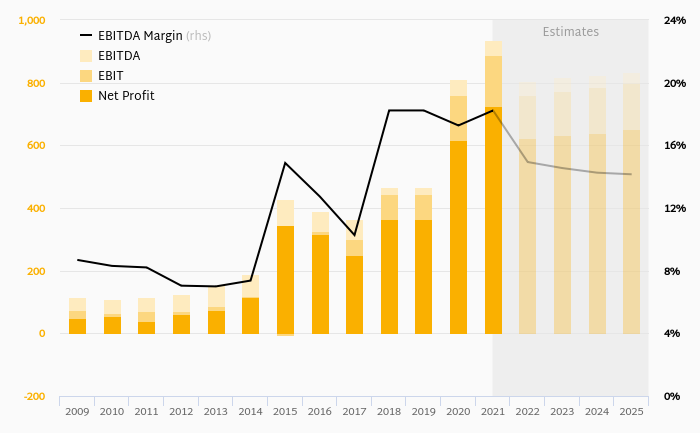
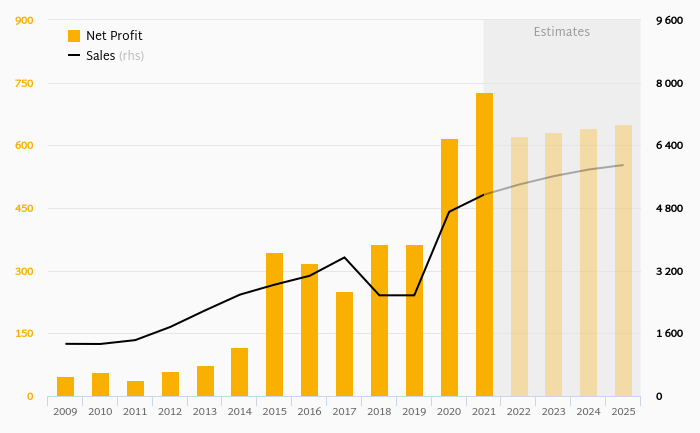
Severoceske doly has been growing its sales by a year on average in the last 5 years. EBITDA has fallen on average by 1.7% a year during that time to total of CZK 5,166 mil in 2014, or 48.4% of sales. That’s compared to 47.3% average margin seen in last five years.
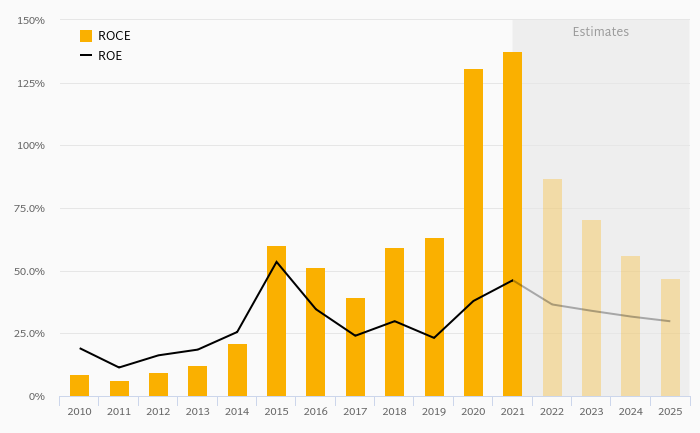
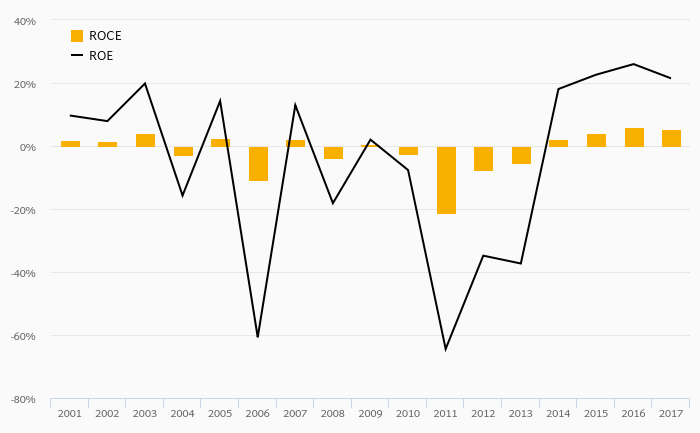
The company netted CZK 2,080 mil in 2014 implying ROE of 9.30% and ROCE of 7.78%. Again, the average figures were 9.20% and 7.17%, respectively when looking at the previous 5 years.
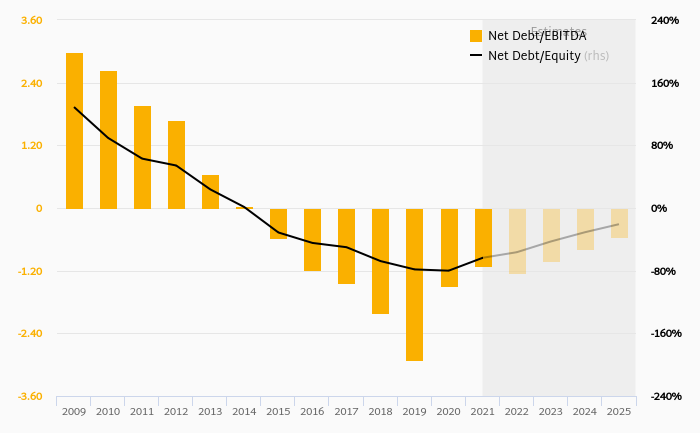
Severoceske doly’s net debt amounted to CZK -3,711 mil at the end of 2014, or -0.163 of equity. When compared to EBITDA, net debt was -0.718x, down when compared to average of -0.209x seen in the last 5 years.
 Helgi Library