By Helgi Library - September 19, 2020
Magna Exteriors Nymburk made a net profit of CZK -453 mil in 2019, down 189% compared to the previous year. Total sales reached CZK ...
By Helgi Library - September 19, 2020
Magna Exteriors Nymburk made a net profit of CZK -453 mil in 2019, down 189% compared to the previous year. Total sales reached CZK ...
By Helgi Library - September 19, 2020
Magna Exteriors Nymburk employed 748 employees in 2019, up 3.31% compared to the previous year. Historically, between 2...
| Profit Statement | 2017 | 2018 | 2019 | |
| Sales | CZK mil | 4,383 | 4,258 | 4,956 |
| Gross Profit | CZK mil | 656 | 1,858 | 2,090 |
| EBITDA | CZK mil | 218 | -36.4 | -251 |
| EBIT | CZK mil | 89.2 | -172 | -533 |
| Pre-Tax Profit | CZK mil | 48.9 | -163 | -505 |
| Net Profit | CZK mil | 37.0 | -157 | -453 |
| Balance Sheet | 2017 | 2018 | 2019 | |
| Total Assets | CZK mil | 2,804 | 3,539 | 3,360 |
| Non-Current Assets | CZK mil | 1,292 | 1,624 | 1,530 |
| Current Assets | CZK mil | 1,431 | 1,831 | 1,718 |
| Working Capital | CZK mil | 1,028 | 1,193 | 1,205 |
| Shareholders' Equity | CZK mil | 969 | 775 | 322 |
| Liabilities | CZK mil | 1,836 | 2,764 | 3,038 |
| Total Debt | CZK mil | 697 | 1,476 | 1,702 |
| Net Debt | CZK mil | 697 | 1,476 | 1,702 |
| Ratios | 2017 | 2018 | 2019 | |
| ROE | % | 3.57 | -18.0 | -82.6 |
| ROCE | % | 1.86 | -6.10 | -16.3 |
| Gross Margin | % | 15.0 | 43.6 | 42.2 |
| EBITDA Margin | % | 4.97 | -0.855 | -5.07 |
| EBIT Margin | % | 2.04 | -4.05 | -10.8 |
| Net Margin | % | 0.844 | -3.68 | -9.15 |
| Net Debt/EBITDA | 3.20 | -40.5 | -6.77 | |
| Net Debt/Equity | % | 71.9 | 190 | 529 |
| Cash Flow | 2017 | 2018 | 2019 | |
| Total Cash From Operations | CZK mil | 656 | -513 | 428 |
| Total Cash From Investing | CZK mil | -479 | -488 | -188 |
| Total Cash From Financing | CZK mil | -177 | 1,001 | -240 |
| Net Change In Cash | CZK mil | 0.394 | -0.130 | -0.386 |
| Cash Conversion Cycle | days | 82.3 | 115 | 83.1 |
| Cash Earnings | CZK mil | 166 | -20.7 | -172 |
| Free Cash Flow | CZK mil | 177 | -1,001 | 240 |
Get all company financials in excel:
| overview | Unit | 2008 | 2009 | 2010 | 2011 | 2012 | 2013 | 2014 | 2015 | 2016 | 2017 | 2018 | 2019 |
| income statement | |||||||||||||
| Sales | CZK mil | 2,055 | 2,534 | 2,646 | 3,270 | 4,383 | |||||||
| Gross Profit | CZK mil | 554 | 704 | 698 | 660 | 656 | |||||||
| EBIT | CZK mil | 154 | 287 | 322 | 207 | 89.2 | |||||||
| Net Profit | CZK mil | 173 | 282 | 327 | 170 | 37.0 | |||||||
| ROE | % | 15.1 | 24.3 | 26.4 | 14.4 | 3.57 | |||||||
| EBIT Margin | % | 7.51 | 11.3 | 12.2 | 6.32 | 2.04 | |||||||
| Net Margin | % | 8.41 | 11.1 | 12.3 | 5.19 | 0.844 | |||||||
| Employees | 575 | 554 | 577 | 635 | 726 | ||||||||
| balance sheet | |||||||||||||
| Total Assets | CZK mil | 1,574 | 1,964 | 2,034 | 2,098 | 2,804 | |||||||
| Non-Current Assets | CZK mil | 790 | 833 | 934 | 1,048 | 1,292 | |||||||
| Current Assets | CZK mil | 770 | 1,078 | 1,047 | 948 | 1,431 | |||||||
| Shareholders' Equity | CZK mil | 1,105 | 1,214 | 1,259 | 1,101 | 969 | |||||||
| Liabilities | CZK mil | 470 | 750 | 775 | 996 | 1,836 | |||||||
| Non-Current Liabilities | CZK mil | 34.1 | 37.8 | 16.9 | 23.5 | 16.3 | |||||||
| Current Liabilities | CZK mil | 356 | 438 | 520 | 773 | 1,586 | |||||||
| Net Debt/EBITDA | 0.026 | < -0.001 | 0.256 | 0.007 | 3.20 | ||||||||
| Net Debt/Equity | % | 0.570 | -0.008 | 8.71 | 0.190 | 71.9 | |||||||
| cash flow | |||||||||||||
| Total Cash From Operations | CZK mil | ... | ... | ... | ... | ... | ... | ... | ... | 1,018 | 656 | ||
| Total Cash From Investing | CZK mil | ... | ... | ... | ... | ... | ... | ... | ... | -371 | -479 | ||
| Total Cash From Financing | CZK mil | ... | ... | ... | ... | ... | ... | ... | ... | -647 | -177 | ||
| Net Change In Cash | CZK mil | ... | ... | ... | ... | ... | ... | ... | ... | -0.064 | 0.394 |
| income statement | Unit | 2008 | 2009 | 2010 | 2011 | 2012 | 2013 | 2014 | 2015 | 2016 | 2017 | 2018 | 2019 |
| income statement | |||||||||||||
| Sales | CZK mil | 2,055 | 2,534 | 2,646 | 3,270 | 4,383 | |||||||
| Cost of Goods & Services | CZK mil | 1,501 | 1,830 | 1,948 | 2,610 | 3,727 | |||||||
| Gross Profit | CZK mil | 554 | 704 | 698 | 660 | 656 | |||||||
| Staff Cost | CZK mil | 273 | 280 | 291 | 357 | 414 | |||||||
| Other Operating Cost (Income) | CZK mil | 42.8 | 37.3 | -21.5 | -13.8 | 23.5 | |||||||
| EBITDA | CZK mil | 238 | 387 | 428 | 317 | 218 | |||||||
| Depreciation | CZK mil | 83.9 | 99.9 | 106 | 110 | 129 | |||||||
| EBIT | CZK mil | 154 | 287 | 322 | 207 | 89.2 | |||||||
| Net Financing Cost | CZK mil | -26.2 | 0.968 | 2.98 | -1.45 | 40.4 | |||||||
| Extraordinary Cost | CZK mil | -0.001 | 0 | 0 | 0 | 0 | |||||||
| Pre-Tax Profit | CZK mil | 180 | 286 | 319 | 208 | 48.9 | |||||||
| Tax | CZK mil | 7.57 | 4.16 | -7.44 | 38.6 | 11.9 | |||||||
| Minorities | CZK mil | 0 | 0 | 0 | 0 | 0 | |||||||
| Net Profit | CZK mil | 173 | 282 | 327 | 170 | 37.0 | |||||||
| Net Profit Avail. to Common | CZK mil | 173 | 282 | 327 | 170 | 37.0 | |||||||
| growth rates | |||||||||||||
| Total Revenue Growth | % | ... | -11.3 | 23.3 | 4.41 | 23.6 | 34.0 | ||||||
| Staff Cost Growth | % | ... | -1.55 | 2.63 | 3.91 | 22.5 | 16.1 | ||||||
| EBITDA Growth | % | ... | -22.6 | 62.4 | 10.7 | -26.0 | -31.2 | ||||||
| EBIT Growth | % | ... | -32.2 | 86.0 | 12.3 | -35.8 | -56.8 | ||||||
| Pre-Tax Profit Growth | % | ... | -15.5 | 58.4 | 11.7 | -34.8 | -76.5 | ||||||
| Net Profit Growth | % | ... | -17.1 | 63.0 | 15.9 | -48.1 | -78.2 | ||||||
| ratios | |||||||||||||
| ROE | % | 15.1 | 24.3 | 26.4 | 14.4 | 3.57 | |||||||
| ROA | % | 10.4 | 15.9 | 16.3 | 8.21 | 1.51 | |||||||
| ROCE | % | ... | 12.0 | 18.1 | 18.9 | 9.93 | 1.86 | ||||||
| Gross Margin | % | 27.0 | 27.8 | 26.4 | 20.2 | 15.0 | |||||||
| EBITDA Margin | % | 11.6 | 15.3 | 16.2 | 9.69 | 4.97 | |||||||
| EBIT Margin | % | 7.51 | 11.3 | 12.2 | 6.32 | 2.04 | |||||||
| Net Margin | % | 8.41 | 11.1 | 12.3 | 5.19 | 0.844 | |||||||
| Net Debt/EBITDA | 0.026 | < -0.001 | 0.256 | 0.007 | 3.20 |
| balance sheet | Unit | 2008 | 2009 | 2010 | 2011 | 2012 | 2013 | 2014 | 2015 | 2016 | 2017 | 2018 | 2019 |
| balance sheet | |||||||||||||
| Cash & Cash Equivalents | CZK mil | 0.116 | 0.099 | 0.167 | 0.103 | 0.497 | |||||||
| Receivables | CZK mil | 691 | 973 | 916 | 787 | 1,251 | |||||||
| Inventories | CZK mil | 77.3 | 103 | 130 | 160 | 179 | |||||||
| Other ST Assets | CZK mil | 1.70 | 1.70 | 1.01 | < -0.001 | < 0.001 | |||||||
| Current Assets | CZK mil | 770 | 1,078 | 1,047 | 948 | 1,431 | |||||||
| Property, Plant & Equipment | CZK mil | 790 | 833 | 934 | 1,048 | 1,292 | |||||||
| LT Investments & Receivables | CZK mil | -0.010 | < 0.001 | < 0.001 | < -0.001 | < 0.001 | |||||||
| Intangible Assets | CZK mil | 0.365 | 0.177 | 0.826 | 0.526 | 0.226 | |||||||
| Goodwill | CZK mil | 0 | 0 | 0 | 0 | 0 | |||||||
| Non-Current Assets | CZK mil | 790 | 833 | 934 | 1,048 | 1,292 | |||||||
| Total Assets | CZK mil | 1,574 | 1,964 | 2,034 | 2,098 | 2,804 | |||||||
| Trade Payables | CZK mil | 148 | 212 | 217 | 341 | 403 | |||||||
| Short-Term Debt | CZK mil | 6.40 | 0 | 110 | 2.19 | 697 | |||||||
| Other ST Liabilities | CZK mil | 202 | 225 | 193 | 429 | 486 | |||||||
| Current Liabilities | CZK mil | 356 | 438 | 520 | 773 | 1,586 | |||||||
| Long-Term Debt | CZK mil | 0 | 0 | 0 | 0 | 0 | |||||||
| Other LT Liabilities | CZK mil | 34.1 | 37.8 | 16.9 | 23.5 | 16.3 | |||||||
| Non-Current Liabilities | CZK mil | 34.1 | 37.8 | 16.9 | 23.5 | 16.3 | |||||||
| Liabilities | CZK mil | 470 | 750 | 775 | 996 | 1,836 | |||||||
| Equity Before Minority Interest | CZK mil | 1,105 | 1,214 | 1,259 | 1,101 | 969 | |||||||
| Minority Interest | CZK mil | 0 | 0 | 0 | 0 | 0 | |||||||
| Equity | CZK mil | 1,105 | 1,214 | 1,259 | 1,101 | 969 | |||||||
| growth rates | |||||||||||||
| Total Asset Growth | % | ... | -10.3 | 24.7 | 3.57 | 3.15 | 33.7 | ||||||
| Shareholders' Equity Growth | % | ... | -7.13 | 9.86 | 3.70 | -12.5 | -12.0 | ||||||
| Net Debt Growth | % | ... | -88.5 | -102 | -110,788 | -98.1 | 33,275 | ||||||
| Total Debt Growth | % | ... | ... | ... | ... | ... | -88.4 | -100 | ... | -98.0 | 31,729 | ||
| ratios | |||||||||||||
| Total Debt | CZK mil | 6.40 | 0 | 110 | 2.19 | 697 | |||||||
| Net Debt | CZK mil | 6.30 | -0.099 | 110 | 2.09 | 697 | |||||||
| Working Capital | CZK mil | 620 | 863 | 828 | 606 | 1,028 | |||||||
| Capital Employed | CZK mil | 1,410 | 1,697 | 1,762 | 1,654 | 2,320 | |||||||
| Net Debt/Equity | % | 0.570 | -0.008 | 8.71 | 0.190 | 71.9 | |||||||
| Current Ratio | 2.16 | 2.46 | 2.01 | 1.23 | 0.902 | ||||||||
| Quick Ratio | 1.94 | 2.22 | 1.76 | 1.02 | 0.789 |
| cash flow | Unit | 2008 | 2009 | 2010 | 2011 | 2012 | 2013 | 2014 | 2015 | 2016 | 2017 | 2018 | 2019 |
| cash flow | |||||||||||||
| Net Profit | CZK mil | 173 | 282 | 327 | 170 | 37.0 | |||||||
| Depreciation | CZK mil | 83.9 | 99.9 | 106 | 110 | 129 | |||||||
| Non-Cash Items | CZK mil | ... | ... | ... | ... | ... | ... | ... | ... | 516 | 912 | ||
| Change in Working Capital | CZK mil | ... | 117 | -243 | 35.4 | 222 | -422 | ||||||
| Total Cash From Operations | CZK mil | ... | ... | ... | ... | ... | ... | ... | ... | 1,018 | 656 | ||
| Capital Expenditures | CZK mil | ... | ... | ... | ... | ... | ... | ... | ... | -259 | -368 | ||
| Other Investing Activities | CZK mil | ... | ... | ... | ... | ... | ... | ... | ... | -112 | -110 | ||
| Total Cash From Investing | CZK mil | ... | ... | ... | ... | ... | ... | ... | ... | -371 | -479 | ||
| Issuance Of Debt | CZK mil | ... | -49.0 | -6.40 | 110 | -108 | 695 | ||||||
| Total Cash From Financing | CZK mil | ... | ... | ... | ... | ... | ... | ... | ... | -647 | -177 | ||
| Net Change In Cash | CZK mil | ... | ... | ... | ... | ... | ... | ... | ... | -0.064 | 0.394 | ||
| ratios | |||||||||||||
| Days Sales Outstanding | days | 123 | 140 | 126 | 87.9 | 104 | |||||||
| Days Sales Of Inventory | days | 18.8 | 20.6 | 24.3 | 22.4 | 17.6 | |||||||
| Days Payable Outstanding | days | 36.1 | 42.3 | 40.7 | 47.7 | 39.4 | |||||||
| Cash Conversion Cycle | days | 105 | 118 | 110 | 62.5 | 82.3 | |||||||
| Cash Earnings | CZK mil | 257 | 382 | 433 | 280 | 166 | |||||||
| Free Cash Flow | CZK mil | ... | ... | ... | ... | ... | ... | ... | ... | 647 | 177 | ||
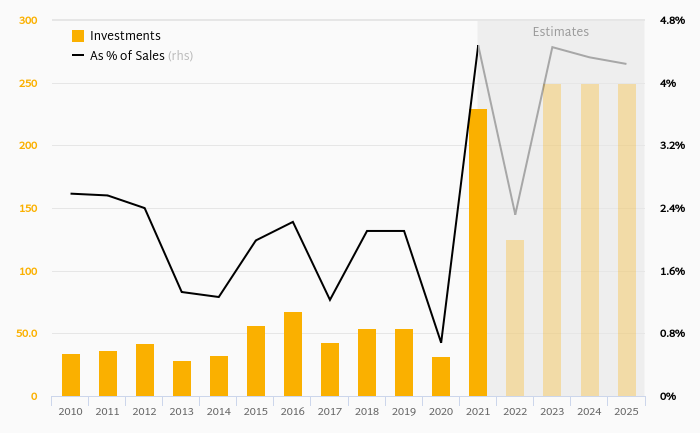
| Capital Expenditures (As % of Sales) | % | ... | ... | ... | ... | ... | ... | ... | ... | 7.91 | 8.40 |
| other ratios | Unit | 2008 | 2009 | 2010 | 2011 | 2012 | 2013 | 2014 | 2015 | 2016 | 2017 | 2018 | 2019 |
| Employees | 575 | 554 | 577 | 635 | 726 | ||||||||
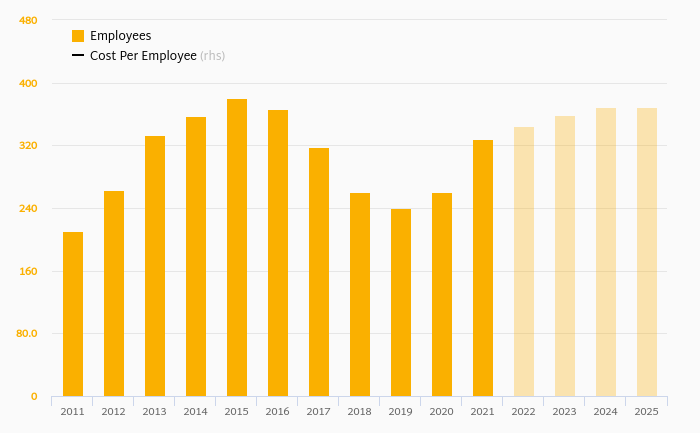
| Cost Per Employee | USD per month | 2,022 | 1,972 | 1,762 | 1,856 | 2,027 | |||||||
| Cost Per Employee (Local Currency) | CZK per month | 39,567 | 42,149 | 42,050 | 46,823 | 47,552 | |||||||
| Staff Cost (As % of Sales) | % | 13.3 | 11.1 | 11.0 | 10.9 | 9.45 | |||||||
| Effective Tax Rate | % | 4.19 | 1.46 | -2.33 | 18.5 | 24.3 | |||||||
| Total Revenue Growth (5-year average) | % | ... | ... | ... | ... | ... | 3.85 | 6.03 | 7.34 | 10.7 | 13.6 | ||
| Total Revenue Growth (10-year average) | % | ... | ... | ... | ... | ... | ... | ... | ... | ... | ... |
Get all company financials in excel:


By Helgi Library - September 19, 2020
Magna Exteriors Nymburk employed 748 employees in 2019, up 3.31% compared to the previous year. Historically, between 2008 and 2019, the firm's workforce hit a high of 748 employees in 2019 and a low of 434 employees in 2009. Average personnel cost s...
By Helgi Library - September 19, 2020
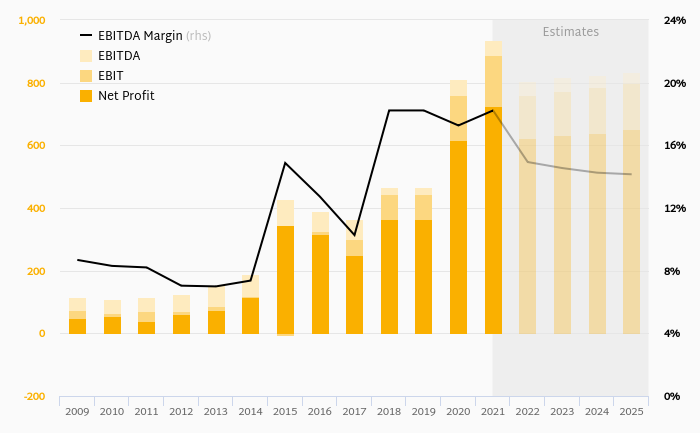
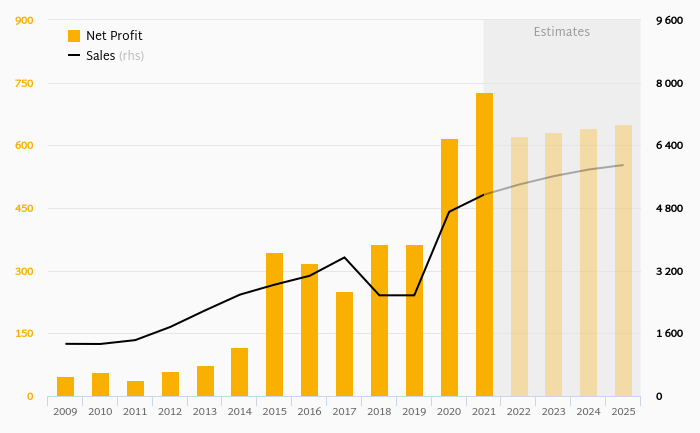
Magna Exteriors Nymburk made a net profit of CZK -453 mil with revenues of CZK 4,956 mil in 2019, down by 189% and up by 16.4%, respectively, compared to the previous year. This translates into a net margin of -9.15%. Historically, between 2008 and 2019...
By Helgi Library - September 19, 2020
Magna Exteriors Nymburk made a net profit of CZK -453 mil with revenues of CZK 4,956 mil in 2019, down by 189% and up by 16.4%, respectively, compared to the previous year. This translates into a net margin of -9.15%. Historically, between 2008 and 2019...
By Helgi Library - September 19, 2020
Magna Exteriors Nymburk made a net profit of CZK -453 mil in 2019, down 189% compared to the previous year. Historically, between 2008 and 2019, the company's net profit reached a high of CZK 327 mil in 2015 and a low of CZK -453 mil in 2019. The result i...
By Helgi Library - September 19, 2020
Magna Exteriors Nymburk made a net profit of CZK -453 mil in 2019, down 189% compared to the previous year. Historically, between 2008 and 2019, the company's net profit reached a high of CZK 327 mil in 2015 and a low of CZK -453 mil in 2019. The result i...
By Helgi Library - September 19, 2020
Magna Exteriors Nymburk's total assets reached CZK 3,360 mil at the end of 2019, down 5.08% compared to the previous year. Current assets amounted to CZK 1,718 mil, or 51.1% of total assets while cash stood at CZK 0.173 mil at the end of 20...
By Helgi Library - September 19, 2020
Magna Exteriors Nymburk's total assets reached CZK 3,360 mil at the end of 2019, down 5.08% compared to the previous year. Current assets amounted to CZK 1,718 mil, or 51.1% of total assets while cash stood at CZK 0.173 mil at the end of 20...
By Helgi Library - September 19, 2020
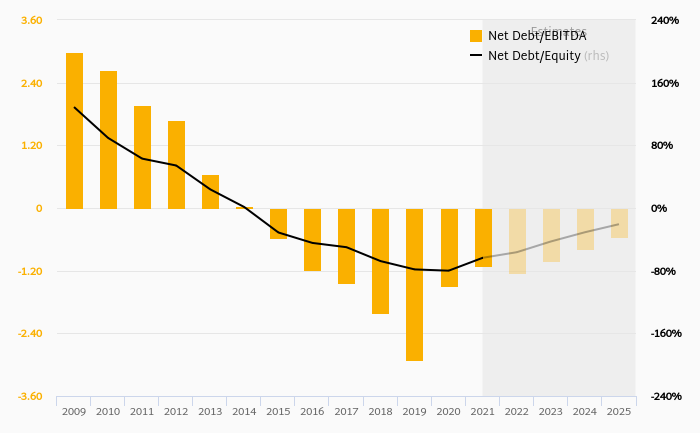
Magna Exteriors Nymburk's net debt stood at CZK 1,702 mil and accounted for 529% of equity at the end of 2019. The ratio is up 338 pp compared to the previous year. Historically, the firm’s net debt to equity reached a high of 529% in 2019 and a ...
By Helgi Library - September 19, 2020
Magna Exteriors Nymburk's net debt stood at CZK 1,702 mil and accounted for 529% of equity at the end of 2019. The ratio is up 338 pp compared to the previous year. Historically, the firm’s net debt to equity reached a high of 529% in 2019 and a ...
Magna Exteriors Nymburk is a Czech Republic-based subsidiary of Magna International Inc., a Canadian mobility technology company for automakers. The Magna Exteriors portfolio of products includes liftgates, door modules, exterior fascias and trim, front-end modules, active aerodynamic systems, running boards, sealing, trim and engineered glass. Advanced expertise in exterior design and lightweight composites is incorporated within each product line. Magna supplies General Motors, Ford Motor Company and FCA, as well as BMW, Mercedes, Volkswagen and Tesla Motors, among others. The Group is headquartered in Aurora, Ontario.

Magna Exteriors Nymburk has been growing its sales by 14.4% a year on average in the last 5 years. EBITDA has fallen by 165% during that time to total of CZK -251 mil in 2019, or -5.07% of sales. That’s compared to 4.98% average margin seen in last five years.
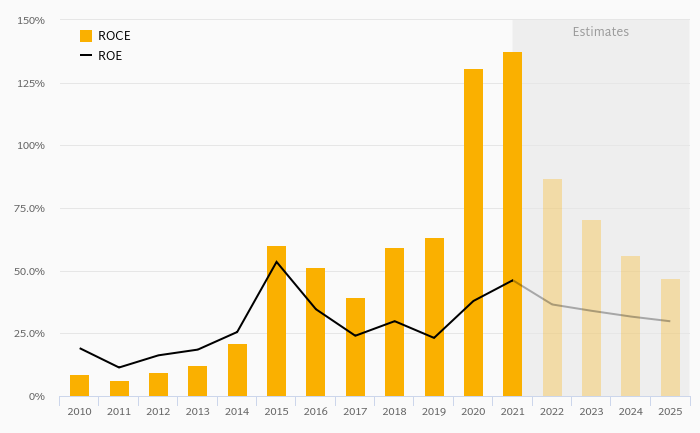
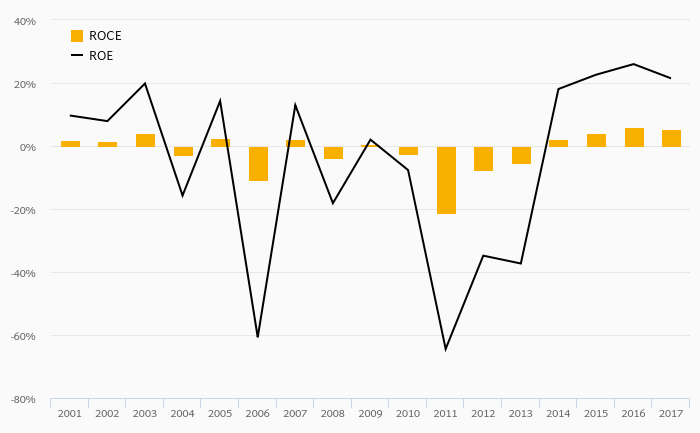
The company netted CZK -453 mil in 2019 implying ROE of -82.6% and ROCE of -16.3%. Again, the average figures were -11.2% and 1.65%, respectively when looking at the previous 5 years.
Magna Exteriors Nymburk’s net debt amounted to CZK 1,702 mil at the end of 2019, or 529% of equity. When compared to EBITDA, net debt was -6.77x, up when compared to average of -8.76x seen in the last 5 years.
 Helgi Library