By Helgi Library - December 5, 2021
RI OKNA employed 342 employees in 2019, up 9.62% compared to the previous year. Historically, between 2009 and 2019, ...
By Helgi Library - December 5, 2021
RI OKNA made a net profit of CZK 6.00 mil in 2019, down 50.7% compared to the previous year. Total sales reached CZK 843 mil, wh...
By Helgi Library - December 5, 2021
RI OKNA's total assets reached CZK 470 mil at the end of 2019, down 12.2% compared to the previous year. Current a...
| Profit Statement | 2017 | 2018 | 2019 | |
| Sales | CZK mil | 874 | 897 | 843 |
| Gross Profit | CZK mil | 161 | 187 | 219 |
| EBITDA | CZK mil | 30.4 | 42.9 | 54.1 |
| EBIT | CZK mil | 8.18 | 20.9 | 24.2 |
| Financing Cost | CZK mil | 5.03 | 4.84 | 5.40 |
| Pre-Tax Profit | CZK mil | 5.39 | 15.7 | 18.9 |
| Net Profit | CZK mil | 4.31 | 12.2 | 6.00 |
| Dividends | CZK mil | -0.001 | 51.6 | < 0.001 |
| Balance Sheet | 2017 | 2018 | 2019 | |
| Total Assets | CZK mil | 540 | 536 | 470 |
| Non-Current Assets | CZK mil | 302 | 322 | 294 |
| Current Assets | CZK mil | 238 | 211 | 174 |
| Working Capital | CZK mil | 78.1 | 66.0 | 48.6 |
| Shareholders' Equity | CZK mil | 221 | 182 | 188 |
| Liabilities | CZK mil | 319 | 354 | 283 |
| Total Debt | CZK mil | 152 | 164 | 114 |
| Net Debt | CZK mil | 129 | 140 | 98.2 |
| Ratios | 2017 | 2018 | 2019 | |
| ROE | % | 1.97 | 6.05 | 3.25 |
| ROCE | % | 1.16 | 3.17 | 1.64 |
| Gross Margin | % | 18.4 | 20.9 | 25.9 |
| EBITDA Margin | % | 3.47 | 4.78 | 6.42 |
| EBIT Margin | % | 0.935 | 2.33 | 2.87 |
| Net Margin | % | 0.493 | 1.36 | 0.712 |
| Net Debt/EBITDA | 4.25 | 3.26 | 1.82 | |
| Net Debt/Equity | % | 58.3 | 76.9 | 52.3 |
| Cost of Financing | % | 3.30 | 3.06 | 3.88 |
| Cash Flow | 2017 | 2018 | 2019 | |
| Total Cash From Operations | CZK mil | 2.60 | 34.2 | 36.2 |
| Total Cash From Investing | CZK mil | -4.98 | -21.5 | -1.01 |
| Total Cash From Financing | CZK mil | -3.72 | -12.7 | -43.4 |
| Net Change In Cash | CZK mil | -6.10 | -0.021 | -8.22 |
| Cash Conversion Cycle | days | 24.7 | 20.6 | 12.8 |
| Cash Earnings | CZK mil | 26.5 | 34.1 | 35.9 |
| Free Cash Flow | CZK mil | -2.38 | 12.7 | 35.1 |
Get all company financials in excel:
| overview | Unit | 2006 | 2007 | 2008 | 2009 | 2010 | 2011 | 2012 | 2013 | 2014 | 2015 | 2016 | 2017 | 2018 | 2019 |
| income statement | |||||||||||||||
| Sales | CZK mil | 802 | 701 | 757 | 686 | 874 | |||||||||
| Gross Profit | CZK mil | 125 | 138 | 156 | 133 | 161 | |||||||||
| EBIT | CZK mil | 13.3 | 7.86 | 24.6 | 8.93 | 8.18 | |||||||||
| Net Profit | CZK mil | 2.67 | 0.608 | 4.30 | 2.48 | 4.31 | |||||||||
| ROE | % | 1.22 | 0.276 | 1.98 | 1.15 | 1.97 | |||||||||
| EBIT Margin | % | 1.66 | 1.12 | 3.24 | 1.30 | 0.935 | |||||||||
| Net Margin | % | 0.333 | 0.087 | 0.567 | 0.361 | 0.493 | |||||||||
| Employees | ... | ... | ... | 197 | 217 | 234 | 250 | 280 | |||||||
| balance sheet | |||||||||||||||
| Total Assets | CZK mil | 515 | 511 | 518 | 499 | 540 | |||||||||
| Non-Current Assets | CZK mil | 319 | 298 | 332 | 320 | 302 | |||||||||
| Current Assets | CZK mil | 194 | 212 | 185 | 178 | 238 | |||||||||
| Shareholders' Equity | CZK mil | 220 | 221 | 214 | 217 | 221 | |||||||||
| Liabilities | CZK mil | 295 | 290 | 304 | 283 | 319 | |||||||||
| Non-Current Liabilities | CZK mil | 127 | 107 | 153 | 125 | 105 | |||||||||
| Current Liabilities | CZK mil | 168 | 183 | 149 | 157 | 213 | |||||||||
| Net Debt/EBITDA | 2.67 | 2.79 | 3.12 | 4.04 | 4.25 | ||||||||||
| Net Debt/Equity | % | 48.2 | 42.1 | 67.3 | 57.2 | 58.3 | |||||||||
| Cost of Financing | % | ... | ... | ... | ... | ... | ... | ... | ... | 4.55 | 4.32 | 3.73 | 3.30 | ||
| cash flow | |||||||||||||||
| Total Cash From Operations | CZK mil | ... | ... | ... | ... | ... | ... | 21.6 | 18.6 | 26.3 | 31.7 | 2.60 | |||
| Total Cash From Investing | CZK mil | ... | ... | ... | ... | ... | ... | -2.22 | -4.47 | -55.6 | -9.32 | -4.98 | |||
| Total Cash From Financing | CZK mil | ... | ... | ... | ... | ... | ... | -22.9 | -12.7 | 29.7 | -31.7 | -3.72 | |||
| Net Change In Cash | CZK mil | ... | ... | ... | ... | ... | ... | -3.55 | 1.43 | 0.404 | -9.31 | -6.10 |
| income statement | Unit | 2006 | 2007 | 2008 | 2009 | 2010 | 2011 | 2012 | 2013 | 2014 | 2015 | 2016 | 2017 | 2018 | 2019 |
| income statement | |||||||||||||||
| Sales | CZK mil | 802 | 701 | 757 | 686 | 874 | |||||||||
| Cost of Goods & Services | CZK mil | 677 | 563 | 602 | 553 | 713 | |||||||||
| Gross Profit | CZK mil | 125 | 138 | 156 | 133 | 161 | |||||||||
| Staff Cost | CZK mil | 83.1 | 93.5 | 106 | 109 | 131 | |||||||||
| Other Operating Cost (Income) | CZK mil | 2.36 | 10.9 | 3.06 | -6.76 | -0.122 | |||||||||
| EBITDA | CZK mil | 39.7 | 33.3 | 46.2 | 30.7 | 30.4 | |||||||||
| Depreciation | CZK mil | 26.4 | 25.4 | 21.6 | 21.8 | 22.2 | |||||||||
| EBIT | CZK mil | 13.3 | 7.86 | 24.6 | 8.93 | 8.18 | |||||||||
| Net Financing Cost | CZK mil | 9.80 | 6.14 | 6.86 | 5.92 | 2.76 | |||||||||
| Financing Cost | CZK mil | ... | ... | ... | ... | ... | ... | ... | ... | 6.22 | 6.77 | 6.26 | 5.03 | ||
| Financing Income | CZK mil | ... | ... | ... | ... | ... | ... | ... | ... | 0.016 | 0.013 | 0.012 | < 0.001 | ||
| Extraordinary Cost | CZK mil | 0.090 | 0.150 | 14.8 | 0 | 0.020 | |||||||||
| Pre-Tax Profit | CZK mil | 3.44 | 1.57 | 2.93 | 3.01 | 5.39 | |||||||||
| Tax | CZK mil | 0.768 | 0.965 | -1.37 | 0.537 | 1.08 | |||||||||
| Minorities | CZK mil | 0 | 0 | ... | ... | ... | ... | ... | |||||||
| Net Profit | CZK mil | 2.67 | 0.608 | 4.30 | 2.48 | 4.31 | |||||||||
| Net Profit Avail. to Common | CZK mil | 2.67 | 0.608 | 4.30 | 2.48 | 4.31 | |||||||||
| Dividends | CZK mil | ... | < -0.001 | 0.001 | 10.5 | < -0.001 | -0.001 | ||||||||
| growth rates | |||||||||||||||
| Total Revenue Growth | % | ... | 12.2 | -12.7 | 8.10 | -9.48 | 27.5 | ||||||||
| Staff Cost Growth | % | ... | -8.37 | 12.6 | 13.8 | 2.42 | 20.1 | ||||||||
| EBITDA Growth | % | ... | 44.2 | -16.1 | 38.8 | -33.6 | -1.08 | ||||||||
| EBIT Growth | % | ... | -2,081 | -41.1 | 213 | -63.6 | -8.43 | ||||||||
| Pre-Tax Profit Growth | % | ... | -148 | -54.3 | 86.0 | 3.01 | 78.9 | ||||||||
| Net Profit Growth | % | ... | -145 | -77.3 | 607 | -42.4 | 74.2 | ||||||||
| ratios | |||||||||||||||
| ROE | % | 1.22 | 0.276 | 1.98 | 1.15 | 1.97 | |||||||||
| ROA | % | 0.512 | 0.119 | 0.835 | 0.487 | 0.830 | |||||||||
| ROCE | % | ... | 0.771 | 0.182 | 1.21 | 0.664 | 1.16 | ||||||||
| Gross Margin | % | 15.6 | 19.7 | 20.6 | 19.4 | 18.4 | |||||||||
| EBITDA Margin | % | 4.95 | 4.75 | 6.10 | 4.48 | 3.47 | |||||||||
| EBIT Margin | % | 1.66 | 1.12 | 3.24 | 1.30 | 0.935 | |||||||||
| Net Margin | % | 0.333 | 0.087 | 0.567 | 0.361 | 0.493 | |||||||||
| Payout Ratio | % | ... | < -0.001 | 0.164 | 245 | < -0.001 | -0.023 | ||||||||
| Cost of Financing | % | ... | ... | ... | ... | ... | ... | ... | ... | 4.55 | 4.32 | 3.73 | 3.30 | ||
| Net Debt/EBITDA | 2.67 | 2.79 | 3.12 | 4.04 | 4.25 |
| balance sheet | Unit | 2006 | 2007 | 2008 | 2009 | 2010 | 2011 | 2012 | 2013 | 2014 | 2015 | 2016 | 2017 | 2018 | 2019 |
| balance sheet | |||||||||||||||
| Cash & Cash Equivalents | CZK mil | 36.5 | 38.0 | 38.4 | 29.0 | 22.9 | |||||||||
| Receivables | CZK mil | 92.7 | 107 | 105 | 102 | 162 | |||||||||
| Inventories | CZK mil | 45.9 | 46.5 | 41.4 | 46.8 | 52.4 | |||||||||
| Other ST Assets | CZK mil | 19.2 | 20.2 | 0 | 0 | < 0.001 | |||||||||
| Current Assets | CZK mil | 194 | 212 | 185 | 178 | 238 | |||||||||
| Property, Plant & Equipment | CZK mil | 318 | 298 | 331 | 319 | 301 | |||||||||
| LT Investments & Receivables | CZK mil | < -0.001 | < 0.001 | < 0.001 | < -0.001 | < -0.001 | |||||||||
| Intangible Assets | CZK mil | 0.253 | 0.191 | 0.725 | 1.27 | 0.840 | |||||||||
| Goodwill | CZK mil | 0 | 0 | 0 | 0 | 0 | |||||||||
| Non-Current Assets | CZK mil | 319 | 298 | 332 | 320 | 302 | |||||||||
| Total Assets | CZK mil | 515 | 511 | 518 | 499 | 540 | |||||||||
| Trade Payables | CZK mil | 121 | 120 | 97.5 | 104 | 137 | |||||||||
| Short-Term Debt | CZK mil | 23.7 | 33.7 | 37.0 | 35.8 | 54.3 | |||||||||
| Other ST Liabilities | CZK mil | 22.9 | 29.6 | 14.5 | 17.1 | 22.1 | |||||||||
| Current Liabilities | CZK mil | 168 | 183 | 149 | 157 | 213 | |||||||||
| Long-Term Debt | CZK mil | 119 | 97.1 | 145 | 117 | 97.6 | |||||||||
| Other LT Liabilities | CZK mil | 8.29 | 9.83 | 7.90 | 7.59 | 7.59 | |||||||||
| Non-Current Liabilities | CZK mil | 127 | 107 | 153 | 125 | 105 | |||||||||
| Liabilities | CZK mil | 295 | 290 | 304 | 283 | 319 | |||||||||
| Equity Before Minority Interest | CZK mil | 220 | 221 | 214 | 217 | 221 | |||||||||
| Minority Interest | CZK mil | 0 | 0 | 0 | 0 | 0 | |||||||||
| Equity | CZK mil | 220 | 221 | 214 | 217 | 221 | |||||||||
| growth rates | |||||||||||||||
| Total Asset Growth | % | ... | -2.97 | -0.765 | 1.48 | -3.62 | 8.21 | ||||||||
| Shareholders' Equity Growth | % | ... | 1.23 | 0.276 | -2.82 | 1.16 | 1.99 | ||||||||
| Net Debt Growth | % | ... | -16.0 | -12.3 | 55.2 | -13.9 | 3.89 | ||||||||
| Total Debt Growth | % | ... | -14.3 | -8.14 | 39.5 | -16.1 | -0.834 | ||||||||
| ratios | |||||||||||||||
| Total Debt | CZK mil | 142 | 131 | 183 | 153 | 152 | |||||||||
| Net Debt | CZK mil | 106 | 92.9 | 144 | 124 | 129 | |||||||||
| Working Capital | CZK mil | 17.6 | 33.6 | 49.0 | 45.0 | 78.1 | |||||||||
| Capital Employed | CZK mil | 336 | 331 | 381 | 365 | 380 | |||||||||
| Net Debt/Equity | % | 48.2 | 42.1 | 67.3 | 57.2 | 58.3 | |||||||||
| Current Ratio | 1.16 | 1.16 | 1.24 | 1.13 | 1.12 | ||||||||||
| Quick Ratio | 0.771 | 0.791 | 0.963 | 0.836 | 0.870 |
| cash flow | Unit | 2006 | 2007 | 2008 | 2009 | 2010 | 2011 | 2012 | 2013 | 2014 | 2015 | 2016 | 2017 | 2018 | 2019 |
| cash flow | |||||||||||||||
| Net Profit | CZK mil | 2.67 | 0.608 | 4.30 | 2.48 | 4.31 | |||||||||
| Depreciation | CZK mil | 26.4 | 25.4 | 21.6 | 21.8 | 22.2 | |||||||||
| Non-Cash Items | CZK mil | ... | ... | ... | ... | ... | ... | -3.66 | 8.57 | 15.8 | 3.42 | 9.22 | |||
| Change in Working Capital | CZK mil | ... | -3.78 | -16.0 | -15.5 | 4.08 | -33.1 | ||||||||
| Total Cash From Operations | CZK mil | ... | ... | ... | ... | ... | ... | 21.6 | 18.6 | 26.3 | 31.7 | 2.60 | |||
| Capital Expenditures | CZK mil | ... | ... | ... | ... | ... | ... | -2.22 | -4.70 | -56.4 | -6.26 | -7.91 | |||
| Other Investing Activities | CZK mil | ... | ... | ... | ... | ... | ... | 0 | 0.233 | 0.760 | -3.06 | 2.93 | |||
| Total Cash From Investing | CZK mil | ... | ... | ... | ... | ... | ... | -2.22 | -4.47 | -55.6 | -9.32 | -4.98 | |||
| Dividends Paid | CZK mil | ... | ... | ... | ... | ... | ... | ... | ... | ... | -10.5 | ... | ... | ... | ... |
| Issuance Of Shares | CZK mil | ... | ... | ... | ... | ... | ... | ... | ... | ... | 0 | 0 | 0 | ||
| Issuance Of Debt | CZK mil | ... | -23.7 | -11.6 | 40.2 | -31.7 | -3.72 | ||||||||
| Other Financing Activities | CZK mil | ... | ... | ... | ... | ... | ... | ... | ... | ... | 55.6 | ... | ... | ... | ... |
| Total Cash From Financing | CZK mil | ... | ... | ... | ... | ... | ... | -22.9 | -12.7 | 29.7 | -31.7 | -3.72 | |||
| Net Change In Cash | CZK mil | ... | ... | ... | ... | ... | ... | -3.55 | 1.43 | 0.404 | -9.31 | -6.10 | |||
| ratios | |||||||||||||||
| Days Sales Outstanding | days | 42.2 | 55.7 | 50.7 | 54.3 | 67.7 | |||||||||
| Days Sales Of Inventory | days | 24.8 | 30.2 | 25.1 | 30.9 | 26.8 | |||||||||
| Days Payable Outstanding | days | 65.2 | 77.7 | 59.1 | 68.6 | 69.9 | |||||||||
| Cash Conversion Cycle | days | 1.70 | 8.15 | 16.6 | 16.6 | 24.7 | |||||||||
| Cash Earnings | CZK mil | 29.0 | 26.0 | 25.9 | 24.2 | 26.5 | |||||||||
| Free Cash Flow | CZK mil | ... | ... | ... | ... | ... | ... | 19.4 | 14.2 | -29.3 | 22.4 | -2.38 | |||
| Capital Expenditures (As % of Sales) | % | ... | ... | ... | ... | ... | ... | 0.277 | 0.671 | 7.44 | 0.913 | 0.905 |
| other ratios | Unit | 2006 | 2007 | 2008 | 2009 | 2010 | 2011 | 2012 | 2013 | 2014 | 2015 | 2016 | 2017 | 2018 | 2019 |
| Employees | ... | ... | ... | 197 | 217 | 234 | 250 | 280 | |||||||
| Cost Per Employee | USD per month | ... | ... | ... | 1,796 | 1,681 | 1,588 | 1,440 | 1,660 | ||||||
| Cost Per Employee (Local Currency) | CZK per month | ... | ... | ... | 35,136 | 35,920 | 37,901 | 36,334 | 38,961 | ||||||
| Material & Energy (As % of Sales) | % | ... | ... | ... | ... | ... | ... | ... | ... | 59.2 | 59.8 | 61.3 | 59.7 | ||
| Services (As % of Sales) | % | ... | ... | ... | ... | ... | ... | ... | ... | 21.2 | 19.7 | 19.4 | 21.9 | ||
| Staff Cost (As % of Sales) | % | 10.4 | 13.3 | 14.1 | 15.9 | 15.0 | |||||||||
| Effective Tax Rate | % | 22.3 | 61.3 | -46.9 | 17.8 | 20.0 | |||||||||
| Total Revenue Growth (5-year average) | % | ... | ... | ... | ... | ... | -2.14 | -6.40 | -4.57 | -6.02 | 4.10 | ||||
| Total Revenue Growth (10-year average) | % | ... | ... | ... | ... | ... | ... | ... | ... | ... | ... | -0.572 | -0.239 |
Get all company financials in excel:


By Helgi Library - December 5, 2021
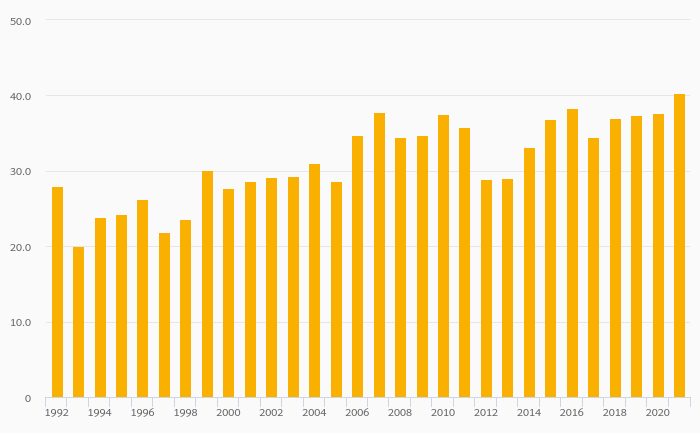
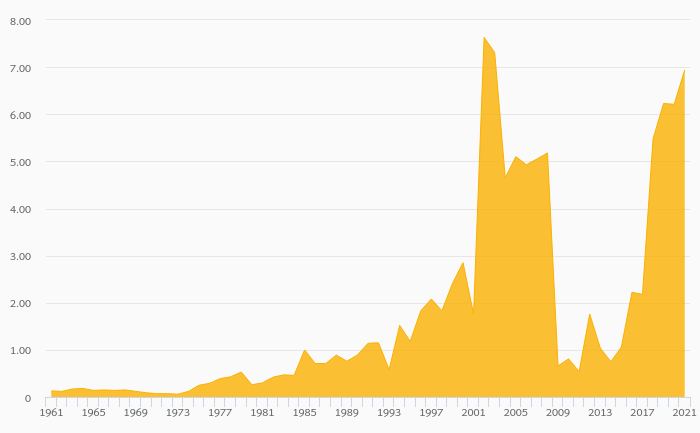
RI OKNA invested a total of CZK 1.22 mil in 2019, down 94.4% compared to the previous year. Historically, between 2012 - 2019, the company's investments stood at a high of CZK 56.4 mil in 2015 and a low of CZK 1.22 mil in 2019. As a p...
By Helgi Library - December 5, 2021
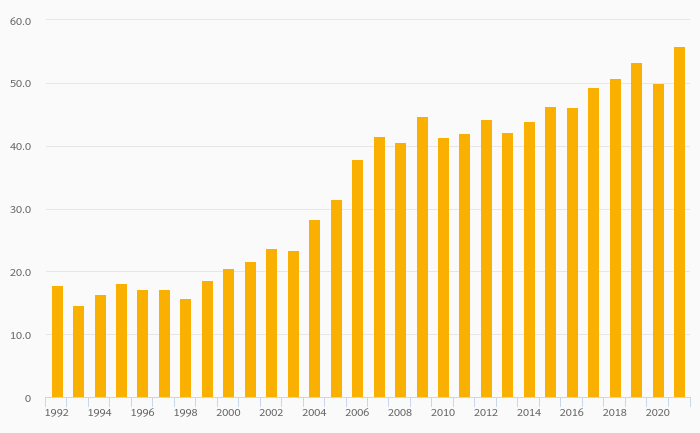
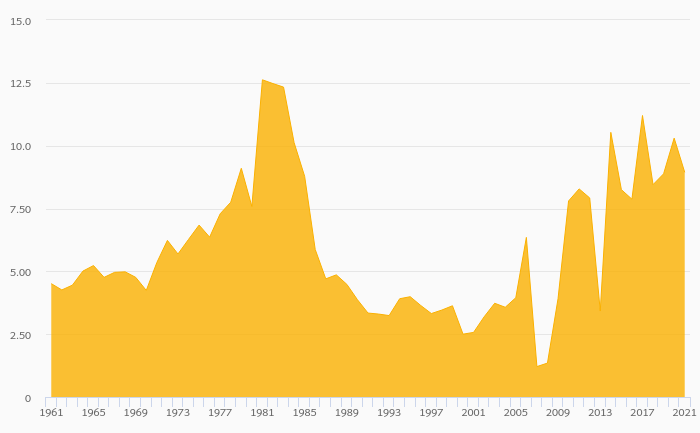
RI OKNA made a net profit of CZK 6.00 mil with revenues of CZK 843 mil in 2019, down by 50.7% and down by 6.01%, respectively, compared to the previous year. This translates into a net margin of 0.712%. Historically, between 2006 and 2019, the firm�...
By Helgi Library - December 5, 2021
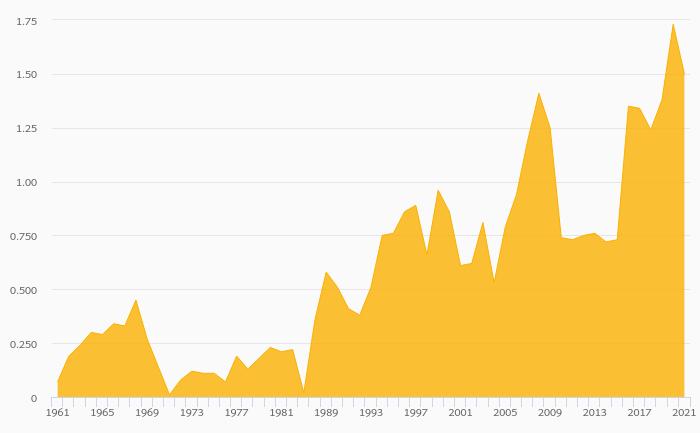
RI OKNA made a net profit of CZK 6.00 mil in 2019, down 50.7% compared to the previous year. Historically, between 2006 and 2019, the company's net profit reached a high of CZK 60.4 mil in 2007 and a low of CZK -8.35 mil in 2009. The result implies a retu...
By Helgi Library - December 5, 2021
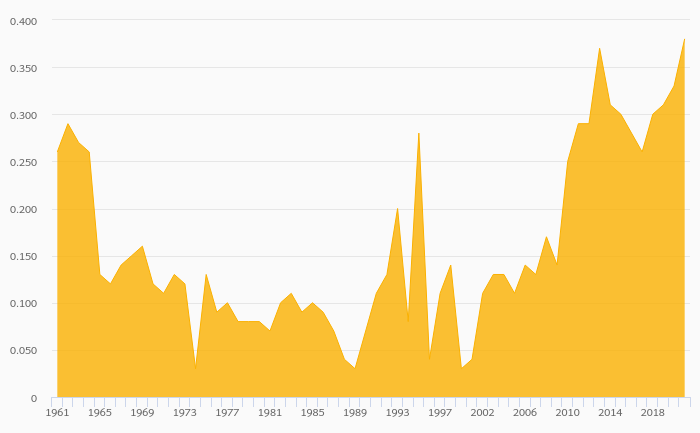
RI OKNA's net debt stood at CZK 98.2 mil and accounted for 52.3% of equity at the end of 2019. The ratio is down 24.6 pp compared to the previous year. Historically, the firm’s net debt to equity reached a high of 140% in 2008 and a low of -7...
RI OKNA, a.s. is a Czech Republic-based manufacturer of windows and doors. The Company manufactures windows and doors made of plastic, wood, aluminum, and wood/aluminum combination. The Company was establised in 1994, employs nearly 200 staff and is based in Bzenec, the Czech Republic.

RI OKNA has been growing its sales by 3.77% a year on average in the last 5 years. EBITDA has grown on average by 10.2% a year during that time to total of CZK 54.1 mil in 2019, or 6.42% of sales. That’s compared to 5.05% average margin seen in last five years.
The company netted CZK 6.00 mil in 2019 implying ROE of 3.25% and ROCE of 1.64%. Again, the average figures were 2.88% and 1.57%, respectively when looking at the previous 5 years.
RI OKNA’s net debt amounted to CZK 98.2 mil at the end of 2019, or 52.3% of equity. When compared to EBITDA, net debt was 1.82x, down when compared to average of 3.30x seen in the last 5 years.
 Helgi Library